 🏗️ New Construction
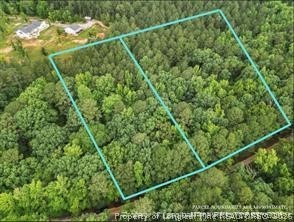
0 Lot 28 Chartres St · Mamers, NC
Flood risk 7/10 · Major
- FEMA flood zone
- X (unshaded)
- Chance of flooding over 30 yrs
- 0.99%
- Est. flood insurance / yr
- $507 – $1,088
Fire risk 3/10 · Minor
- Est. fire insurance / yr
- $906 – $1,684
Heat risk 6/10 · Moderate
- Hot days now (above 106°F)
- 7 days/yr
- Hot days in 30 yrs
- 17 days/yr
Wind risk 6/10 · Moderate
- Chance of severe wind over 30 yrs
- 58.0%
Air-quality risk 2/10 · Minimal
- Unhealthy air days now
- 1 days/yr
- Unhealthy air days in 30 yrs
- 1 days/yr
Risk factors via First Street. Map © Google.
Why this score? — see what drove the D grade
The composite is a weighted blend of 9 inputs, each scored 0–100. Each bar is that input's sub-score; the figure is the points it added to the 100-point composite (weight × sub-score).
- Cash flow +15.0/30.0
- ARV discount +7.5/15.0
- 1% rule +5.0/10.0
- DSCR +5.0/10.0
- Rent growth +3.3/5.0
- Livability +3.2/5.0
- Schools +3.0/10.0
- Condition / age +2.5/5.0
- Appreciation +0.0/10.0
$20,000
🖨 Deal sheet (PDF) 📄 Offer letter ✓ Due diligence
Listing remarks MLS
This homesite offers the perfect blend of privacy and neighborhood charm, with convenient access to local shopping, dining, and major highways. Enjoy a peaceful setting with room to create the custom home you’ve been envisioning in one of the area’s growing and sought-after locations. Adjacent lot 27 is also available.
Key facts
- Growing location
- Custom home
- Dining
Tags
Property features AI
Finance
- Other: Property listed as new construction
- HOA & community: Homeowners association with an annual fee of $40 (about $3.33/month)
Exterior
- Parking: Attached carport; Covered parking for 2 vehicles; 2-car garage
- Utilities: Water from spring and well; Sewer via holding tank and septic tank
- Home design: Single family residence; Two-story
- Construction: Vinyl siding
- Exterior features: New construction; Lot in Captains Landing subdivision; Lot approximately 0.45 acres
Interior
- Bedrooms: Total of 11 rooms (includes bedrooms and living spaces)
- Flooring: Carpet; Vinyl
- Bathrooms: Two full bathrooms; One half bathroom
- Heating & cooling: Central electric air conditioning
- Interior features: Carpet and vinyl flooring; No basement
Neighborhood map
What this means for you Summary
Snapshot
- This is a land listed at $20k.
Deal economics
- At list price, monthly cash flow is $1k ($16k/yr) — positive.
- The deal already cash-flows at list — no discount required.
- Meets the 1% rule at list price ($2k rent vs $20k).
- Recommended offer: $18k (12.0% below list) — sets the bar for market timing.
- Cap rate 89.9% vs local median 2.6% in Mamers — top-decile yield for the area; either an underpriced asset or a hidden risk that comps aren't pricing in. Stress-test before assuming the spread holds.
Location & tenants
- Location reads 63/100 on livability (#391 in NC) — a middle-class / working-renter tenant base. Strengths: cost of living A+, housing A+; Watch: crime C-, health & safety C-, amenities F.
- Harnett County Schools (rural): math 31% / reading 39% proficiency, ranked #130 of 178 in NC (top 73%) — families likely to look elsewhere, expect single-tenant / working-renter base with shorter leases.
- Zoned schools: Lafayette Elementary (math 50% / reading 49%, grade D, #417 of 1,410 statewide, top 32%, 625 students, 39% FRL); Harnett Central Middle (math 25% / reading 38%, grade F, #323 of 475 statewide, top 68%, 1,024 students, 63% FRL); Harnett Central High (math 43% / reading 51%, grade D-, #334 of 535 statewide, top 64%, 1,474 students, 56% FRL) — zoned schools at 53% FRL track the district average.
- Market conditions: Rents rising (+3.1%/yr); 1165 active listings in the ZIP; high-income renter base; 2,080 units permitted in Harnett County in 2024 (12 in 5+ unit buildings).
Forward outlook
- Local home prices are declining (-3.0%/yr); year-one equity from $138 of loan paydown is wiped out by about $600 of value loss. Plan a longer hold.
- Harnett County population projected at +42% by 2050 — long-run rental-demand tailwind backs the buy-and-hold thesis.
- At projected returns (-3.0% appreciation + 3.1% rent growth), your $6k cash investment doubles in ~1 year — after that, you're playing with house money.
Negotiation context
- It's been on market 124 days — a 12% lower offer ($18k) is reasonable based on typical stale-listing flexibility.
- 3 sale attempts; this cycle's ask has dropped $221k (92%) from the opening price — seller is motivated, your offer sets the floor, not the list.
Risks & watch-outs
- Watch-outs: flood insurance adds $66/mo.
- Climate carrying-cost: major flood risk; major wind risk, 58% chance of damaging wind over 30y; extreme-heat days projected 7→17/yr by 2055 (HVAC capex compounding) — expect insurance premiums to compound above CPI over the hold.
Questions for the listing agent
- It's been on market 124 days. Have you received any prior offers? Is the seller open to a 12% concession, seller financing, or rate buy-down credit?
- What's the actual annual flood-insurance premium (NFIP or private), and is the property in a SFHA with mandatory coverage?
- Why hasn't it sold? Are there any deal-killer items the seller is aware of (foundation, flood, title, zoning, code violations)?
- Is there a deadline driving the sale (1031 exchange, divorce, estate, relocation)? That informs how much negotiation room exists.
- Schools are F-rated, which usually means shorter tenancies and higher turnover. Who's the typical renter profile here, and what's been the actual vacancy rate?
- The area grade is low — what's the realistic commute time and amenity access for the typical tenant pool here? Any planned neighborhood developments (good or bad) we should know about?
- What's the average days-on-market for RENTAL listings here right now (not sales)? A rising rental-DOM trend means longer vacancies and softer asking-rent achievability than the comps imply.
- What's the recent tenant-quality profile in this submarket — average credit score on applications, eviction rate, late-payment / NSF rate, and stable-employment percentage? A property-management company in the area should have these aggregated.
- How much new for-sale + rental construction is in the pipeline within 1–3 miles? Heavy new supply typically softens prices + rents 12–24 months out; constrained supply supports both.
Investment metrics
- 1% rule
- 9.70% ✓
- Cap rate
- 89.93%
- Cash-on-cash
- 298.70%
- DSCR
- 14.29
- GRM
- 0.9
CMA / ARV
No comps found within radius.
Show comp detail 12 sales within ~0.75 mi
| Address | Dist | Beds/Ba | Sqft | Sold | Price | $/sf | Match |
|---|---|---|---|---|---|---|---|
| 0 Bourbon St | 0.19mi | —/— | — | 18mo | $44,000 | — | 64 |
| 131 Dauphine St | 0.26mi | —/— | — | 14mo | $40,000 | — | 64 |
| 0 Ponchartrain St | 0.36mi | —/— | — | 13mo | $45,000 | — | 60 |
| Lot #45 Chartress Street St | 0.21mi | —/— | — | 22mo | $20,000 | — | 60 |
| 1 Natchez Trce | 0.51mi | —/— | — | 5mo | $45,000 | — | 60 |
| 114 Basin St | 0.61mi | —/— | — | 1mo | $20,000 | — | 58 |
| Lot 10 Natchez Trace Lot 10 Blk 1 | 0.51mi | —/— | — | 6mo | $65,000 | — | 58 |
| 285 Natchez Trce | 0.32mi | —/— | — | 21mo | $60,000 | — | 55 |
| 878 Natchez Trce | 0.36mi | —/— | — | 20mo | $30,000 | — | 54 |
| 1141 Natchez Trce | 0.58mi | —/— | — | 13mo | $25,500 | — | 49 |
| 1159 Natchez Trce | 0.60mi | —/— | — | 13mo | $25,500 | — | 48 |
| 0 Clay St | 0.62mi | —/— | — | 24mo | $30,000 | — | 39 |
Match score weights: distance 35% · size 25% · config 20% · recency 20%. Top-matched comps best support the ARV.
Projected returns pro-forma
-3.0% appreciation · 3.12% rent growth · sell at horizon
- IRR
- —
- Equity multiple
- 15.57×
- Total profit
- $81,610
- Equity at exit
- $2,982
- IRR
- —
- Equity multiple
- 33.35×
- Total profit
- $181,180
- Equity at exit
- $1,729
Cash invested: $5,600 (down + closing). Projections, not guarantees.
Landlord ↔ Tenant lean methodology
- Overall (STATE)
- 85 Strongly Landlord-Friendly
- State North Carolina
- 85 Strongly Landlord-Friendly · R+3
- County
- — inherits STATE
- City
- — inherits STATE
ZIP-level market 27526
- Home prices YoY
- -33.0%
- Rents YoY
- 3.1%
- Active inventory
- 1165
- Price-to-rent
- 0.9×
Monthly cashflow live
- Estimated rent
- $1,939 medium interval (Pro) →
- Mortgage (P&I)
- −$105
- Tax est. 1.5%
- −$25 /mo · $300/yr
- Insurance
- −$8
- Flood insurance flood zone
- −$66 /mo · $798/yr
- HOA
- −$0
- Vacancy / Maint / Mgmt
- −$407
- Net cashflow
- $1,327
Break-even live
Sensitivity live
| Price | -10% $1,341 | -5% $1,334 | +0% $1,327 | +5% $1,321 | +10% $1,314 |
|---|---|---|---|---|---|
| Rent | -10% $1,174 | -5% $1,251 | +0% $1,327 | +5% $1,404 | +10% $1,481 |
| Rate | -1.0pp $1,338 | -0.5pp $1,333 | base $1,327 | +0.5pp $1,322 | +1.0pp $1,317 |
UW: 25.0% down · 7.5% · 30yr · 1.5% tax · 5.0% vac · 8.0% maint · 8.0% mgmt
Financing live
Cash to close
- Down payment
- $5,000
- Closing costs
- $600
- Reserves months
- —
- Total cash needed
- —
Loan-product check · same deal, 3 products live
Conventional
25% down · 7.5% · 30yr
- Down + closing
- —
- Monthly P&I
- —
- Monthly cashflow
- —
- DSCR
- —
- Eligible?
- —
Personal DTI + credit; lowest rate.
DSCR
20% down · 8.5% · 30yr
- Down + closing
- —
- Monthly P&I
- —
- Monthly cashflow
- —
- DSCR
- —
- Eligible?
- —
No personal income docs; deal must DSCR.
Hard money
10% down · 12.0% · 12mo
- Down + closing
- —
- Monthly P&I
- —
- Monthly cashflow
- —
- DSCR
- —
- Eligible?
- —
Short-term bridge; refi at stabilization.
Listing history 22 events
-
2026-06-21days on market $20,000 Active 124 DOM
-
2026-06-18days on market $20,000 Active 121 DOM
-
2026-06-17days on market $20,000 Active 120 DOM
-
2026-06-16days on market $20,000 Active 119 DOM
-
2026-06-15days on market $20,000 Active 118 DOM
-
2026-06-14pricedays on market $20,000 Active 116 DOM
-
2026-06-10days on market $319,000 Active 93 DOM
-
2026-06-09days on market $319,000 Active 92 DOM
-
2026-06-08days on market $319,000 Active 91 DOM
-
2026-06-07days on market $319,000 Active 90 DOM
-
2026-06-05days on market $319,000 Active 87 DOM
-
2026-06-03days on market $319,000 Active 86 DOM
-
2026-06-02days on market $319,000 Active 85 DOM
-
2026-06-01days on market $319,000 Active 84 DOM
-
2026-05-31days on market $319,000 Active 83 DOM
-
2026-05-30days on market $319,000 Active 82 DOM
-
2026-04-13price $20,000 332-char remark
Show marketing remark (332 chars)
This homesite offers the perfect blend of privacy and neighborhood charm, with convenient access to local shopping, dining, and major highways. Enjoy a peaceful setting with room to create the custom home you’ve been envisioning in one of the area’s growing and sought-after locations. Adjacent lot 27 is also available.
-
2026-03-17price $319,000
-
2026-03-09$240,900 Active
-
2026-02-17$30,000 Active 332-char remark
Show marketing remark (332 chars)
This homesite offers the perfect blend of privacy and neighborhood charm, with convenient access to local shopping, dining, and major highways. Enjoy a peaceful setting with room to create the custom home you’ve been envisioning in one of the area’s growing and sought-after locations. Adjacent lot 27 is also available.
-
2025-08-22price $30,000
-
2025-06-17$37,290 Active
ⓘ Source: listings_history table (triggers on properties + properties_extension) + one-shot
backfill from property_details.listing_events for pre-trigger history.
Climate risk First Street
- Flood 7/10 Severe FEMA zone X (unshaded) · 99% chance over 30 yrs
- Wildfire 3/10 Moderate
- Heat 6/10 Major 7 d/yr ≥106°F today · 17 d/yr by 30 yrs out
- Wind 6/10 Major 58% chance of damaging wind over 30 yrs
- Air quality 2/10 Low 1 unhealthy d/yr today · 1 by 30 yrs out
Nearby sold comps map
Loading sold comps map…
Walkable amenities ~0.75 mi
Loading nearby amenities…
Taxation est. · year 1
- Rental income
- $23,273
- − Mortgage interest
- −$1,120
- − Property taxes
- −$300
- − Insurance
- −$897
- − Repairs & maintenance
- −$1,862
- − Management
- −$1,862
- − Depreciation
- −$582
- Taxable income
- $16,650
- Est. tax owed @ 24.0%
- −$3,996
- After-tax cash flow
- $11,934/yr
For passive investors: Depreciation is non-cash, so a rental often shows a tax loss while cash-flowing — sheltering income. Rental losses are passive: they offset passive income freely, and up to $25,000/yr can offset ordinary (W-2) income if you actively participate and your MAGI is under $100k (phasing out to $0 by $150k); unused losses carry forward. On sale, claimed depreciation is recaptured at up to 25%, and gains may owe capital-gains tax (a 1031 exchange can defer both). Figures are a year-1 estimate at your 24.0% rate — not tax advice; consult a CPA.
Schools (NCES district)
- District
- Harnett County Schools
- NCES district ID
- 3702010
- Math proficiency
- 31% ▼ -2.00%
- Reading proficiency
- 39% ▼ -1.00%
- Median HH income
- $45,400
- Composite
- 29.88/100
- National rank
- #6397
- State rank
- #130 of 178 in NC
Livability — Mamers
- Score
- 63/100
- State rank
- #391
- US rank
- #15191
Category grades
Schools grade is shown separately in the Schools card above.
Census & demographics
- County
- Wake County · 1,216,256 people
- Metro
- Raleigh-Cary, NC
- Population (ZIP)
- 61,588
- Household income
- $110,017
- Rent vs Own
- Severe rent burden
- 844.0
Population outlook (Harnett County) Hauer SSP2
- Today (2025)
- 153,758 people
- By 2030
- 166,581 · +8.3%
- By 2040
- 192,741 · +25.4%
- By 2050
- 218,332 · +42.0%
- By 2075
- 275,422 · +79.1%
- By 2100
- 313,511 · +103.9%
Race, ethnicity, and origin ACS 2023
- Neighborhood character
- Predominantly White (70%)
- Race & ethnicity
- White 70% Black 14% Hispanic / Latino 10% Two or more races 9% Asian 2%
- Hispanic origin (detail)
- Mexican 6% Puerto Rican 2%
- Common ancestry
- Slovak 3% Romanian 2% Italian 2%
- Foreign-born
- 6% · Canada
- Languages at home
- 90% English-only · Spanish 6% Other Indo-European 1% French/Haitian/Cajun 1%
Political lean MEDSL · Harnett
- 2024 margin
- Strong R (+25.1) · D 36.9% · R 62.0% · Other 1.1%
- 2008→2024 swing
- -8.4pp toward R · 2008: -16.7pp · 2024: -25.1pp
- All cycles
- 2024: R+25.1 2020: R+22.4 2016: R+24.1 2012: R+19.4 2008: R+16.7
Not yet ingested
- Civics
- —
Market trends
- HPI YoY
- ▼ -121.48%
- Current HPI
- 246.1976
- Rent YoY
- ▲ 3.12%
- Metro
- Raleigh-Cary, NC
- State GDP YoY
- ▲ 3.28%
- F500 in state
- 26
Industry mix (Fortune 500 HQ in NC)
| Industry | F500 HQs | Revenue |
|---|---|---|
| Financial Services | 2 | $213B |
|
||
| Retail | 2 | $95B |
|
||
| Industrial Conglomerate | 1 | $38B |
|
||
| Metals / Steel | 1 | $35B |
|
||
| Utilities | 1 | $30B |
|
||
| Industrial Machinery | 1 | $19B |
|
||
Price history
-46.4% since first listed6 events — show timeline
- 2026-04-13 Price Changed $20,000 LPRMLS
- 2026-03-17 Price Changed $319,000 LPRMLS
- 2026-03-09 Listed $240,900 LPRMLS
- 2026-02-17 Listed $30,000 LPRMLS
- 2025-08-22 Price Changed $30,000 LPRMLS
- 2025-06-17 Listed $37,290 LPRMLS
Cash-flow waterfall
monthlySold comps — $/sqft
last 12 mo · ≤1 miLoading sold comps…