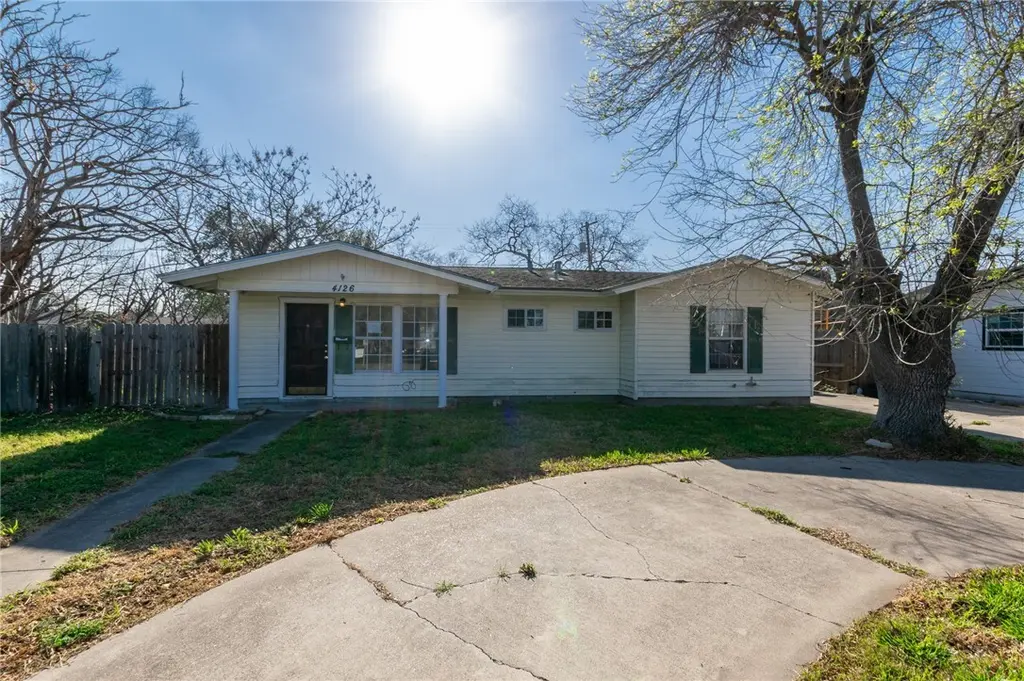
4126 Robinhood Dr · Corpus Christi, TX
Flood risk 7/10 · Major
- FEMA flood zone
- X (unshaded)
- Chance of flooding over 30 yrs
- 0.99%
- Est. flood insurance / yr
- $507 – $1,088
Fire risk 1/10 · Minimal
- Est. fire insurance / yr
- $1,222 – $2,270
Heat risk 10/10 · Severe
- Hot days now (above 107°F)
- 7 days/yr
- Hot days in 30 yrs
- 25 days/yr
Wind risk 9/10 · Severe
- Chance of severe wind over 30 yrs
- 99.0%
Air-quality risk 1/10 · Minimal
- Unhealthy air days now
- 0 days/yr
- Unhealthy air days in 30 yrs
- 0 days/yr
Risk factors via First Street. Map © Google.
Why this score? — see what drove the B- grade
The composite is a weighted blend of 9 inputs, each scored 0–100. Each bar is that input's sub-score; the figure is the points it added to the 100-point composite (weight × sub-score).
- Cash flow +23.8/30.0
- ARV discount +15.0/15.0
- 1% rule +8.4/10.0
- DSCR +7.7/10.0
- Rent growth +4.5/5.0
- Livability +3.9/5.0
- Schools +2.8/10.0
- Condition / age +2.5/5.0
- Appreciation +0.0/10.0
$113,500
🖨 Deal sheet 📄 Offer letter ✓ Due diligence
Listing remarks MLS
Adorable three bedroom, one bath home! All new paint throughout, updated kitchen and more. Great starter home. This home boasts beautiful trees to offer shade for family cookouts and lazy afternoons in the yard! Call and schedule your showing today!
Key facts
- Covered patio
- Functional layout
- 7,606 sq ft lot
Tags
Neighborhood map
What this means for you Summary
Snapshot
- This is a 3-bed/1.5-bath single-family listed at $114k.
Deal economics
- At list price, monthly cash flow is $152 ($2k/yr) — positive.
- The deal already cash-flows at list — no discount required.
- Meets the 1% rule at list price ($2k rent vs $114k).
- Cap rate 8.6% vs local median 3.6% in Corpus Christi — top-decile yield for the area; either an underpriced asset or a hidden risk that comps aren't pricing in. Stress-test before assuming the spread holds.
Location & tenants
- Location reads 78/100 on livability (#66 in TX, #2,404 nationally) — a middle-class / working-renter tenant base. Strengths: commute A+, cost of living A+, housing A+; Watch: crime F.
- Corpus Christi ISD (urban): math 31% / reading 35% proficiency, ranked #562 of 826 in TX (top 68%) — families likely to look elsewhere, expect single-tenant / working-renter base with shorter leases; 63% free/reduced lunch — lower-income household profile, screen leases tightly.
- Market conditions: Rents rising fast (+7.9%/yr); 142 active listings in the ZIP; 36 comparable units currently listed for rent nearby; rentals lingering (median 44d on market — plan ~5-8 weeks vacancy on turnover, expect pricing pressure); 50% of comp listings sitting > 30 days — soft ceiling on asking rent; 1,397 units permitted in Nueces County in 2024 (47 in 5+ unit buildings).
- This rent runs 32% of the median local income ($58k/yr) — at the standard rent-burdened threshold; future hikes will face affordability resistance.
Forward outlook
- Local home prices are declining (-3.0%/yr); year-one equity from $785 of loan paydown is wiped out by about $3k of value loss. Plan a longer hold.
- Nueces County population projected at +36% by 2050 — long-run rental-demand tailwind backs the buy-and-hold thesis.
- At projected returns (-3.0% appreciation + 7.9% rent growth), your $32k cash investment doubles in ~8 years — after that, you're playing with house money.
Negotiation context
- Only 10 days on market — expect competitive offers; lowballing is unlikely to land.
- 7 sale attempts since 29y ago with the ask held roughly flat each time — persistent listings suggest the price (not the market) is what's stuck; bring a comps-based counter.
- Current owner paid $49k; list at $114k implies a 132% gain — meaningful room to come down on a strong offer.
Risks & watch-outs
- Watch-outs: property tax is 3.6% of price; flood insurance adds $66/mo; built in 1955 — expect roof / HVAC / electrical / plumbing capex.
- Climate carrying-cost: major flood risk; severe wind risk, 99% chance of damaging wind over 30y; extreme-heat days projected 7→25/yr by 2055 (HVAC capex compounding) — expect insurance premiums to compound above CPI over the hold.
Questions for the listing agent
- Built in 1955 — when were the roof, HVAC, electrical panel, plumbing, and water heater last replaced?
- Property tax is high relative to price — has the assessment been appealed recently, and will the sale trigger a re-assessment?
- What's the actual annual flood-insurance premium (NFIP or private), and is the property in a SFHA with mandatory coverage?
- Is there a deadline driving the sale (1031 exchange, divorce, estate, relocation)? That informs how much negotiation room exists.
- Crime grade is F in this area — have there been break-ins, vandalism, or insurance claims at this property in the last 3 years? What carrier currently insures it and at what premium?
- What's the average days-on-market for RENTAL listings here right now (not sales)? A rising rental-DOM trend means longer vacancies and softer asking-rent achievability than the comps imply.
- What's the recent tenant-quality profile in this submarket — average credit score on applications, eviction rate, late-payment / NSF rate, and stable-employment percentage? A property-management company in the area should have these aggregated.
- How much new for-sale + rental construction is in the pipeline within 1–3 miles? Heavy new supply typically softens prices + rents 12–24 months out; constrained supply supports both.
Investment metrics
- 1% rule
- 1.34% ✓
- Cap rate
- 8.60%
- Cash-on-cash
- 8.24%
- DSCR
- 1.37
- GRM
- 6.2
CMA / ARV
- ARV (on-the-fly)
- $179,172
- Comps found
- 12
Show comp detail 12 sales within ~0.75 mi
| Address | Dist | Beds/Ba | Sqft | Sold | Price | $/sf | Match |
|---|---|---|---|---|---|---|---|
| 1013 Peerman Pl | 0.30mi | 3/1.0 | 1,196 (+6%) | 3mo | $189,000 | $158 | 73 |
| 1031 Wilshire Pl | 0.42mi | 3/1.0 | 1,159 (+2%) | 5mo | $164,000 | $142 | 71 |
| 4025 Markins Dr | 0.33mi | 3/1.0 | 1,208 (+6%) | 2mo | $174,900 | $145 | 70 |
| 4018 Stirman St | 0.59mi | 3/2.0 | 1,109 (-2%) | 1mo | $195,000 | $176 | 66 |
| 3937 Linden St | 0.38mi | 3/2.0 | 1,211 (+7%) | 5mo | $175,000 | $145 | 65 |
| 1022 Miramar Pl | 0.36mi | 3/1.5 | 1,264 (+12%) | 1mo | $165,000 | $131 | 63 |
| 4221 Herndon St | 0.45mi | 3/1.5 | 1,218 (+7%) | 4mo | $179,000 | $147 | 63 |
| 4010 Lowman St | 0.43mi | 3/2.0 | 1,234 (+9%) | 1mo | $140,000 | $113 | 63 |
| 4805 Alice St | 0.75mi | 3/2.0 | 1,130 (-0%) | 2mo | $185,000 | $164 | 61 |
| 3922 Bradford Dr | 0.63mi | 4/1.0 (+1) | 1,180 (+4%) | 3mo | $189,000 | $160 | 55 |
| 4405 Totton Dr | 0.69mi | 3/1.5 | 1,207 (+6%) | 4mo | $225,000 | $186 | 54 |
| 4621 Calvin Dr | 0.71mi | 3/1.5 | 1,019 (-10%) | 1mo | $161,000 | $158 | 50 |
Match score weights: distance 35% · size 25% · config 20% · recency 20%. Top-matched comps best support the ARV.
Projected returns pro-forma
-3.0% appreciation · 7.91% rent growth · sell at horizon
- IRR
- -0.5%
- Equity multiple
- 0.98×
- Total profit
- $-634
- Equity at exit
- $16,923
- IRR
- 14.7%
- Equity multiple
- 2.53×
- Total profit
- $48,541
- Equity at exit
- $9,813
Cash invested: $31,780 (down + closing). Projections, not guarantees.
Landlord ↔ Tenant lean methodology
- Overall (STATE)
- 87 Strongly Landlord-Friendly
- State Texas
- 87 Strongly Landlord-Friendly · R+5
- County
- — inherits STATE
- City
- — inherits STATE
ZIP-level market 78411
- Rents YoY
- 7.9%
- Active inventory
- 142
- Price-to-rent
- 6.2×
Monthly cashflow live
- Estimated rent
- $1,523 high interval (Pro) →
- Mortgage (P&I)
- −$595
- Tax from tax record
- −$343 /mo · $4,110/yr
- Insurance
- −$47
- Flood insurance flood zone
- −$66 /mo · $798/yr
- HOA
- −$0
- Vacancy / Maint / Mgmt
- −$320
- Net cashflow
- $152
Break-even live
UW: 25.0% down · 7.5% · 30yr · 1.5% tax · 5.0% vac · 8.0% maint · 8.0% mgmt
Financing live
Cash to close
- Down payment
- $28,375
- Closing costs
- $3,405
- Reserves months
- —
- Total cash needed
- —
Loan-product check · same deal, 3 products live
Conventional
25% down · 7.5% · 30yr
- Down + closing
- —
- Monthly P&I
- —
- Monthly cashflow
- —
- DSCR
- —
- Eligible?
- —
Personal DTI + credit; lowest rate.
DSCR
20% down · 8.5% · 30yr
- Down + closing
- —
- Monthly P&I
- —
- Monthly cashflow
- —
- DSCR
- —
- Eligible?
- —
No personal income docs; deal must DSCR.
Hard money
10% down · 12.0% · 12mo
- Down + closing
- —
- Monthly P&I
- —
- Monthly cashflow
- —
- DSCR
- —
- Eligible?
- —
Short-term bridge; refi at stabilization.
Rent comps 36 comps
| Address | Beds | Baths | Sqft | Rent | $/sqft | DOM | Units | Dist |
|---|---|---|---|---|---|---|---|---|
| 4213 Lowman St Corpus Christi, TX | 2.0 | 1.0 | 810 | $1,195 | $1.48 | 21d | 1 | 0.37mi |
| 4322 Fir St Corpus Christi, TX | 2.0 | 1.0 | 758 | $1,195 | $1.58 | 43d | 1 | 0.53mi |
| 4110 Grossman Dr Unit B Corpus Christi, TX | 3.0 | 2.0 | 1228 | $1,500 | $1.22 | 43d | 1 | 0.55mi |
| 4717 Edith St Unit 1268436P Corpus Christi, TX | 4.0 | 2.0 | 1496 | $4,708 | $3.15 | 43d | 1 | 0.68mi |
| 802 Barry St Corpus Christi, TX | 2.0 | 1.5 | 1102 | $1,529 | $1.39 | 43d | 1 | 0.68mi |
| 3738 Marion St Corpus Christi, TX | 3.0 | 1.0 | 1100 | $1,295 | $1.18 | 43d | 1 | 0.78mi |
| 4805 Lavaca Dr Unit 1 Corpus Christi, TX | 2.0 | 1.0 | 1030 | $1,300 | $1.26 | 21d | 1 | 0.80mi |
| 3535 Cottonwood St Apt H2 Corpus Christi, TX | 2.0 | 1.0 | 731 | $870 | $1.19 | 43d | 1 | 0.83mi |
| 4002 McArdle Rd Corpus Christi, TX | 3.0 | 1.0 | 1018 | $1,095 | $1.08 | 13d | 1 | 0.84mi |
| 4830 French Dr Corpus Christi, TX | 3.0 | 2.0 | 1299 | $1,700 | $1.31 | 13d | 1 | 0.84mi |
| 4201 Junior Ter Corpus Christi, TX | 3.0 | 1.0 | 1016 | $1,600 | $1.57 | 43d | 1 | 0.89mi |
| 1410 Ray Dr Corpus Christi, TX | 3.0 | 1.0 | 1224 | $1,600 | $1.31 | 13d | 1 | 0.93mi |
| 4845 Concord St Corpus Christi, TX | 4.0 | 2.0 | 1437 | $1,750 | $1.22 | 13d | 1 | 0.98mi |
| 318 Aberdeen Ave Unit 1268410P Corpus Christi, TX | 3.0 | 1.5 | 1076 | $4,405 | $4.09 | 43d | 1 | 1.03mi |
| 3562 Topeka St Corpus Christi, TX | 3.0 | 1.0 | 1208 | $1,695 | $1.40 | 13d | 1 | 1.06mi |
| 722 Collingswood Dr Corpus Christi, TX | 3.0 | 1.5 | 1318 | $1,595 | $1.21 | 13d | 1 | 1.06mi |
| 4822 Mokry Dr Corpus Christi, TX | 2.0 | 1.0 | 903 | $1,200 | $1.33 | 21d | 1 | 1.08mi |
| 4961 Monitor St Corpus Christi, TX | 2.0 | 1.0 | 725 | $1,150 | $1.59 | 21d | 1 | 1.11mi |
| 3509 Topeka St Corpus Christi, TX | 2.0 | 1.0 | 1114 | $1,850 | $1.66 | 43d | 1 | 1.13mi |
| 4322 Kostoryz Rd Corpus Christi, TX | 2.0 | 1.5 | 1100 | $1,259 | $1.14 | 43d | 1 | 1.14mi |
| 4942 Anthony St Corpus Christi, TX | 3.0 | 1.0 | 1014 | $1,595 | $1.57 | 13d | 1 | 1.14mi |
| 4422 S Alameda St Corpus Christi, TX | 1.0–3.0 | 1.0–2.0 | 820 | $1,000 | $1.22 | 13d | 1 | 1.16mi |
| 5002 Bevly Dr Unit A Corpus Christi, TX | 3.0 | 2.0 | 1400 | $1,499 | $1.07 | 21d | 1 | 1.20mi |
| 3333 S Alameda St Corpus Christi, TX | 3.0 | 2.0 | 1000 | $1,149 | $1.15 | 43d | 1 | 1.21mi |
| 100 Buccaneer Dr Corpus Christi, TX | 2.0 | 1.0 | 850 | $900 | $1.06 | 43d | 1 | 1.21mi |
| 4224 Ocean Dr Corpus Christi, TX | 2.0 | 1.0 | 699 | $949 | $1.36 | 43d | 7 | 1.25mi |
| 749 Ashland Dr Corpus Christi, TX | 3.0 | 1.0 | 1179 | $1,550 | $1.31 | 43d | 1 | 1.26mi |
| 3936 Brushwood Ln Corpus Christi, TX | 2.0 | 1.0 | 900 | $925 | $1.03 | 43d | 1 | 1.26mi |
| 4801 Lansdown Dr Corpus Christi, TX | 3.0 | 2.0 | 1242 | $1,525 | $1.23 | 13d | 1 | 1.28mi |
| 5220 Weber Rd Corpus Christi, TX | 2.0 | 1.0 | 840 | $1,200 | $1.43 | 21d | 1 | 1.30mi |
| 5220 Weber Rd Unit G-101 Corpus Christi, TX | 2.0 | 1.5 | 840 | $1,200 | $1.43 | 21d | 1 | 1.30mi |
| 4302 Ocean Dr Corpus Christi, TX | 3.0 | 2.0 | 1420 | $2,100 | $1.48 | 44d | 1 | 1.36mi |
| 4302 Ocean Dr Corpus Christi, TX | 3.0 | 2.0 | 1420 | $2,050 | $1.44 | 43d | 2 | 1.37mi |
| 4625 Kostoryz Rd Unit 108 Corpus Christi, TX | 2.0 | 1.0 | 720 | $975 | $1.35 | 43d | 1 | 1.38mi |
| 4502 Corona Dr Corpus Christi, TX | 1.0–2.0 | 1.0–2.0 | 855 | $1,000 | $1.17 | 13d | 1 | 1.42mi |
| 621 Glazebrook St Corpus Christi, TX | 2.0 | 1.0 | 750 | $895 | $1.19 | 13d | 1 | 1.45mi |
Listing history 19 events
-
2026-05-01status Pending
-
2026-04-23historical
-
2026-04-13$113,500 Active
-
2025-09-19price $149,000
-
2025-08-24price $155,000
-
2025-06-02price $165,000
-
2025-04-22$170,000 Active
-
2020-09-02historical 249-char remark
Show marketing remark (249 chars)
Adorable three bedroom, one bath home! All new paint throughout, updated kitchen and more. Great starter home. This home boasts beautiful trees to offer shade for family cookouts and lazy afternoons in the yard! Call and schedule your showing today!
-
2020-08-14soldstatus Closed 249-char remark
Show marketing remark (249 chars)
Adorable three bedroom, one bath home! All new paint throughout, updated kitchen and more. Great starter home. This home boasts beautiful trees to offer shade for family cookouts and lazy afternoons in the yard! Call and schedule your showing today!
-
2020-06-28status Pending 249-char remark
Show marketing remark (249 chars)
Adorable three bedroom, one bath home! All new paint throughout, updated kitchen and more. Great starter home. This home boasts beautiful trees to offer shade for family cookouts and lazy afternoons in the yard! Call and schedule your showing today!
-
2020-06-20historical Active Under Contract 249-char remark
Show marketing remark (249 chars)
Adorable three bedroom, one bath home! All new paint throughout, updated kitchen and more. Great starter home. This home boasts beautiful trees to offer shade for family cookouts and lazy afternoons in the yard! Call and schedule your showing today!
-
2020-03-18$140,000 Active 249-char remark
Show marketing remark (249 chars)
Adorable three bedroom, one bath home! All new paint throughout, updated kitchen and more. Great starter home. This home boasts beautiful trees to offer shade for family cookouts and lazy afternoons in the yard! Call and schedule your showing today!
-
2013-03-01$109,500
-
2011-06-18$97,600
-
2007-05-11soldstatus
-
2007-05-08soldstatus
-
2007-02-27$99,900
-
1997-06-18soldstatus $49,000
-
1997-04-08$56,000
ⓘ Source: listings_history table (triggers on properties + properties_extension) + one-shot
backfill from property_details.listing_events for pre-trigger history.
Tax reassessment forecast TX · Resets to sale price
- Current annual tax
- $4,110 · $343/mo
- Projected year-2 tax
- $4,110 · $343/mo
- Expected delta
- $0/yr ($0/mo · 0.0%)
ⓘ Screening estimate from a state-policy table — verify with the county assessor before closing.
Climate risk First Street
- Flood 7/10 Severe FEMA zone X (unshaded) · 99% chance over 30 yrs
- Wildfire 1/10 Low
- Heat 10/10 Extreme 7 d/yr ≥107°F today · 25 d/yr by 30 yrs out
- Wind 9/10 Extreme 99% chance of damaging wind over 30 yrs
- Air quality 1/10 Low 0 unhealthy d/yr today · 0 by 30 yrs out
Nearby sold comps map
Loading sold comps map…
Walkable amenities ~0.75 mi
Loading nearby amenities…
Taxation est. · year 1
- Rental income
- $18,279
- − Mortgage interest
- −$6,358
- − Property taxes
- −$4,110
- − Insurance
- −$1,365
- − Repairs & maintenance
- −$1,462
- − Management
- −$1,462
- − Depreciation
- −$3,302
- Taxable income
- $219
- Est. tax owed @ 24.0%
- −$53
- After-tax cash flow
- $1,770/yr
For passive investors: Depreciation is non-cash, so a rental often shows a tax loss while cash-flowing — sheltering income. Rental losses are passive: they offset passive income freely, and up to $25,000/yr can offset ordinary (W-2) income if you actively participate and your MAGI is under $100k (phasing out to $0 by $150k); unused losses carry forward. On sale, claimed depreciation is recaptured at up to 25%, and gains may owe capital-gains tax (a 1031 exchange can defer both). Figures are a year-1 estimate at your 24.0% rate — not tax advice; consult a CPA.
Schools (NCES district)
- District
- Corpus Christi ISD
- NCES district ID
- 4815270
- Math proficiency
- 31% ▼ -18.00%
- Reading proficiency
- 35% ▼ -7.00%
- Median HH income
- $45,672
- Composite
- 28.27/100
- National rank
- #6793
- State rank
- #562 of 826 in TX
Livability — Corpus Christi
- Score
- 78/100
- State rank
- #66
- US rank
- #2404
Category grades
Schools grade is shown separately in the Schools card above.
Census & demographics
- Census place
- Corpus Christi, TX
- County
- Nueces County · 296,836 people
- City population
- 296,836
- Metro
- Corpus Christi, TX
- Population (ZIP)
- 23,682
- Household income
- $57,742
- Rent vs Own
- Severe rent burden
- 1284.0
Population outlook (Nueces County) Hauer SSP2
- Today (2025)
- 418,037 people
- By 2030
- 447,123 · +7.0%
- By 2040
- 505,911 · +21.0%
- By 2050
- 567,522 · +35.8%
- By 2075
- 729,686 · +74.6%
- By 2100
- 847,087 · +102.6%
Race, ethnicity, and origin ACS 2023
- Neighborhood character
- Majority Hispanic (58%)
- Race & ethnicity
- Hispanic / Latino 58% White 35% Two or more races 29% Black 3% Asian 2%
- Hispanic origin (detail)
- Mexican 51%
- Common ancestry
- Slovak 2% Italian 1% Serbian 1%
- Foreign-born
- 6% · Canada
- Languages at home
- 75% English-only · Spanish 23% Tagalog/Filipino 1% Other Indo-European 1%
Political lean MEDSL · Nueces
- 2024 margin
- R (+11.5) · D 43.8% · R 55.3%
- 2008→2024 swing
- -7.1pp toward R · 2008: -4.4pp · 2024: -11.5pp
- All cycles
- 2024: R+11.5 2020: R+2.9 2016: R+1.5 2012: R+3.2 2008: R+4.4
Not yet ingested
- Civics
- —
Market trends
- HPI YoY
- ▼ -265.71%
- Current HPI
- 191.7201
- Rent YoY
- ▲ 7.91%
- Metro
- Corpus Christi, TX
- State GDP YoY
- ▲ 3.95%
- F500 in state
- 110
Industry mix (Fortune 500 HQ in TX)
| Industry | F500 HQs | Revenue |
|---|---|---|
| Energy | 16 | $1,198B |
|
||
| Technology | 5 | $198B |
|
||
| Engineering / Construction | 4 | $72B |
|
||
| Energy Services | 3 | $60B |
|
||
| Utilities | 3 | $41B |
|
||
| Healthcare | 2 | $330B |
|
||
Price history
+102.7% since first listed19 events — show timeline
- 2026-05-01 Pending — CBMLS
- 2026-04-23 Delisted — CBMLS
- 2026-04-13 Listed $113,500 CBMLS
- 2025-09-19 Price Changed $149,000 CBMLS
- 2025-08-24 Price Changed $155,000 CBMLS
- 2025-06-02 Price Changed $165,000 CBMLS
- 2025-04-22 Listed $170,000 CBMLS
- 2020-09-02 Delisted — CBMLS
- 2020-08-14 Sold (MLS) — CBMLS
- 2020-06-28 Pending — CBMLS
- 2020-06-20 Contingent — CBMLS
- 2020-03-18 Listed $140,000 CBMLS
- 2013-03-01 Listed $109,500 CBMLS
- 2011-06-18 Listed $97,600 CBMLS
- 2007-05-11 Sold (Public Records) — Public Records
- 2007-05-08 Sold (MLS) — CBMLS
- 2007-02-27 Listed $99,900 CBMLS
- 1997-06-18 Sold (Public Records) $49,000 Public Records
- 1997-04-08 Listed $56,000 CBMLS
Property tax history
+7.6%/yrLatest (2025): $4,110 · +10.0% YoY. Source: county tax records.
Cash-flow waterfall
monthlySold comps — $/sqft
last 12 mo · ≤1 miLoading sold comps…