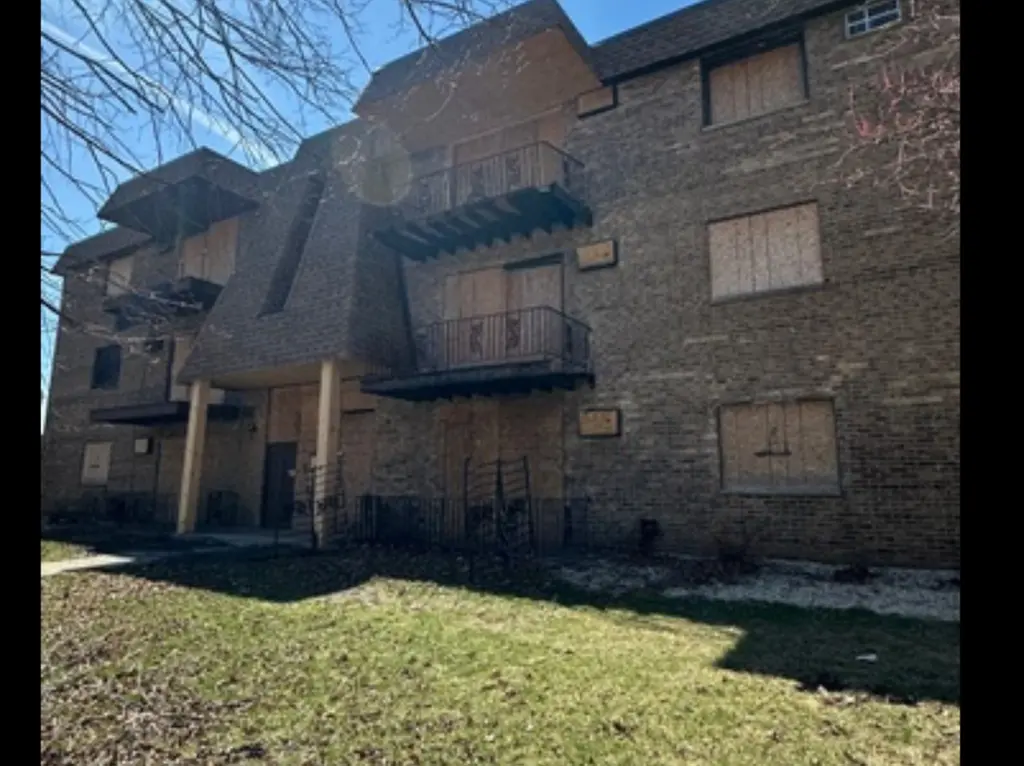
5700 128th St #9 · Crestwood, IL
Flood risk 1/10 · Minimal
- FEMA flood zone
- X (shaded)
- Chance of flooding over 30 yrs
- 0.0%
- Est. flood insurance / yr
- $507 – $1,088
Fire risk 1/10 · Minimal
- Est. fire insurance / yr
- $804 – $1,492
Heat risk 3/10 · Minor
- Hot days now (above 101°F)
- 7 days/yr
- Hot days in 30 yrs
- 15 days/yr
Wind risk 2/10 · Minimal
- Chance of severe wind over 30 yrs
- —
Air-quality risk 3/10 · Minor
- Unhealthy air days now
- 4 days/yr
- Unhealthy air days in 30 yrs
- 4 days/yr
Risk factors via First Street. Map © Google.
Why this score? — see what drove the B+ grade
The composite is a weighted blend of 9 inputs, each scored 0–100. Each bar is that input's sub-score; the figure is the points it added to the 100-point composite (weight × sub-score).
- Cash flow +30.0/30.0
- ARV discount +15.0/15.0
- 1% rule +10.0/10.0
- DSCR +10.0/10.0
- Livability +4.1/5.0
- Rent growth +2.5/5.0
- Condition / age +2.5/5.0
- Schools +1.6/10.0
- Appreciation +0.0/10.0
$90,000
🖨 Deal sheet 📄 Offer letter ✓ Due diligence
Listing remarks MLS
Short sale opportunity! 3rd floor condo rooms. This building was damaged in a fire. There are only drive by showings. There was laundry and storage are available in the building. Noi garage.
Key facts
- $181 HOA
- Parking
- Built 1971
Neighborhood map
What this means for you Summary
Snapshot
- This is a 2-bed/1.0-bath condo listed at $90k.
Deal economics
- At list price, monthly cash flow is $425 ($5k/yr) — positive.
- The deal already cash-flows at list — no discount required.
- Meets the 1% rule at list price ($2k rent vs $90k).
- Recommended offer: $85k (6.0% below list) — sets the bar for market timing.
- Cap rate 12.0% vs local median 4.9% in Crestwood — top-decile yield for the area; either an underpriced asset or a hidden risk that comps aren't pricing in. Stress-test before assuming the spread holds.
Location & tenants
- Location reads 82/100 on livability (#75 in IL, #1,220 nationally) — a professional / high-income tenant draw. Strengths: commute A+, cost of living A+, housing A+; Watch: schools D-.
- Chsd 218 (suburban): math 14% / reading 20% proficiency, ranked #454 of 620 in IL (top 73%) — low school quality limits family demand, transient renter base, plan for 1-2y turnover.
- Market conditions: 30 active listings in the ZIP; 3 comparable units currently listed for rent nearby; rentals leasing fast (median 4d on market — plan ~1-2 weeks tenant-placement turnaround); 6,272 units permitted in Cook County in 2024 (4,658 in 5+ unit buildings).
Forward outlook
- Local home prices are declining (-3.0%/yr); year-one equity from $622 of loan paydown is wiped out by about $3k of value loss. Plan a longer hold.
- At projected returns (-3.0% appreciation + 3.0% rent growth), your $25k cash investment doubles in ~6 years — after that, you're playing with house money.
Negotiation context
- It's been on market 70 days — a 6% lower offer ($85k) is reasonable based on typical stale-listing flexibility.
- 5 sale attempts since 14y ago with the ask held roughly flat each time — persistent listings suggest the price (not the market) is what's stuck; bring a comps-based counter.
Questions for the listing agent
- It's been on market 70 days. Have you received any prior offers? Is the seller open to a 6% concession, seller financing, or rate buy-down credit?
- Built in 1971 — when were the roof, HVAC, electrical panel, plumbing, and water heater last replaced?
- What does the HOA fee cover, when was the last increase, and are there any pending special assessments or reserve-fund shortfalls?
- Any open or pending special assessments — roof, HVAC, plumbing, elevator, façade? What's the per-unit balance and payoff schedule, and is the seller paying it off at close or rolling it to the buyer?
- Why hasn't it sold? Are there any deal-killer items the seller is aware of (foundation, flood, title, zoning, code violations)?
- Is there a deadline driving the sale (1031 exchange, divorce, estate, relocation)? That informs how much negotiation room exists.
- Schools are D-rated, which usually means shorter tenancies and higher turnover. Who's the typical renter profile here, and what's been the actual vacancy rate?
- What's the average days-on-market for RENTAL listings here right now (not sales)? A rising rental-DOM trend means longer vacancies and softer asking-rent achievability than the comps imply.
- What's the recent tenant-quality profile in this submarket — average credit score on applications, eviction rate, late-payment / NSF rate, and stable-employment percentage? A property-management company in the area should have these aggregated.
- How much new apartment / multifamily construction is in the pipeline within 1–3 miles? Heavy new supply (>2% of stock underway) typically softens rents 12–24 months out; light construction supports rent growth.
Investment metrics
- 1% rule
- 1.80% ✓
- Cap rate
- 11.96%
- Cash-on-cash
- 20.24%
- DSCR
- 1.90
- GRM
- 4.6
CMA / ARV
- ARV (median comp)
- $151,227
- List price
- $90,000
- Delta
- -40.49%
- Verdict
- UNDERPRICED
- Comps
- 20 within 1.0 mi
Projected returns pro-forma
-3.0% appreciation · 3.0% rent growth · sell at horizon
- IRR
- 12.6%
- Equity multiple
- 1.50×
- Total profit
- $12,658
- Equity at exit
- $13,419
- IRR
- 21.6%
- Equity multiple
- 2.85×
- Total profit
- $46,567
- Equity at exit
- $7,782
Cash invested: $25,200 (down + closing). Projections, not guarantees.
Landlord ↔ Tenant lean methodology
- Overall (STATE)
- 43 Moderately Tenant-Leaning
- State Illinois
- 43 Moderately Tenant-Leaning · D+7
- County
- — inherits STATE
- City
- — inherits STATE
ZIP-level market 60418
- Active inventory
- 30
- Price-to-rent
- 4.6×
Monthly cashflow live
- Estimated rent
- $1,621 medium interval (Pro) →
- Mortgage (P&I)
- −$472
- Tax from tax record
- −$165 /mo · $1,983/yr
- Insurance
- −$38
- HOA
- −$181
- Vacancy / Maint / Mgmt
- −$340
- Net cashflow
- $425
Break-even live
UW: 25.0% down · 7.5% · 30yr · 1.5% tax · 5.0% vac · 8.0% maint · 8.0% mgmt
Financing live
Cash to close
- Down payment
- $22,500
- Closing costs
- $2,700
- Reserves months
- —
- Total cash needed
- —
Loan-product check · same deal, 3 products live
Conventional
25% down · 7.5% · 30yr
- Down + closing
- —
- Monthly P&I
- —
- Monthly cashflow
- —
- DSCR
- —
- Eligible?
- —
Personal DTI + credit; lowest rate.
DSCR
20% down · 8.5% · 30yr
- Down + closing
- —
- Monthly P&I
- —
- Monthly cashflow
- —
- DSCR
- —
- Eligible?
- —
No personal income docs; deal must DSCR.
Hard money
10% down · 12.0% · 12mo
- Down + closing
- —
- Monthly P&I
- —
- Monthly cashflow
- —
- DSCR
- —
- Eligible?
- —
Short-term bridge; refi at stabilization.
Rent comps 3 comps
| Address | Beds | Baths | Sqft | Rent | $/sqft | DOM | Units | Dist |
|---|---|---|---|---|---|---|---|---|
| 5723 129th St Crestwood, IL | 2.0 | 1.0 | 950 | $1,600 | $1.68 | 1d | 1 | 0.16mi |
| 10410 S Moody Ave Palos Heights, IL | 2.0 | 1.0 | 1000 | $1,600 | $1.60 | 3d | 1 | 0.89mi |
| 13615 Royal Ct #309 Crestwood, IL | 2.0 | 2.0 | 1000 | $1,850 | $1.85 | 3d | 1 | 1.39mi |
HOA detail condo
- Monthly dues
- $181 · $2,172/yr
- Assessments
- None detected in remarks — confirm with the listing agent.
Listing history 33 events
-
2026-06-18days on market $90,000 Active 70 DOM
-
2026-06-17days on market $90,000 Active 69 DOM
-
2026-06-16days on market $90,000 Active 68 DOM
-
2026-06-15days on market $90,000 Active 67 DOM
-
2026-06-13days on market $90,000 Active 65 DOM
-
2026-06-09days on market $90,000 Active 61 DOM
-
2026-06-08days on market $90,000 Active 60 DOM
-
2026-06-07days on market $90,000 Active 59 DOM
-
2026-06-04days on market $90,000 Active 56 DOM
-
2026-06-03days on market $90,000 Active 55 DOM
-
2026-06-02days on market $90,000 Active 54 DOM
-
2026-06-01days on market $90,000 Active 53 DOM
-
2026-05-31days on market $90,000 Active 52 DOM
-
2026-04-15status Active 194-char remark
Show marketing remark (194 chars)
Short sale opportunity! 3rd floor condo rooms. This building was damaged in a fire. There are only drive by showings. There was laundry and storage are available in the building. Noi garage.
-
2026-04-05status Pending 194-char remark
Show marketing remark (194 chars)
Short sale opportunity! 3rd floor condo rooms. This building was damaged in a fire. There are only drive by showings. There was laundry and storage are available in the building. Noi garage.
-
2026-03-31status Pending 194-char remark
Show marketing remark (194 chars)
Short sale opportunity! 3rd floor condo rooms. This building was damaged in a fire. There are only drive by showings. There was laundry and storage are available in the building. Noi garage.
-
2026-03-25$90,000 Active 194-char remark
Show marketing remark (194 chars)
Short sale opportunity! 3rd floor condo rooms. This building was damaged in a fire. There are only drive by showings. There was laundry and storage are available in the building. Noi garage.
-
2026-03-25historical
Show marketing remark (194 chars)
Short sale opportunity! 3rd floor condo rooms. This building was damaged in a fire. There are only drive by showings. There was laundry and storage are available in the building. Noi garage.
-
2026-03-23Active
-
2021-08-11soldstatus $105,000
-
2021-07-01soldstatus $105,000 Closed Sale
-
2021-04-23status Pending
-
2021-04-17$90,000 New
-
2012-08-31soldstatus $57,000
-
2012-08-07soldstatus $57,000 Closed Sale
-
2012-07-29status Pending
-
2012-06-27historical Contingent
-
2012-06-13price $64,800 Price Change
-
2012-05-24price $66,800 Price Change
-
2012-05-05price $67,800 Price Change
-
2012-04-01price $68,800 Price Change
-
2012-02-05$69,800 New
-
1995-05-03soldstatus $60,000
ⓘ Source: listings_history table (triggers on properties + properties_extension) + one-shot
backfill from property_details.listing_events for pre-trigger history.
Tax reassessment forecast IL · Partial reset (capped growth)
- Current annual tax
- $1,983 · $165/mo
- Projected year-2 tax
- $2,013 · $168/mo
- Expected delta
- +$30/yr (+$3/mo · 1.5%)
ⓘ Screening estimate from a state-policy table — verify with the county assessor before closing.
Climate risk First Street
- Flood 1/10 Low FEMA zone X (shaded) · 0% chance over 30 yrs
- Wildfire 1/10 Low
- Heat 3/10 Moderate 7 d/yr ≥101°F today · 15 d/yr by 30 yrs out
- Wind 2/10 Low
- Air quality 3/10 Moderate 4 unhealthy d/yr today · 4 by 30 yrs out
Nearby sold comps map
Loading sold comps map…
Walkable amenities ~0.75 mi
Loading nearby amenities…
Taxation est. · year 1
- Rental income
- $19,455
- − Mortgage interest
- −$5,041
- − Property taxes
- −$1,983
- − Insurance
- −$450
- − Repairs & maintenance
- −$1,556
- − Management
- −$1,556
- − HOA
- −$2,172
- − Depreciation
- −$2,618
- Taxable income
- $4,078
- Est. tax owed @ 24.0%
- −$979
- After-tax cash flow
- $4,122/yr
For passive investors: Depreciation is non-cash, so a rental often shows a tax loss while cash-flowing — sheltering income. Rental losses are passive: they offset passive income freely, and up to $25,000/yr can offset ordinary (W-2) income if you actively participate and your MAGI is under $100k (phasing out to $0 by $150k); unused losses carry forward. On sale, claimed depreciation is recaptured at up to 25%, and gains may owe capital-gains tax (a 1031 exchange can defer both). Figures are a year-1 estimate at your 24.0% rate — not tax advice; consult a CPA.
Schools (NCES district)
- District
- Chsd 218
- NCES district ID
- 1706540
- Math proficiency
- 14% ▼ -4.00%
- Reading proficiency
- 20% ▼ -1.00%
- Median HH income
- $57,166
- Composite
- 16.09/100
- National rank
- #9235
- State rank
- #454 of 620 in IL
Livability — Crestwood
- Score
- 82/100
- State rank
- #75
- US rank
- #1220
Category grades
Schools grade is shown separately in the Schools card above.
Census & demographics
- Census place
- Crestwood, IL
- City population
- 10,631
- Population (ZIP)
- 10,631
Population outlook (Cook County) Hauer SSP2
- Today (2025)
- 5,347,519 people
- By 2030
- 5,357,703 · +0.2%
- By 2040
- 5,324,924 · -0.4%
- By 2050
- 5,230,762 · -2.2%
- By 2075
- 4,785,735 · -10.5%
- By 2100
- 4,188,836 · -21.7%
Race, ethnicity, and origin ACS 2023
- Neighborhood character
- Predominantly White (69%)
- Race & ethnicity
- White 69% Hispanic / Latino 15% Black 12% Two or more races 7% Asian 2%
- Hispanic origin (detail)
- Mexican 13% Puerto Rican 1%
- Common ancestry
- Romanian 13% Iranian 1% Armenian 1%
- Foreign-born
- 12% · Canada
- Languages at home
- 82% English-only · Spanish 11% Arabic 2% Russian/Polish/Slavic 2%
Political lean MEDSL · Cook
- 2024 margin
- Solid D (+42.0) · D 70.4% · R 28.4% · Other 1.2%
- 2008→2024 swing
- -11.4pp toward R · 2008: 53.4pp · 2024: 42.0pp
- All cycles
- 2024: D+42.0 2020: D+50.3 2016: D+53.0 2012: D+49.4 2008: D+53.4
Not yet ingested
- Civics
- —
Market trends
- HPI YoY
- ▼ -205.44%
- Current HPI
- 105.796
- Rent YoY
- —
- Metro
- —
- State GDP YoY
- ▲ 1.59%
- F500 in state
- 60
Industry mix (Fortune 500 HQ in IL)
| Industry | F500 HQs | Revenue |
|---|---|---|
| Insurance | 4 | $201B |
|
||
| Consumer Goods | 4 | $87B |
|
||
| Industrial Machinery | 3 | $64B |
|
||
| Healthcare | 2 | $55B |
|
||
| Retail / Pharmacy | 1 | $148B |
|
||
| Agriculture / Food | 1 | $86B |
|
||
Price history
+50.0% since first listed20 events — show timeline
- 2026-04-15 Relisted — MRED as Distributed by MLS Grid
- 2026-04-05 Pending — MRED as Distributed by MLS Grid
- 2026-03-31 Pending — MRED as Distributed by MLS Grid
- 2026-03-25 Listing Removed — MRED as Distributed by MLS Grid
- 2026-03-25 Listed $90,000 MRED as Distributed by MLS Grid
- 2026-03-23 Listed — MRED as Distributed by MLS Grid
- 2021-08-11 Sold (Public Records) $105,000 Public Records
- 2021-07-01 Sold (MLS) $105,000 MRED as Distributed by MLS Grid
- 2021-04-23 Pending — MRED as Distributed by MLS Grid
- 2021-04-17 Listed $90,000 MRED as Distributed by MLS Grid
- 2012-08-31 Sold (Public Records) $57,000 Public Records
- 2012-08-07 Sold (MLS) $57,000 MRED as Distributed by MLS Grid
- 2012-07-29 Pending — MRED as Distributed by MLS Grid
- 2012-06-27 Contingent — MRED as Distributed by MLS Grid
- 2012-06-13 Price Changed $64,800 MRED as Distributed by MLS Grid
- 2012-05-24 Price Changed $66,800 MRED as Distributed by MLS Grid
- 2012-05-05 Price Changed $67,800 MRED as Distributed by MLS Grid
- 2012-04-01 Price Changed $68,800 MRED as Distributed by MLS Grid
- 2012-02-05 Listed $69,800 MRED as Distributed by MLS Grid
- 1995-05-03 Sold (Public Records) $60,000 Public Records
Property tax history
+1.4%/yrLatest (2023): $1,983 · +7.0% YoY. Source: county tax records.
Cash-flow waterfall
monthlySold comps — $/sqft
last 12 mo · ≤1 miLoading sold comps…