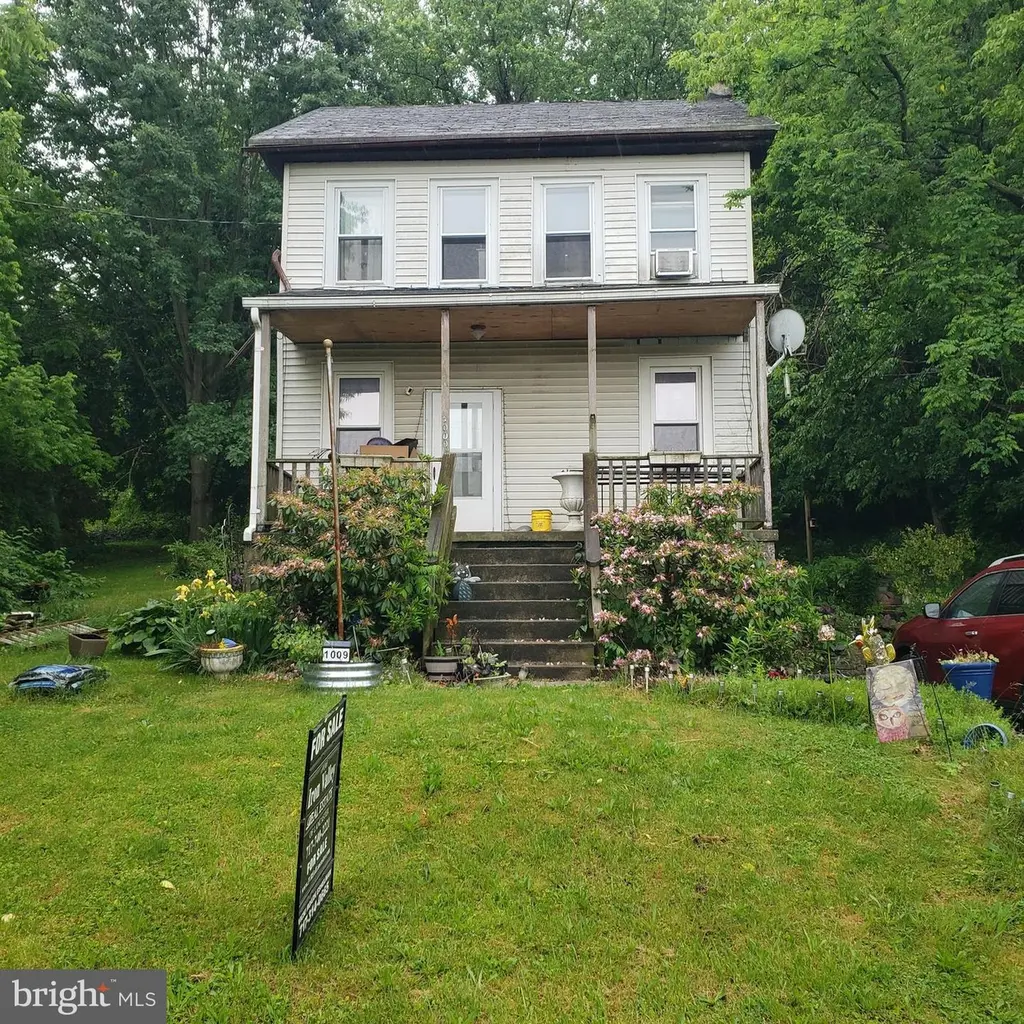
1009 Stone Hill Rd · Conestoga, PA
Flood risk 1/10 · Minimal
- FEMA flood zone
- X (unshaded)
- Chance of flooding over 30 yrs
- 0.0%
- Est. flood insurance / yr
- $473 – $860
Fire risk 4/10 · Minor
- Est. fire insurance / yr
- $511 – $949
Heat risk 5/10 · Moderate
- Hot days now (above 101°F)
- 7 days/yr
- Hot days in 30 yrs
- 15 days/yr
Wind risk 4/10 · Minor
- Chance of severe wind over 30 yrs
- 18.0%
Air-quality risk 3/10 · Minor
- Unhealthy air days now
- 2 days/yr
- Unhealthy air days in 30 yrs
- 6 days/yr
Risk factors via First Street. Map © Google.
Why this score? — see what drove the C+ grade
The composite is a weighted blend of 9 inputs, each scored 0–100. Each bar is that input's sub-score; the figure is the points it added to the 100-point composite (weight × sub-score).
- Cash flow +30.0/30.0
- 1% rule +10.0/10.0
- DSCR +10.0/10.0
- Schools +5.1/10.0
- Livability +3.6/5.0
- Rent growth +2.5/5.0
- Condition / age +2.5/5.0
- ARV discount +0.0/15.0
- Appreciation +0.0/10.0
$82,000
🖨 Deal sheet 📄 Offer letter ✓ Due diligence
Listing remarks
Investor special. Home is being sold "as is" major rehab but is livable. Build some Sweat Equity!
Key facts
- 0.32 acre lot
- Built 1920
Property features AI
Exterior
- Parking: Off-street parking
- Utilities: Well water; On-site septic
- Home design: Detached structure; Frame construction with vinyl siding; Stone foundation
- Construction: Built year reported by assessor; Frame and vinyl siding construction; Stone foundation
- Exterior features: Not in a federal flood zone; No tidal water on the property
Interior
- Bedrooms: Three bedrooms on the upper level
- Bathrooms: One full bathroom
- Heating & cooling: Forced air heating (oil); Window air conditioning units (electric); Electric hot water
- Interior features: Full basement; Finished above-grade living area reported by assessor
- Laundry & utility: Laundry located on the main floor
Neighborhood map
What this means for you Summary
Snapshot
- This is a 3-bed/1.0-bath single-family listed at $82k.
Deal economics
- At list price, monthly cash flow is $479 ($6k/yr) — positive.
- The deal already cash-flows at list — no discount required.
- Meets the 1% rule at list price ($1k rent vs $82k).
Location & tenants
- Location reads 71/100 on livability (#721 in PA) — a middle-class / working-renter tenant base. Strengths: crime A+, cost of living A+, housing A+; Watch: amenities F, commute F.
- Penn Manor SD (suburban): math 52% / reading 65% proficiency, ranked #80 of 539 in PA (top 15%) — acceptable for families but not a draw, mixed tenant base, ~2y average lease.
- Market conditions: 12 active listings in the ZIP; 1,093 units permitted in Lancaster County in 2024 (201 in 5+ unit buildings).
Forward outlook
- Local home prices are declining (-3.0%/yr); year-one equity from $567 of loan paydown is wiped out by about $2k of value loss. Plan a longer hold.
- Lancaster County population projected at +5% by 2050 — modest demand growth; plan on rents tracking national, not racing it.
- At projected returns (-3.0% appreciation + 3.0% rent growth), your $23k cash investment doubles in ~5 years — after that, you're playing with house money.
Negotiation context
- Only 1 days on market — expect competitive offers; lowballing is unlikely to land.
Risks & watch-outs
- Watch-outs: property tax is 3.1% of price; built in 1920 — expect roof / HVAC / electrical / plumbing capex.
- Climate carrying-cost: extreme-heat days projected 7→15/yr by 2055 (HVAC capex compounding) — expect insurance premiums to compound above CPI over the hold.
Questions for the listing agent
- Built in 1920 — when were the roof, HVAC, electrical panel, plumbing, and water heater last replaced?
- Property tax is high relative to price — has the assessment been appealed recently, and will the sale trigger a re-assessment?
- Is there a deadline driving the sale (1031 exchange, divorce, estate, relocation)? That informs how much negotiation room exists.
- Schools are B-rated — typically a magnet for longer-tenancy family renters. What's the average tenant stay here, and is there a school-zone premium baked into asking?
- What's the average days-on-market for RENTAL listings here right now (not sales)? A rising rental-DOM trend means longer vacancies and softer asking-rent achievability than the comps imply.
- What's the recent tenant-quality profile in this submarket — average credit score on applications, eviction rate, late-payment / NSF rate, and stable-employment percentage? A property-management company in the area should have these aggregated.
- How much new for-sale + rental construction is in the pipeline within 1–3 miles? Heavy new supply typically softens prices + rents 12–24 months out; constrained supply supports both.
Investment metrics
- 1% rule
- 1.79% ✓
- Cap rate
- 13.30%
- Cash-on-cash
- 25.04%
- DSCR
- 2.11
- GRM
- 4.7
CMA / ARV
- ARV (on-the-fly)
- $66,528
- Comps found
- 4
Show comp detail 4 sales within ~0.75 mi
| Address | Dist | Beds/Ba | Sqft | Sold | Price | $/sf | Match |
|---|---|---|---|---|---|---|---|
| 54 Penn Dr | 0.41mi | 3/2.0 | 980 (-7%) | 0mo | $55,000 | $56 | 64 |
| 7 Dogwood Dr | 0.49mi | 3/1.0 | 980 (-7%) | 9mo | $60,000 | $61 | 57 |
| 1142 Stone Hill Rd | 0.21mi | 2/1.0 (-1) | 960 (-9%) | 22mo | $205,000 | $214 | 52 |
| 9 Dogwood Dr | 0.48mi | 3/2.0 | 960 (-9%) | 24mo | $60,000 | $63 | 39 |
Match score weights: distance 35% · size 25% · config 20% · recency 20%. Top-matched comps best support the ARV.
Projected returns pro-forma
-3.0% appreciation · 3.0% rent growth · sell at horizon
- IRR
- 18.6%
- Equity multiple
- 1.75×
- Total profit
- $17,313
- Equity at exit
- $12,226
- IRR
- 27.0%
- Equity multiple
- 3.38×
- Total profit
- $54,732
- Equity at exit
- $7,090
Cash invested: $22,960 (down + closing). Projections, not guarantees.
Landlord ↔ Tenant lean methodology
- Overall (STATE)
- 62 Landlord-Friendly
- State Pennsylvania
- 62 Landlord-Friendly · EVEN
- County
- — inherits STATE
- City
- — inherits STATE
ZIP-level market 17516
- Home prices YoY
- -21.0%
- Active inventory
- 12
- Price-to-rent
- 4.7×
Monthly cashflow live
- Estimated rent
- $1,466 medium interval (Pro) →
- Mortgage (P&I)
- −$430
- Tax from tax record
- −$215 /mo · $2,580/yr
- Insurance
- −$34
- HOA
- −$0
- Vacancy / Maint / Mgmt
- −$308
- Net cashflow
- $479
Break-even live
UW: 25.0% down · 7.5% · 30yr · 1.5% tax · 5.0% vac · 8.0% maint · 8.0% mgmt
Financing live
Cash to close
- Down payment
- $20,500
- Closing costs
- $2,460
- Reserves months
- —
- Total cash needed
- —
Loan-product check · same deal, 3 products live
Conventional
25% down · 7.5% · 30yr
- Down + closing
- —
- Monthly P&I
- —
- Monthly cashflow
- —
- DSCR
- —
- Eligible?
- —
Personal DTI + credit; lowest rate.
DSCR
20% down · 8.5% · 30yr
- Down + closing
- —
- Monthly P&I
- —
- Monthly cashflow
- —
- DSCR
- —
- Eligible?
- —
No personal income docs; deal must DSCR.
Hard money
10% down · 12.0% · 12mo
- Down + closing
- —
- Monthly P&I
- —
- Monthly cashflow
- —
- DSCR
- —
- Eligible?
- —
Short-term bridge; refi at stabilization.
Listing history 3 events
-
2026-05-22historical Active Under Contract
-
2026-05-21$82,000 Active
-
2001-09-06soldstatus $79,500
ⓘ Source: listings_history table (triggers on properties + properties_extension) + one-shot
backfill from property_details.listing_events for pre-trigger history.
Tax reassessment forecast PA · Partial reset (capped growth)
- Current annual tax
- $2,580 · $215/mo
- Projected year-2 tax
- $2,580 · $215/mo
- Expected delta
- $0/yr ($0/mo · 0.0%)
ⓘ Screening estimate from a state-policy table — verify with the county assessor before closing.
Climate risk First Street
- Flood 1/10 Low FEMA zone X (unshaded) · 0% chance over 30 yrs
- Wildfire 4/10 Moderate
- Heat 5/10 Major 7 d/yr ≥101°F today · 15 d/yr by 30 yrs out
- Wind 4/10 Moderate 18% chance of damaging wind over 30 yrs
- Air quality 3/10 Moderate 2 unhealthy d/yr today · 6 by 30 yrs out
Nearby sold comps map
Loading sold comps map…
Walkable amenities ~0.75 mi
Loading nearby amenities…
Taxation est. · year 1
- Rental income
- $17,593
- − Mortgage interest
- −$4,593
- − Property taxes
- −$2,580
- − Insurance
- −$410
- − Repairs & maintenance
- −$1,407
- − Management
- −$1,407
- − Depreciation
- −$2,385
- Taxable income
- $4,809
- Est. tax owed @ 24.0%
- −$1,154
- After-tax cash flow
- $4,594/yr
For passive investors: Depreciation is non-cash, so a rental often shows a tax loss while cash-flowing — sheltering income. Rental losses are passive: they offset passive income freely, and up to $25,000/yr can offset ordinary (W-2) income if you actively participate and your MAGI is under $100k (phasing out to $0 by $150k); unused losses carry forward. On sale, claimed depreciation is recaptured at up to 25%, and gains may owe capital-gains tax (a 1031 exchange can defer both). Figures are a year-1 estimate at your 24.0% rate — not tax advice; consult a CPA.
Schools (NCES district)
- District
- Penn Manor SD
- NCES district ID
- 4218630
- Math proficiency
- 52% ▼ -7.00%
- Reading proficiency
- 65% ▼ -7.00%
- Median HH income
- $59,275
- Composite
- 50.67/100
- National rank
- #1826
- State rank
- #80 of 539 in PA
Livability — Conestoga
- Score
- 71/100
- State rank
- #721
- US rank
- #7139
Category grades
Schools grade is shown separately in the Schools card above.
Census & demographics
- Census place
- Conestoga, PA
- Population (ZIP)
- 5,241
Population outlook (Lancaster County) Hauer SSP2
- Today (2025)
- 561,011 people
- By 2030
- 570,969 · +1.8%
- By 2040
- 585,929 · +4.4%
- By 2050
- 591,056 · +5.4%
- By 2075
- 594,747 · +6.0%
- By 2100
- 558,850 · -0.4%
Race, ethnicity, and origin ACS 2023
- Neighborhood character
- Predominantly White (90%)
- Race & ethnicity
- White 90% Two or more races 4% Hispanic / Latino 2% Asian 2% Black 2%
- Common ancestry
- Polish 4% Romanian 3% Lithuanian 3%
- Foreign-born
- 2% · Canada, South Korea
- Languages at home
- 92% English-only · German/W. Germanic 6% Other Indo-European 1%
Political lean MEDSL · Lancaster
- 2024 margin
- R (+15.9) · D 41.5% · R 57.5%
- 2008→2024 swing
- -4.1pp toward R · 2008: -11.8pp · 2024: -15.9pp
- All cycles
- 2024: R+15.9 2020: R+15.8 2016: R+19.7 2012: R+19.2 2008: R+11.8
Not yet ingested
- Civics
- —
Market trends
- HPI YoY
- ▼ -68.83%
- Current HPI
- 259.1852
- Rent YoY
- —
- Metro
- —
- State GDP YoY
- ▲ 1.68%
- F500 in state
- 34
Industry mix (Fortune 500 HQ in PA)
| Industry | F500 HQs | Revenue |
|---|---|---|
| Healthcare | 2 | $309B |
|
||
| Insurance | 2 | $27B |
|
||
| Telecommunications / Media | 1 | $124B |
|
||
| Industrial Distribution | 1 | $22B |
|
||
| Financial Services | 1 | $20B |
|
||
| Chemicals / Materials | 1 | $18B |
|
||
Price history
+3.1% since first listed3 events — show timeline
- 2026-05-22 Contingent — BRIGHT MLS
- 2026-05-21 Listed $82,000 BRIGHT MLS
- 2001-09-06 Sold (Public Records) $79,500 Public Records
Property tax history
+1.4%/yrLatest (2026): $2,580 · +4.5% YoY. Source: county tax records.
Cash-flow waterfall
monthlySold comps — $/sqft
last 12 mo · ≤1 miLoading sold comps…