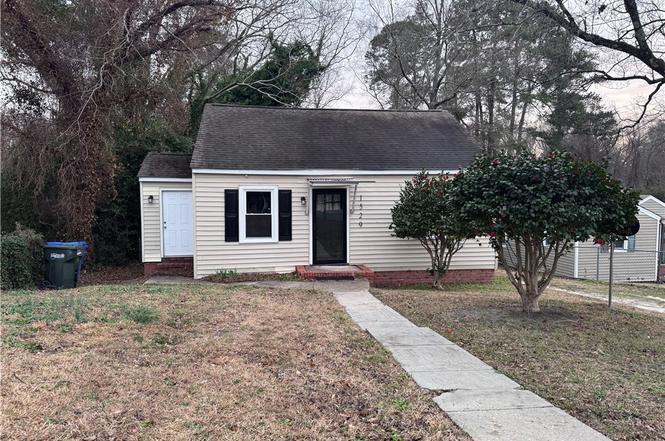
1529 Lacy St · Fayetteville, NC
Flood risk 1/10 · Minimal
- FEMA flood zone
- X (unshaded)
- Chance of flooding over 30 yrs
- 0.0%
- Est. flood insurance / yr
- $507 – $1,088
Fire risk 4/10 · Minor
- Est. fire insurance / yr
- $906 – $1,684
Heat risk 7/10 · Major
- Hot days now (above 106°F)
- 7 days/yr
- Hot days in 30 yrs
- 15 days/yr
Wind risk 7/10 · Major
- Chance of severe wind over 30 yrs
- 78.0%
Air-quality risk 1/10 · Minimal
- Unhealthy air days now
- 0 days/yr
- Unhealthy air days in 30 yrs
- 0 days/yr
Risk factors via First Street. Map © Google.
Why this score? — see what drove the C grade
The composite is a weighted blend of 9 inputs, each scored 0–100. Each bar is that input's sub-score; the figure is the points it added to the 100-point composite (weight × sub-score).
- Cash flow +24.5/30.0
- DSCR +7.9/10.0
- 1% rule +6.4/10.0
- ARV discount +6.4/15.0
- Livability +3.8/5.0
- Rent growth +3.5/5.0
- Schools +3.1/10.0
- Condition / age +2.5/5.0
- Appreciation +0.0/10.0
$99,900
🖨 Deal sheet 📄 Offer letter ✓ Due diligence
Listing remarks MLS
Terry Sanford school district, 2 bedroom 1 bath home. Neighborhood playground in walking distance of home. Nice size living area with hardwood flooring. Kitchen with new flooring and exit to backyard. 2 bedrooms with hardwood flooring. Hall full guest bath with tub/shower combo. Fresh paint interior. Mudroom off of living space with washer and dryer connection. Vinyl exterior home.
Key facts
- Hardwood flooring
- Vinyl flooring
- Fenced in yard
Tags
Neighborhood map
What this means for you Summary
Snapshot
- This is a 2-bed/1.0-bath single-family listed at $100k.
Deal economics
- At list price, monthly cash flow is $204 ($2k/yr) — positive.
- The deal already cash-flows at list — no discount required.
- Meets the 1% rule at list price ($1k rent vs $100k).
- Recommended offer: $98k (1.5% below list) — sets the bar for market timing.
- Cap rate 8.7% vs local median 4.9% in Fayetteville — top-decile yield for the area; either an underpriced asset or a hidden risk that comps aren't pricing in. Stress-test before assuming the spread holds.
Location & tenants
- Location reads 75/100 on livability (#45 in NC, #4,031 nationally) — a middle-class / working-renter tenant base. Strengths: commute A+, cost of living A+, housing A+; Watch: crime F, employment D-.
- Cumberland County Schools (urban): math 32% / reading 41% proficiency, ranked #126 of 178 in NC (top 71%) — families likely to look elsewhere, expect single-tenant / working-renter base with shorter leases.
- Zoned schools: Vanstory Hills Elementary (math 46% / reading 50%, grade D, #477 of 1,410 statewide, top 35%, 469 students, 99% FRL); R Max Abbott Middle (math 31% / reading 45%, grade F, #251 of 475 statewide, top 54%, 759 students, 99% FRL); Terry Sanford High (math 49% / reading 52%, grade D+, #306 of 535 statewide, top 57%, 1,224 students, 59% FRL) — zoned schools average 86% FRL vs 55% district-wide (31 pts higher); higher-poverty schools than district average — tighter screening recommended.
- Market conditions: Rents rising (+4.0%/yr); 102 active listings in the ZIP; 6 comparable units currently listed for rent nearby; rentals at typical pace (median 23d on market — plan ~3-4 weeks tenant-placement turnaround); solid renter incomes; 1,125 units permitted in Cumberland County in 2024 (104 in 5+ unit buildings).
- This rent is only 18% of the median local income ($78k/yr) — well below the 30% rent-burden line; pricing power to push rent on renewal without tenant pushback.
Forward outlook
- Local home prices are declining (-3.0%/yr); year-one equity from $691 of loan paydown is wiped out by about $3k of value loss. Plan a longer hold.
Negotiation context
- It's been on market 25 days — a 2% lower offer ($98k) is reasonable based on typical stale-listing flexibility.
- 3 sale attempts since 3y ago with the ask held roughly flat each time — persistent listings suggest the price (not the market) is what's stuck; bring a comps-based counter.
Risks & watch-outs
- Watch-outs: built in 1949 — expect roof / HVAC / electrical / plumbing capex.
- Climate carrying-cost: major wind risk, 78% chance of damaging wind over 30y; extreme-heat days projected 7→15/yr by 2055 (HVAC capex compounding) — expect insurance premiums to compound above CPI over the hold.
Questions for the listing agent
- Built in 1949 — when were the roof, HVAC, electrical panel, plumbing, and water heater last replaced?
- Is there a deadline driving the sale (1031 exchange, divorce, estate, relocation)? That informs how much negotiation room exists.
- Crime grade is F in this area — have there been break-ins, vandalism, or insurance claims at this property in the last 3 years? What carrier currently insures it and at what premium?
- What's the average days-on-market for RENTAL listings here right now (not sales)? A rising rental-DOM trend means longer vacancies and softer asking-rent achievability than the comps imply.
- What's the recent tenant-quality profile in this submarket — average credit score on applications, eviction rate, late-payment / NSF rate, and stable-employment percentage? A property-management company in the area should have these aggregated.
- How much new for-sale + rental construction is in the pipeline within 1–3 miles? Heavy new supply typically softens prices + rents 12–24 months out; constrained supply supports both.
Investment metrics
- 1% rule
- 1.14% ✓
- Cap rate
- 8.75%
- Cash-on-cash
- 8.77%
- DSCR
- 1.39
- GRM
- 7.3
CMA / ARV
- ARV (on-the-fly)
- $97,552
- Comps found
- 1
Show comp detail 1 sale within ~0.75 mi
| Address | Dist | Beds/Ba | Sqft | Sold | Price | $/sf | Match |
|---|---|---|---|---|---|---|---|
| 1534 Pierce St | 0.04mi | 2/1.0 | 800 (+10%) | 14mo | $107,000 | $134 | 70 |
Match score weights: distance 35% · size 25% · config 20% · recency 20%. Top-matched comps best support the ARV.
Projected returns pro-forma
-3.0% appreciation · 3.95% rent growth · sell at horizon
- IRR
- -1.9%
- Equity multiple
- 0.93×
- Total profit
- $-2,040
- Equity at exit
- $14,895
- IRR
- 8.8%
- Equity multiple
- 1.70×
- Total profit
- $19,698
- Equity at exit
- $8,638
Cash invested: $27,972 (down + closing). Projections, not guarantees.
Landlord ↔ Tenant lean methodology
- Overall (STATE)
- 85 Strongly Landlord-Friendly
- State North Carolina
- 85 Strongly Landlord-Friendly · R+3
- County
- — inherits STATE
- City
- — inherits STATE
ZIP-level market 28305
- Home prices YoY
- -28.4%
- Rents YoY
- 4.0%
- Active inventory
- 102
- Price-to-rent
- 7.3×
Monthly cashflow live
- Estimated rent
- $1,143 high interval (Pro) →
- Mortgage (P&I)
- −$524
- Tax from tax record
- −$133 /mo · $1,595/yr
- Insurance
- −$42
- HOA
- −$0
- Vacancy / Maint / Mgmt
- −$240
- Net cashflow
- $204
Break-even live
UW: 25.0% down · 7.5% · 30yr · 1.5% tax · 5.0% vac · 8.0% maint · 8.0% mgmt
Financing live
Cash to close
- Down payment
- $24,975
- Closing costs
- $2,997
- Reserves months
- —
- Total cash needed
- —
Loan-product check · same deal, 3 products live
Conventional
25% down · 7.5% · 30yr
- Down + closing
- —
- Monthly P&I
- —
- Monthly cashflow
- —
- DSCR
- —
- Eligible?
- —
Personal DTI + credit; lowest rate.
DSCR
20% down · 8.5% · 30yr
- Down + closing
- —
- Monthly P&I
- —
- Monthly cashflow
- —
- DSCR
- —
- Eligible?
- —
No personal income docs; deal must DSCR.
Hard money
10% down · 12.0% · 12mo
- Down + closing
- —
- Monthly P&I
- —
- Monthly cashflow
- —
- DSCR
- —
- Eligible?
- —
Short-term bridge; refi at stabilization.
Rent comps 6 comps
| Address | Beds | Baths | Sqft | Rent | $/sqft | DOM | Units | Dist |
|---|---|---|---|---|---|---|---|---|
| 1122 Morgan St Apt E Fayetteville, NC | 2.0 | 1.0 | 654 | $995 | $1.52 | 23d | 1 | 0.56mi |
| 1107 W Rowan St Unit 1111-3 Fayetteville, NC | 1.0 | 1.0 | 700 | $850 | $1.21 | 23d | 1 | 1.20mi |
| 1918 Millan Dr Unit A Fayetteville, NC | 1.0 | 1.0 | 720 | $1,099 | $1.53 | 23d | 1 | 1.27mi |
| 1918 Millan Dr Fayetteville, NC | 2.0 | 1.0 | 720 | $1,099 | $1.53 | 23d | 1 | 1.27mi |
| 450 Hay St Fayetteville, NC | 1.0–2.0 | 1.0–2.0 | 799 | $1,745 | $2.18 | 13d | 3 | 1.39mi |
| 222 Woodrow St Fayetteville, NC | 1.0 | 1.0 | 625 | $895 | $1.43 | 23d | 1 | 1.39mi |
Listing history 10 events
-
2026-02-13status Pending
-
2026-01-19$99,900 Active
-
2025-08-29price $118,500
-
2025-08-08$119,500 Active
-
2023-06-05soldstatus $115,000
-
2023-06-02soldstatus $114,900 Closed 384-char remark
Show marketing remark (384 chars)
Terry Sanford school district, 2 bedroom 1 bath home. Neighborhood playground in walking distance of home. Nice size living area with hardwood flooring. Kitchen with new flooring and exit to backyard. 2 bedrooms with hardwood flooring. Hall full guest bath with tub/shower combo. Fresh paint interior. Mudroom off of living space with washer and dryer connection. Vinyl exterior home.
-
2023-05-04status Pending 384-char remark
Show marketing remark (384 chars)
Terry Sanford school district, 2 bedroom 1 bath home. Neighborhood playground in walking distance of home. Nice size living area with hardwood flooring. Kitchen with new flooring and exit to backyard. 2 bedrooms with hardwood flooring. Hall full guest bath with tub/shower combo. Fresh paint interior. Mudroom off of living space with washer and dryer connection. Vinyl exterior home.
-
2023-04-27$114,900 Active 384-char remark
Show marketing remark (384 chars)
Terry Sanford school district, 2 bedroom 1 bath home. Neighborhood playground in walking distance of home. Nice size living area with hardwood flooring. Kitchen with new flooring and exit to backyard. 2 bedrooms with hardwood flooring. Hall full guest bath with tub/shower combo. Fresh paint interior. Mudroom off of living space with washer and dryer connection. Vinyl exterior home.
-
2023-01-31soldstatus $150,000
-
1995-01-27soldstatus $8,000
ⓘ Source: listings_history table (triggers on properties + properties_extension) + one-shot
backfill from property_details.listing_events for pre-trigger history.
Tax reassessment forecast NC · Resets to sale price
- Current annual tax
- $1,595 · $133/mo
- Projected year-2 tax
- $1,595 · $133/mo
- Expected delta
- $0/yr ($0/mo · 0.0%)
ⓘ Screening estimate from a state-policy table — verify with the county assessor before closing.
Climate risk First Street
- Flood 1/10 Low FEMA zone X (unshaded) · 0% chance over 30 yrs
- Wildfire 4/10 Moderate
- Heat 7/10 Severe 7 d/yr ≥106°F today · 15 d/yr by 30 yrs out
- Wind 7/10 Severe 78% chance of damaging wind over 30 yrs
- Air quality 1/10 Low 0 unhealthy d/yr today · 0 by 30 yrs out
Nearby sold comps map
Loading sold comps map…
Walkable amenities ~0.75 mi
Loading nearby amenities…
Taxation est. · year 1
- Rental income
- $13,715
- − Mortgage interest
- −$5,596
- − Property taxes
- −$1,595
- − Insurance
- −$500
- − Repairs & maintenance
- −$1,097
- − Management
- −$1,097
- − Depreciation
- −$2,906
- Taxable income
- $924
- Est. tax owed @ 24.0%
- −$222
- After-tax cash flow
- $2,232/yr
For passive investors: Depreciation is non-cash, so a rental often shows a tax loss while cash-flowing — sheltering income. Rental losses are passive: they offset passive income freely, and up to $25,000/yr can offset ordinary (W-2) income if you actively participate and your MAGI is under $100k (phasing out to $0 by $150k); unused losses carry forward. On sale, claimed depreciation is recaptured at up to 25%, and gains may owe capital-gains tax (a 1031 exchange can defer both). Figures are a year-1 estimate at your 24.0% rate — not tax advice; consult a CPA.
Schools (NCES district)
- District
- Cumberland County Schools
- NCES district ID
- 3700011
- Math proficiency
- 32% ▼ -2.00%
- Reading proficiency
- 41% ▼ -1.00%
- Median HH income
- $44,168
- Composite
- 31.0/100
- National rank
- #6096
- State rank
- #126 of 178 in NC
Livability — Fayetteville
- Score
- 75/100
- State rank
- #45
- US rank
- #4031
Category grades
Schools grade is shown separately in the Schools card above.
Census & demographics
- Census place
- Fayetteville, NC
- County
- Cumberland County · 265,314 people
- City population
- 226,118
- Metro
- Fayetteville, NC
- Population (ZIP)
- 5,710
- Household income
- $78,148
- Rent vs Own
- Severe rent burden
- 344.0
Population outlook (Cumberland County) Hauer SSP2
- Today (2025)
- 330,855 people
- By 2030
- 333,523 · +0.8%
- By 2040
- 335,583 · +1.4%
- By 2050
- 335,325 · +1.4%
- By 2075
- 342,853 · +3.6%
- By 2100
- 340,698 · +3.0%
Race, ethnicity, and origin ACS 2023
- Neighborhood character
- Majority White (64%)
- Race & ethnicity
- White 64% Black 19% Hispanic / Latino 9% Two or more races 5% Asian 3%
- Hispanic origin (detail)
- Mexican 4% Puerto Rican 1% Dominican 2%
- Common ancestry
- Slovak 5% Serbian 3% Italian 2%
- Foreign-born
- 5% · Canada, South Korea
- Languages at home
- 89% English-only · Spanish 7% Tagalog/Filipino 1% Other Indo-European 1%
Political lean MEDSL · Cumberland
- 2024 margin
- D (+13.4) · D 56.1% · R 42.7% · Other 1.2%
- 2008→2024 swing
- -4.3pp toward R · 2008: 17.7pp · 2024: 13.4pp
- All cycles
- 2024: D+13.4 2020: D+16.6 2016: D+16.0 2012: D+19.7 2008: D+17.7
Not yet ingested
- Civics
- —
Market trends
- HPI YoY
- ▼ -90.32%
- Current HPI
- 227.8969
- Rent YoY
- ▲ 3.95%
- Metro
- Fayetteville, NC
- State GDP YoY
- ▲ 3.28%
- F500 in state
- 26
Industry mix (Fortune 500 HQ in NC)
| Industry | F500 HQs | Revenue |
|---|---|---|
| Financial Services | 2 | $213B |
|
||
| Retail | 2 | $95B |
|
||
| Industrial Conglomerate | 1 | $38B |
|
||
| Metals / Steel | 1 | $35B |
|
||
| Utilities | 1 | $30B |
|
||
| Industrial Machinery | 1 | $19B |
|
||
Price history
+1148.8% since first listed10 events — show timeline
- 2026-02-13 Pending — LPRMLS
- 2026-01-19 Listed $99,900 LPRMLS
- 2025-08-29 Price Changed $118,500 LPRMLS
- 2025-08-08 Listed $119,500 LPRMLS
- 2023-06-05 Sold (Public Records) $115,000 Public Records
- 2023-06-02 Sold (MLS) $114,900 LPRMLS
- 2023-05-04 Pending — LPRMLS
- 2023-04-27 Listed $114,900 LPRMLS
- 2023-01-31 Sold (Public Records) $150,000 Public Records
- 1995-01-27 Sold (Public Records) $8,000 Public Records
Property tax history
+9.8%/yrLatest (2025): $1,595 · +88.8% YoY. Source: county tax records.
Cash-flow waterfall
monthlySold comps — $/sqft
last 12 mo · ≤1 miLoading sold comps…