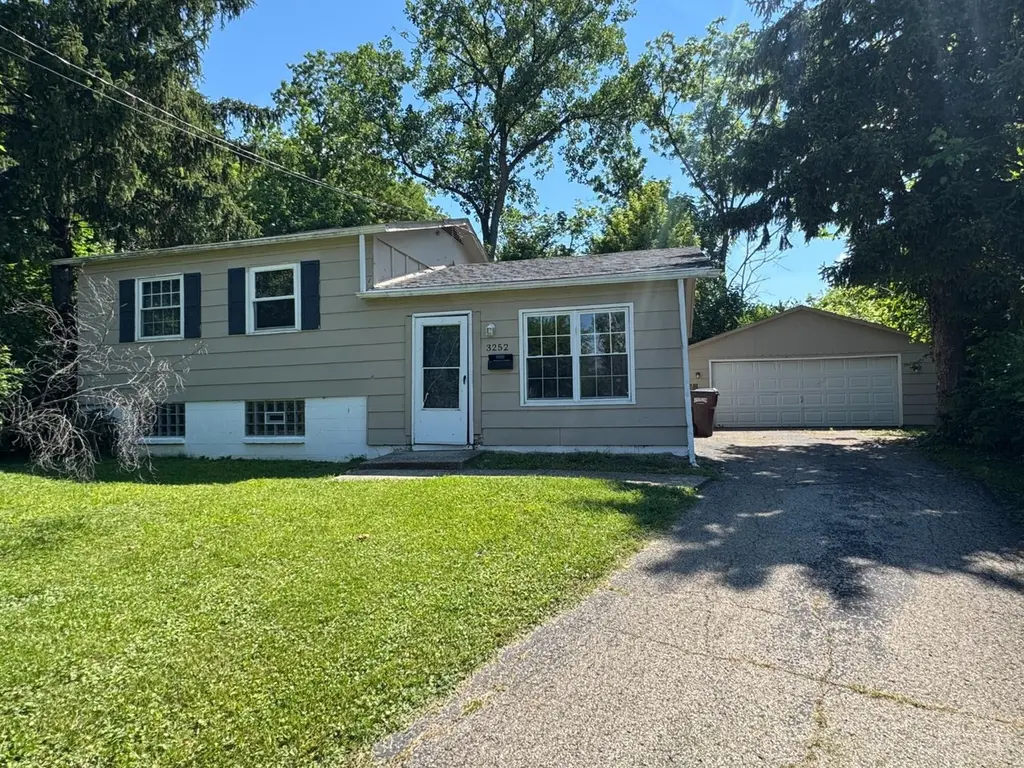
3252 Coleen Dr · Northbrook, OH
Flood risk 7/10 · Major
- FEMA flood zone
- X (unshaded)
- Chance of flooding over 30 yrs
- 0.96%
- Est. flood insurance / yr
- $507 – $1,088
Fire risk 1/10 · Minimal
- Est. fire insurance / yr
- $713 – $1,323
Heat risk 4/10 · Minor
- Hot days now (above 103°F)
- 7 days/yr
- Hot days in 30 yrs
- 19 days/yr
Wind risk 2/10 · Minimal
- Chance of severe wind over 30 yrs
- 1.0%
Air-quality risk 2/10 · Minimal
- Unhealthy air days now
- 1 days/yr
- Unhealthy air days in 30 yrs
- 1 days/yr
Risk factors via First Street. Map © Google.
Why this score? — see what drove the C- grade
The composite is a weighted blend of 9 inputs, each scored 0–100. Each bar is that input's sub-score; the figure is the points it added to the 100-point composite (weight × sub-score).
- Cash flow +16.8/30.0
- ARV discount +12.7/15.0
- DSCR +5.2/10.0
- 1% rule +4.6/10.0
- Schools +3.7/10.0
- Livability +3.4/5.0
- Rent growth +2.5/5.0
- Condition / age +2.5/5.0
- Appreciation +0.0/10.0
$189,900
🖨 Deal sheet (PDF) 📄 Offer letter ✓ Due diligence
Listing remarks MLS
cash only, nice rehab opportunity - Agent Owned
Key facts
- Private driveway
- Attached garage
- Large yard
Tags
Property features AI
Finance
- Other: Residential zoning
- HOA & community: No homeowners association
Exterior
- Parking: Detached garage with 2 garage spaces; Driveway parking; On-street parking available
- Utilities: Public water; Public sewer; Natural gas
- Home design: Traditional single-family home; Walkout entry from kitchen
- Construction: Wood siding; Block foundation; Shingle roof; Second floor area present
- Exterior features: Deck; Wooded lot; Storm and insulated windows
Interior
- Kitchen: Dishwasher; Oven/Range
- Bedrooms: Three bedrooms total; Primary bedroom approximately 14 x 10 (upper level); Second bedroom approximately 12 x 10 (upper level); Third bedroom approximately 11 x 9 (upper level)
- Bathrooms: One full bathroom on upper level (primary bath with tub and shower); One half bathroom
- Heating & cooling: Forced air gas heating; Central air conditioning; Gas water heater
- Interior features: Fireplace; Eat-in kitchen; Walkout from kitchen; Wood cabinets; Cable available
Neighborhood map
What this means for you Summary
Snapshot
- This is a 3-bed/1.5-bath single-family listed at $190k.
Deal economics
- At list price, monthly cash flow is $54 ($651/yr) — positive.
- The deal already cash-flows at list — no discount required.
- To meet the 1% rule (rent ≥ 1% of price), the offer needs to be $182k (4.3% below list).
- Recommended offer: $182k (4.3% below list) — sets the bar for 1% rule.
Location & tenants
- Location reads 68/100 on livability (#555 in OH) — a middle-class / working-renter tenant base. Strengths: cost of living A+, housing A+; Watch: crime C-, health & safety C-, employment D+.
- Northwest Local (suburban): math 38% / reading 46% proficiency, ranked #508 of 656 in OH (top 77%) — families likely to look elsewhere, expect single-tenant / working-renter base with shorter leases.
- Zoned schools: Taylor Elementary School (math 37% / reading 40%, grade F, #1,080 of 1,584 statewide, top 68%, 821 students, 0% FRL); Pleasant Run Middle School (math 31% / reading 38%, grade F, #547 of 654 statewide, top 84%, 689 students, 45% FRL); Northwest High School (math 17% / reading 41%, grade F, #627 of 781 statewide, top 81%, 948 students, 57% FRL).
- Market conditions: 52 active listings in the ZIP; 9 comparable units currently listed for rent nearby; rentals at typical pace (median 15d on market — plan ~3-4 weeks tenant-placement turnaround); 801 units permitted in Hamilton County in 2024 (190 in 5+ unit buildings).
Forward outlook
- Local home prices are declining (-3.0%/yr); year-one equity from $1k of loan paydown is wiped out by about $6k of value loss. Plan a longer hold.
Negotiation context
- Only 4 days on market — expect competitive offers; lowballing is unlikely to land.
- 3 sale attempts since 26y ago with the ask held roughly flat each time — persistent listings suggest the price (not the market) is what's stuck; bring a comps-based counter.
- Current owner paid $85k; list at $190k implies a 123% gain — meaningful room to come down on a strong offer.
Risks & watch-outs
- Watch-outs: flood insurance adds $66/mo.
- Climate carrying-cost: major flood risk — expect insurance premiums to compound above CPI over the hold.
Questions for the listing agent
- Built in 1960 — when were the roof, HVAC, electrical panel, plumbing, and water heater last replaced?
- What's the actual annual flood-insurance premium (NFIP or private), and is the property in a SFHA with mandatory coverage?
- Is there a deadline driving the sale (1031 exchange, divorce, estate, relocation)? That informs how much negotiation room exists.
- Schools are D-rated, which usually means shorter tenancies and higher turnover. Who's the typical renter profile here, and what's been the actual vacancy rate?
- What's the average days-on-market for RENTAL listings here right now (not sales)? A rising rental-DOM trend means longer vacancies and softer asking-rent achievability than the comps imply.
- What's the recent tenant-quality profile in this submarket — average credit score on applications, eviction rate, late-payment / NSF rate, and stable-employment percentage? A property-management company in the area should have these aggregated.
- How much new for-sale + rental construction is in the pipeline within 1–3 miles? Heavy new supply typically softens prices + rents 12–24 months out; constrained supply supports both.
Investment metrics
- 1% rule
- 0.96% ✗
- Cap rate
- 7.06%
- Cash-on-cash
- 2.72%
- DSCR
- 1.12
- GRM
- 8.7
CMA / ARV
- ARV (on-the-fly)
- $214,650
- Comps found
- 6
Show comp detail 6 sales within ~0.75 mi
| Address | Dist | Beds/Ba | Sqft | Sold | Price | $/sf | Match |
|---|---|---|---|---|---|---|---|
| 10123 Manistee Way | 0.74mi | 3/1.5 | 1,457 (+8%) | 0mo | $115,000 | $79 | 52 |
| 2822 Honesdale Ct | 0.69mi | 3/1.5 | 1,329 (-2%) | 23mo | $194,000 | $146 | 46 |
| 9984 Menominee Dr | 0.63mi | 3/2.0 | 1,479 (+10%) | 8mo | $234,500 | $159 | 45 |
| 9971 Menominee Dr | 0.61mi | 3/1.5 | 1,226 (-9%) | 14mo | $201,000 | $164 | 45 |
| 9697 Dunraven Dr | 0.64mi | 3/1.0 | 1,175 (-13%) | 11mo | $137,500 | $117 | 37 |
| 9717 Dunraven Dr | 0.64mi | 3/1.0 | 1,175 (-13%) | 21mo | $190,000 | $162 | 29 |
Match score weights: distance 35% · size 25% · config 20% · recency 20%. Top-matched comps best support the ARV.
Projected returns pro-forma
-3.0% appreciation · 3.0% rent growth · sell at horizon
- IRR
- -14.3%
- Equity multiple
- 0.49×
- Total profit
- $-27,246
- Equity at exit
- $28,315
- IRR
- -5.5%
- Equity multiple
- 0.64×
- Total profit
- $-18,991
- Equity at exit
- $16,419
Cash invested: $53,172 (down + closing). Projections, not guarantees.
Landlord ↔ Tenant lean methodology
- Overall (STATE)
- 73 Landlord-Friendly
- State Ohio
- 73 Landlord-Friendly · R+6
- County
- — inherits STATE
- City
- — inherits STATE
ZIP-level market 45251
- Active inventory
- 52
- Price-to-rent
- 8.7×
Monthly cashflow live
- Estimated rent
- $1,818 high interval (Pro) →
- Mortgage (P&I)
- −$996
- Tax from tax record
- −$241 /mo · $2,886/yr
- Insurance
- −$79
- Flood insurance flood zone
- −$66 /mo · $798/yr
- HOA
- −$0
- Lot rent
- −$0
- Vacancy / Maint / Mgmt
- −$382
- Net cashflow
- $54
Break-even live
Sensitivity live
| Price | -10% $162 | -5% $108 | +0% $54 | +5% $1 | +10% $-53 |
|---|---|---|---|---|---|
| Rent | -10% $-89 | -5% $-18 | +0% $54 | +5% $126 | +10% $198 |
| Rate | -1.0pp $150 | -0.5pp $103 | base $54 | +0.5pp $5 | +1.0pp $-45 |
UW: 25.0% down · 7.5% · 30yr · 1.5% tax · 5.0% vac · 8.0% maint · 8.0% mgmt
Financing live
Cash to close
- Down payment
- $47,475
- Closing costs
- $5,697
- Reserves months
- —
- Total cash needed
- —
Loan-product check · same deal, 3 products live
Conventional
25% down · 7.5% · 30yr
- Down + closing
- —
- Monthly P&I
- —
- Monthly cashflow
- —
- DSCR
- —
- Eligible?
- —
Personal DTI + credit; lowest rate.
DSCR
20% down · 8.5% · 30yr
- Down + closing
- —
- Monthly P&I
- —
- Monthly cashflow
- —
- DSCR
- —
- Eligible?
- —
No personal income docs; deal must DSCR.
Hard money
10% down · 12.0% · 12mo
- Down + closing
- —
- Monthly P&I
- —
- Monthly cashflow
- —
- DSCR
- —
- Eligible?
- —
Short-term bridge; refi at stabilization.
Rent comps 9 comps
| Address | Beds | Baths | Sqft | Rent | $/sqft | DOM | Units | Dist |
|---|---|---|---|---|---|---|---|---|
| 10101 Arborwood Dr Cincinnati, OH | 1.0–3.0 | 1.0–1.5 | 912 | $1,649 | $1.81 | 0d | 28 | 0.29mi |
| 3470 Sunbury Ln Cincinnati, OH | 3.0 | 2.5 | 1178 | $2,250 | $1.91 | 0d | 1 | 0.43mi |
| 9333 Round Top Cincinnati, OH | 1.0–3.0 | 1.0–2.0 | 979 | $1,623 | $1.66 | 0d | 6 | 0.63mi |
| 10220 September Dr Cincinnati, OH | 4.0 | 1.0 | 1025 | $1,890 | $1.84 | 14d | 1 | 0.70mi |
| 3683 Ripplegrove Dr Cincinnati, OH | 3.0 | 1.5 | 1395 | $1,931 | $1.38 | 22d | 1 | 0.88mi |
| 9500 Ridgemoor Ave Cincinnati, OH | 3.0 | 1.0 | 1344 | $1,600 | $1.19 | 10d | 1 | 0.90mi |
| 9939 Voyager Way Cincinnati, OH | 3.0 | 2.0 | 1400 | $2,300 | $1.64 | 46d | 1 | 1.08mi |
| 2753 Town Terrace Dr Cincinnati, OH | 2.0–3.0 | 1.0–1.5 | 968 | $1,450 | $1.50 | 23d | 4 | 1.10mi |
| 9128 Orangewood Dr Cincinnati, OH | 4.0 | 1.0 | 1359 | $1,495 | $1.10 | 26d | 1 | 1.33mi |
Listing history 4 events
-
2026-06-22days on market $189,900 Active 4 DOM
-
2026-06-21days on market $189,900 Active 3 DOM
-
2026-06-21remarks 699-char remark
-
2026-06-21$189,900 Active 2 DOM
ⓘ Source: listings_history table (triggers on properties + properties_extension) + one-shot
backfill from property_details.listing_events for pre-trigger history.
Tax reassessment forecast OH · Partial reset (capped growth)
- Current annual tax
- $2,886 · $241/mo
- Projected year-2 tax
- $2,924 · $244/mo
- Expected delta
- +$38/yr (+$3/mo · 1.3%)
ⓘ Screening estimate from a state-policy table — verify with the county assessor before closing.
Climate risk First Street
- Flood 7/10 Severe FEMA zone X (unshaded) · 96% chance over 30 yrs
- Wildfire 1/10 Low
- Heat 4/10 Moderate 7 d/yr ≥103°F today · 19 d/yr by 30 yrs out
- Wind 2/10 Low 100% chance of damaging wind over 30 yrs
- Air quality 2/10 Low 1 unhealthy d/yr today · 1 by 30 yrs out
Nearby sold comps map
Loading sold comps map…
Walkable amenities ~0.75 mi
Loading nearby amenities…
Taxation est. · year 1
- Rental income
- $21,816
- − Mortgage interest
- −$10,637
- − Property taxes
- −$2,886
- − Insurance
- −$1,747
- − Repairs & maintenance
- −$1,745
- − Management
- −$1,745
- − Depreciation
- −$5,524
- Taxable loss
- −$2,470
- Est. tax savings @ 24.0%
- +$593
- After-tax cash flow
- $1,244/yr
For passive investors: Depreciation is non-cash, so a rental often shows a tax loss while cash-flowing — sheltering income. Rental losses are passive: they offset passive income freely, and up to $25,000/yr can offset ordinary (W-2) income if you actively participate and your MAGI is under $100k (phasing out to $0 by $150k); unused losses carry forward. On sale, claimed depreciation is recaptured at up to 25%, and gains may owe capital-gains tax (a 1031 exchange can defer both). Figures are a year-1 estimate at your 24.0% rate — not tax advice; consult a CPA.
Schools (NCES district)
- District
- Northwest Local
- NCES district ID
- 3904736
- Math proficiency
- 38% ▼ -18.00%
- Reading proficiency
- 46% ▼ -10.00%
- Median HH income
- $58,765
- Composite
- 36.97/100
- National rank
- #4528
- State rank
- #508 of 656 in OH
Livability — Northbrook
- Score
- 68/100
- State rank
- #555
- US rank
- #9479
Category grades
Schools grade is shown separately in the Schools card above.
Census & demographics
- Census place
- Northbrook, OH
- County
- Hamilton County · 701,295 people
- Metro
- Cincinnati, OH-KY-IN
- Population (ZIP)
- 20,254
- Household income
- $74,614
- Rent vs Own
- Severe rent burden
- 442.0
Population outlook (Hamilton County) Hauer SSP2
- Today (2025)
- 826,054 people
- By 2030
- 830,947 · +0.6%
- By 2040
- 832,319 · +0.8%
- By 2050
- 822,428 · -0.4%
- By 2075
- 788,688 · -4.5%
- By 2100
- 710,674 · -14.0%
Race, ethnicity, and origin ACS 2023
- Neighborhood character
- Diverse neighborhood (Simpson 0.57)
- Race & ethnicity
- White 56% Black 34% Two or more races 6% Hispanic / Latino 3% Asian 2%
- Common ancestry
- Iranian 1% Italian 1% Lithuanian 1%
- Foreign-born
- 4% · Canada, China
- Languages at home
- 94% English-only · Spanish 2% Other Asian/Pacific 1% Chinese 1%
Political lean MEDSL · Hamilton
- 2024 margin
- D (+14.9) · D 57.0% · R 42.1%
- 2008→2024 swing
- +7.9pp toward D · 2008: 7.0pp · 2024: 14.9pp
- All cycles
- 2024: D+14.9 2020: D+15.9 2016: D+9.5 2012: D+4.9 2008: D+7.0
Not yet ingested
- Civics
- —
Market trends
- HPI YoY
- ▼ -222.27%
- Current HPI
- 232.8505
- Rent YoY
- —
- Metro
- Cincinnati, OH-KY-IN
- State GDP YoY
- ▲ 1.98%
- F500 in state
- 48
Industry mix (Fortune 500 HQ in OH)
| Industry | F500 HQs | Revenue |
|---|---|---|
| Insurance | 3 | $145B |
|
||
| Industrial Machinery | 3 | $49B |
|
||
| Financial Services | 3 | $24B |
|
||
| Consumer Goods | 2 | $93B |
|
||
| Aerospace / Defense | 2 | $47B |
|
||
| Utilities | 2 | $33B |
|
||
Price history
+171.3% since first listed10 events — show timeline
- 2026-06-18 Listed $189,900 Cincy MLS
- 2020-10-15 Sold (Public Records) $85,000 Public Records
- 2020-09-30 Sold (MLS) $85,000 Cincy MLS
- 2020-09-22 Sold (Public Records) $70,000 Public Records
- 2020-09-22 Contingent — Cincy MLS
- 2020-09-20 Price Changed $86,000 Cincy MLS
- 2020-09-17 Listed $95,000 Cincy MLS
- 2000-05-31 Listing Removed — Cincy MLS
- 2000-02-02 Listed $87,900 Cincy MLS
- 1996-09-17 Sold (Public Records) $70,000 Public Records
Property tax history
+3.6%/yrLatest (2025): $2,886 · +5.0% YoY. Source: county tax records.
Cash-flow waterfall
monthlySold comps — $/sqft
last 12 mo · ≤1 miLoading sold comps…