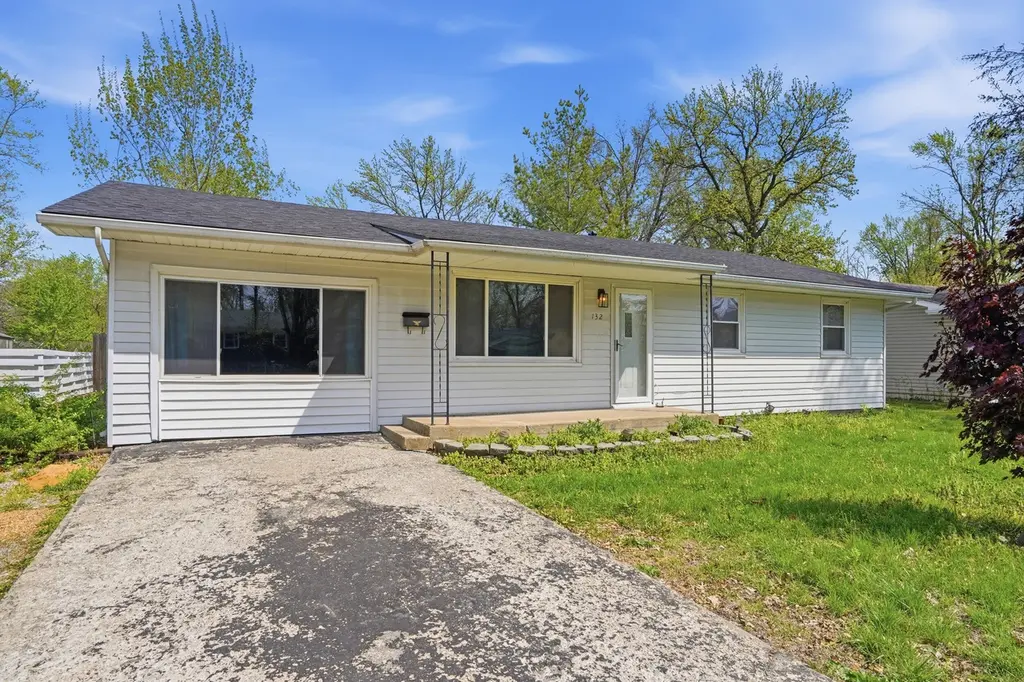
132 S Reed St · Centralia, MO
Flood risk 1/10 · Minimal
- FEMA flood zone
- X (unshaded)
- Chance of flooding over 30 yrs
- 0.0%
- Est. flood insurance / yr
- $473 – $860
Fire risk 1/10 · Minimal
- Est. fire insurance / yr
- $1,054 – $1,958
Heat risk 3/10 · Minor
- Hot days now (above 105°F)
- 7 days/yr
- Hot days in 30 yrs
- 18 days/yr
Wind risk 2/10 · Minimal
- Chance of severe wind over 30 yrs
- —
Air-quality risk 2/10 · Minimal
- Unhealthy air days now
- 1 days/yr
- Unhealthy air days in 30 yrs
- 1 days/yr
Risk factors via First Street. Map © Google.
Why this score? — see what drove the D grade
The composite is a weighted blend of 9 inputs, each scored 0–100. Each bar is that input's sub-score; the figure is the points it added to the 100-point composite (weight × sub-score).
- ARV discount +14.7/15.0
- Cash flow +10.8/30.0
- Schools +3.9/10.0
- Livability +3.5/5.0
- DSCR +3.1/10.0
- Rent growth +2.5/5.0
- Condition / age +2.5/5.0
- 1% rule +2.4/10.0
- Appreciation +0.0/10.0
$165,000
🖨 Deal sheet (PDF) 📄 Offer letter ✓ Due diligence
Listing remarks MLS
Tucked away on a quiet street on a large lot, just shy of a half an acre, you'll find this charming 4 bedroom, 2 bathroom home! With spacious bedrooms, a large living room, and eat in kitchen, this home has the space you need to spread out! The fully fenced in backyard offers plenty of room to garden, entertain, and also has two storage sheds that convey. The home is in need of a few repairs, and is being sold as-is, but with some sweat equity, it could be an amazing investment!!
Key facts
- Quiet street
- Large lot
- Two storage sheds
Tags
Neighborhood map
What this means for you Summary
Snapshot
- This is a 4-bed/2.0-bath single-family listed at $165k.
Deal economics
- At list price, monthly cash flow is $-75 ($-897/yr) — negative.
- To cash-flow at today's rent, offer at most $152k (8.0% below list).
- To meet the 1% rule (rent ≥ 1% of price), the offer needs to be $123k (25.6% below list).
- Recommended offer: $123k (25.6% below list) — sets the bar for 1% rule.
- Cap rate 5.7% vs local median 2.8% in Centralia — top-decile yield for the area; either an underpriced asset or a hidden risk that comps aren't pricing in. Stress-test before assuming the spread holds.
Location & tenants
- Location reads 70/100 on livability (#127 in MO) — a middle-class / working-renter tenant base. Strengths: crime A+, cost of living A+, housing A+; Watch: amenities F, commute F, health & safety F.
- Centralia R-VI (town): math 43% / reading 48% proficiency, ranked #82 of 324 in MO (top 25%) — families likely to look elsewhere, expect single-tenant / working-renter base with shorter leases.
- Zoned schools: Chance Elem. (319 students, 25% FRL); Chester Boren Middle (math 43% / reading 41%, grade D-, #149 of 391 statewide, top 41%, 300 students, 31% FRL); Centralia High (math 52% / reading 62%, grade C, #51 of 521 statewide, top 11%, 406 students, 26% FRL) — zoned schools at 27% FRL track the district average.
- Market conditions: 71 active listings in the ZIP; 1,303 units permitted in Boone County in 2024 (549 in 5+ unit buildings).
Forward outlook
- Local home prices are declining (-3.0%/yr); year-one equity from $1k of loan paydown is wiped out by about $5k of value loss. Plan a longer hold.
- Boone County population projected at +36% by 2050 — long-run rental-demand tailwind backs the buy-and-hold thesis.
Negotiation context
- It's been on market 25 days — a 2% lower offer ($163k) is reasonable based on typical stale-listing flexibility.
- 4 sale attempts since 6y ago; this cycle's ask has dropped $10k (6%) from the opening price — seller is motivated, your offer sets the floor, not the list.
Questions for the listing agent
- What do current leases actually rent for vs. the listed asking? Can we see a recent rent roll and the last 12 months of T-12 income?
- Built in 1965 — when were the roof, HVAC, electrical panel, plumbing, and water heater last replaced?
- Is there a deadline driving the sale (1031 exchange, divorce, estate, relocation)? That informs how much negotiation room exists.
- Schools are B-rated — typically a magnet for longer-tenancy family renters. What's the average tenant stay here, and is there a school-zone premium baked into asking?
- The area grade is low — what's the realistic commute time and amenity access for the typical tenant pool here? Any planned neighborhood developments (good or bad) we should know about?
- What's the average days-on-market for RENTAL listings here right now (not sales)? A rising rental-DOM trend means longer vacancies and softer asking-rent achievability than the comps imply.
- What's the recent tenant-quality profile in this submarket — average credit score on applications, eviction rate, late-payment / NSF rate, and stable-employment percentage? A property-management company in the area should have these aggregated.
- How much new for-sale + rental construction is in the pipeline within 1–3 miles? Heavy new supply typically softens prices + rents 12–24 months out; constrained supply supports both.
Investment metrics
- 1% rule
- 0.74% ✗
- Cap rate
- 5.75%
- Cash-on-cash
- -1.94%
- DSCR
- 0.91
- GRM
- 11.2
CMA / ARV
- ARV (median comp)
- $196,609
- List price
- $165,000
- Delta
- -16.08%
- Verdict
- UNDERPRICED
- Comps
- 20 within 1.0 mi
Show comp detail 12 sales within ~0.75 mi
| Address | Dist | Beds/Ba | Sqft | Sold | Price | $/sf | Match |
|---|---|---|---|---|---|---|---|
| 213 S Reed St | 0.08mi | 4/2.0 | 1,250 (-11%) | 9mo | $200,000 | $160 | 71 |
| 442 S Jenkins St | 0.51mi | 3/2.0 (-1) | 1,402 (+0%) | 4mo | $162,500 | $116 | 67 |
| 605 S Central St | 0.44mi | 3/2.0 (-1) | 1,350 (-4%) | 3mo | $200,000 | $148 | 66 |
| 805 S Rollins St | 0.73mi | 4/2.0 | 1,400 (0%) | 3mo | $199,900 | $143 | 63 |
| 780 Doty Ave | 0.25mi | 3/2.0 (-1) | 1,578 (+13%) | 3mo | $169,500 | $107 | 59 |
| 780 Tidball Ave | 0.29mi | 3/1.0 (-1) | 1,260 (-10%) | 4mo | $189,500 | $150 | 57 |
| 760 Tidball Ave | 0.29mi | 3/2.0 (-1) | 1,192 (-15%) | 2mo | $205,000 | $172 | 55 |
| 610 S Green St | 0.48mi | 3/2.0 (-1) | 1,248 (-11%) | 9mo | $165,000 | $132 | 47 |
| 805 Chris Court Ct | 0.68mi | 3/2.0 (-1) | 1,521 (+9%) | 2mo | $265,000 | $174 | 47 |
| 201 Southwest Cir | 0.71mi | 3/2.0 (-1) | 1,500 (+7%) | 8mo | $269,900 | $180 | 43 |
| 806 S Allen St | 0.73mi | 3/1.0 (-1) | 1,224 (-13%) | 1mo | $179,700 | $147 | 35 |
| 6 Mayes Meadow Mdw | 0.73mi | 3/1.5 (-1) | 1,196 (-15%) | 9mo | $219,000 | $183 | 27 |
Match score weights: distance 35% · size 25% · config 20% · recency 20%. Top-matched comps best support the ARV.
Projected returns pro-forma
-3.0% appreciation · 3.0% rent growth · sell at horizon
- IRR
- -19.5%
- Equity multiple
- 0.32×
- Total profit
- $-31,540
- Equity at exit
- $24,602
- IRR
- -12.4%
- Equity multiple
- 0.27×
- Total profit
- $-33,761
- Equity at exit
- $14,266
Cash invested: $46,200 (down + closing). Projections, not guarantees.
Landlord ↔ Tenant lean methodology
- Overall (STATE)
- 81 Strongly Landlord-Friendly
- State Missouri
- 81 Strongly Landlord-Friendly · R+10
- County
- — inherits STATE
- City
- — inherits STATE
ZIP-level market 65240
- Home prices YoY
- -20.6%
- Active inventory
- 71
- Price-to-rent
- 11.2×
Monthly cashflow live
- Estimated rent
- $1,227 medium interval (Pro) →
- Mortgage (P&I)
- −$865
- Tax from tax record
- −$110 /mo · $1,319/yr
- Insurance
- −$69
- HOA
- −$0
- Vacancy / Maint / Mgmt
- −$258
- Net cashflow
- $-75
Break-even live
Sensitivity live
| Price | -10% $19 | -5% $-28 | +0% $-75 | +5% $-121 | +10% $-168 |
|---|---|---|---|---|---|
| Rent | -10% $-172 | -5% $-123 | +0% $-75 | +5% $-26 | +10% $22 |
| Rate | -1.0pp $8 | -0.5pp $-33 | base $-75 | +0.5pp $-118 | +1.0pp $-161 |
UW: 25.0% down · 7.5% · 30yr · 1.5% tax · 5.0% vac · 8.0% maint · 8.0% mgmt
Financing live
Cash to close
- Down payment
- $41,250
- Closing costs
- $4,950
- Reserves months
- —
- Total cash needed
- —
Loan-product check · same deal, 3 products live
Conventional
25% down · 7.5% · 30yr
- Down + closing
- —
- Monthly P&I
- —
- Monthly cashflow
- —
- DSCR
- —
- Eligible?
- —
Personal DTI + credit; lowest rate.
DSCR
20% down · 8.5% · 30yr
- Down + closing
- —
- Monthly P&I
- —
- Monthly cashflow
- —
- DSCR
- —
- Eligible?
- —
No personal income docs; deal must DSCR.
Hard money
10% down · 12.0% · 12mo
- Down + closing
- —
- Monthly P&I
- —
- Monthly cashflow
- —
- DSCR
- —
- Eligible?
- —
Short-term bridge; refi at stabilization.
Listing history 10 events
-
2026-05-12status Pending 484-char remark
Show marketing remark (484 chars)
Tucked away on a quiet street on a large lot, just shy of a half an acre, you'll find this charming 4 bedroom, 2 bathroom home! With spacious bedrooms, a large living room, and eat in kitchen, this home has the space you need to spread out! The fully fenced in backyard offers plenty of room to garden, entertain, and also has two storage sheds that convey. The home is in need of a few repairs, and is being sold as-is, but with some sweat equity, it could be an amazing investment!!
-
2026-05-05price $165,000 484-char remark
Show marketing remark (484 chars)
Tucked away on a quiet street on a large lot, just shy of a half an acre, you'll find this charming 4 bedroom, 2 bathroom home! With spacious bedrooms, a large living room, and eat in kitchen, this home has the space you need to spread out! The fully fenced in backyard offers plenty of room to garden, entertain, and also has two storage sheds that convey. The home is in need of a few repairs, and is being sold as-is, but with some sweat equity, it could be an amazing investment!!
-
2026-04-17$175,000 Active 484-char remark
Show marketing remark (484 chars)
Tucked away on a quiet street on a large lot, just shy of a half an acre, you'll find this charming 4 bedroom, 2 bathroom home! With spacious bedrooms, a large living room, and eat in kitchen, this home has the space you need to spread out! The fully fenced in backyard offers plenty of room to garden, entertain, and also has two storage sheds that convey. The home is in need of a few repairs, and is being sold as-is, but with some sweat equity, it could be an amazing investment!!
-
2023-08-16historical 374-char remark
Show marketing remark (374 chars)
Spacious 4 BR ranch - great one level living! Large lot - room for garden and play - sidewalk at back of property takes you to uptown or the rec center. large rooms, eat-in kitchen, newer roof, vinyl windows, central heat & air, electrical panel, and water heater! This home is neat and clean and move in ready! Fiber internet available. Located in USDA eligible area.
-
2021-09-24soldstatus
-
2021-09-23soldstatus
-
2021-08-15$133,000
-
2021-08-03$133,000 374-char remark
Show marketing remark (374 chars)
Spacious 4 BR ranch - great one level living! Large lot - room for garden and play - sidewalk at back of property takes you to uptown or the rec center. large rooms, eat-in kitchen, newer roof, vinyl windows, central heat & air, electrical panel, and water heater! This home is neat and clean and move in ready! Fiber internet available. Located in USDA eligible area.
-
2020-09-26$133,000
-
2011-08-12soldstatus
ⓘ Source: listings_history table (triggers on properties + properties_extension) + one-shot
backfill from property_details.listing_events for pre-trigger history.
Tax reassessment forecast MO · Resets to sale price
- Current annual tax
- $1,319 · $110/mo
- Projected year-2 tax
- $1,600 · $133/mo
- Expected delta
- +$281/yr (+$23/mo · 21.3%)
ⓘ Screening estimate from a state-policy table — verify with the county assessor before closing.
Climate risk First Street
- Flood 1/10 Low FEMA zone X (unshaded) · 0% chance over 30 yrs
- Wildfire 1/10 Low
- Heat 3/10 Moderate 7 d/yr ≥105°F today · 18 d/yr by 30 yrs out
- Wind 2/10 Low
- Air quality 2/10 Low 1 unhealthy d/yr today · 1 by 30 yrs out
Nearby sold comps map
Loading sold comps map…
Walkable amenities ~0.75 mi
Loading nearby amenities…
Taxation est. · year 1
- Rental income
- $14,722
- − Mortgage interest
- −$9,243
- − Property taxes
- −$1,319
- − Insurance
- −$825
- − Repairs & maintenance
- −$1,178
- − Management
- −$1,178
- − Depreciation
- −$4,800
- Taxable loss
- −$3,820
- Est. tax savings @ 24.0%
- +$917
- After-tax cash flow
- $20/yr
For passive investors: Depreciation is non-cash, so a rental often shows a tax loss while cash-flowing — sheltering income. Rental losses are passive: they offset passive income freely, and up to $25,000/yr can offset ordinary (W-2) income if you actively participate and your MAGI is under $100k (phasing out to $0 by $150k); unused losses carry forward. On sale, claimed depreciation is recaptured at up to 25%, and gains may owe capital-gains tax (a 1031 exchange can defer both). Figures are a year-1 estimate at your 24.0% rate — not tax advice; consult a CPA.
Schools (NCES district)
- District
- Centralia R-VI
- NCES district ID
- 2908400
- Math proficiency
- 43% ▼ -7.00%
- Reading proficiency
- 48% ▼ -8.00%
- Median HH income
- $50,465
- Composite
- 39.08/100
- National rank
- #4048
- State rank
- #82 of 324 in MO
Livability — Centralia
- Score
- 70/100
- State rank
- #127
- US rank
- #7477
Category grades
Schools grade is shown separately in the Schools card above.
Census & demographics
- Census place
- Centralia, MO
- City population
- 8,740
- Population (ZIP)
- 8,740
Population outlook (Boone County) Hauer SSP2
- Today (2025)
- 202,891 people
- By 2030
- 217,799 · +7.3%
- By 2040
- 246,789 · +21.6%
- By 2050
- 276,116 · +36.1%
- By 2075
- 348,426 · +71.7%
- By 2100
- 400,856 · +97.6%
Race, ethnicity, and origin ACS 2023
- Neighborhood character
- Predominantly White (92%)
- Race & ethnicity
- White 92% Two or more races 7% Hispanic / Latino 2%
- Common ancestry
- Italian 4% Slovak 2% Lithuanian 2%
- Foreign-born
- 1%
Political lean MEDSL · Boone
- 2024 margin
- Lean D (+9.8) · D 53.9% · R 44.1% · Other 2.1%
- 2008→2024 swing
- -2.2pp toward R · 2008: 12.0pp · 2024: 9.8pp
- All cycles
- 2024: D+9.8 2020: D+12.5 2016: D+5.9 2012: D+3.1 2008: D+12.0
Not yet ingested
- Civics
- —
Market trends
- HPI YoY
- ▼ -65.18%
- Current HPI
- 251.817
- Rent YoY
- —
- Metro
- —
- State GDP YoY
- ▲ 1.84%
- F500 in state
- 20
Industry mix (Fortune 500 HQ in MO)
| Industry | F500 HQs | Revenue |
|---|---|---|
| Healthcare | 1 | $163B |
|
||
| Insurance | 1 | $21B |
|
||
| Industrial Technology | 1 | $17B |
|
||
| Retail | 1 | $16B |
|
||
| Industrial Distribution | 1 | $10B |
|
||
| Utilities | 1 | $9B |
|
||
Price history
+24.1% since first listed10 events — show timeline
- 2026-05-12 Pending — CBORMLS
- 2026-05-05 Price Changed $165,000 CBORMLS
- 2026-04-17 Listed $175,000 CBORMLS
- 2023-08-16 Delisted — RCBR
- 2021-09-24 Sold (Public Records) — Public Records
- 2021-09-23 Sold (MLS) — CBORMLS
- 2021-08-15 Listed $133,000 CBORMLS
- 2021-08-03 Listed $133,000 RCBR
- 2020-09-26 Listed $133,000 CBORMLS
- 2011-08-12 Sold (Public Records) — Public Records
Property tax history
+5.5%/yrLatest (2025): $1,319 · +14.3% YoY. Source: county tax records.
Cash-flow waterfall
monthlySold comps — $/sqft
last 12 mo · ≤1 miLoading sold comps…