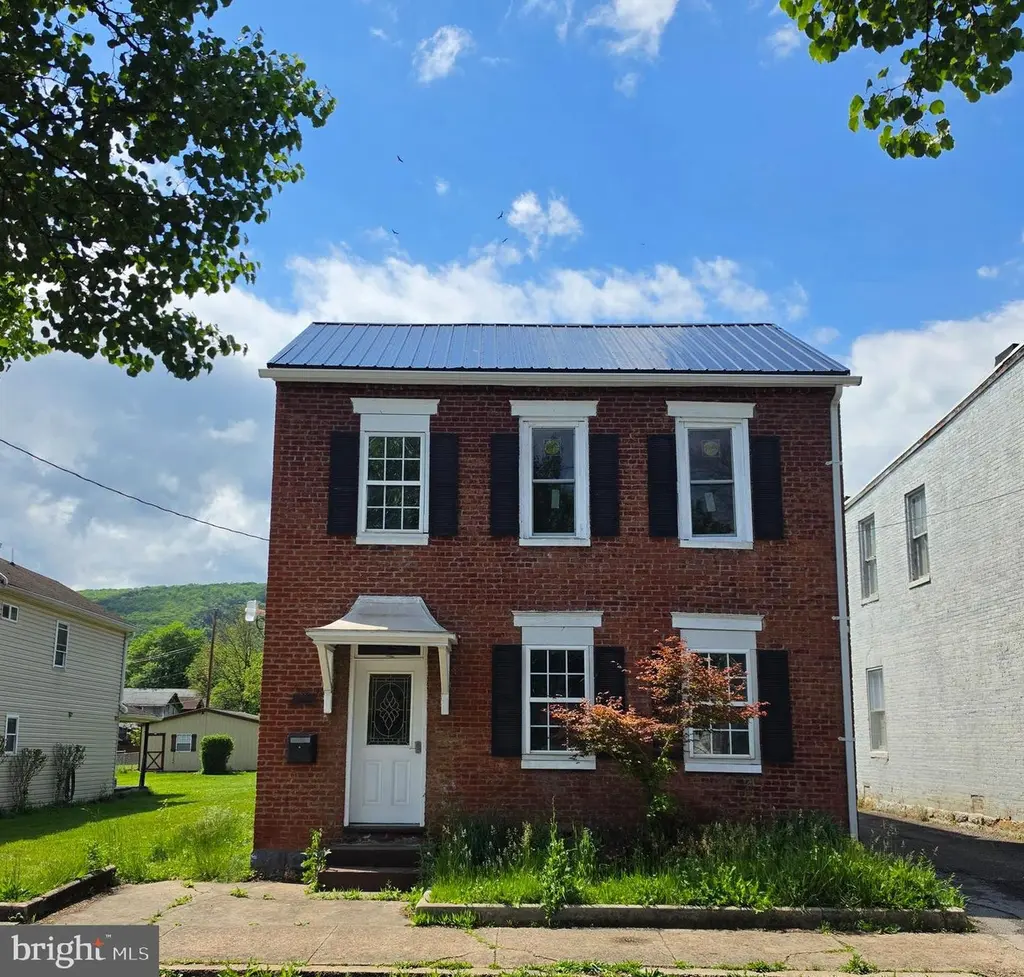
216 Valley St · Cumberland, MD
Flood risk No data
- FEMA flood zone
- —
- Chance of flooding over 30 yrs
- —
- Est. flood insurance / yr
- —
Fire risk No data
- Est. fire insurance / yr
- —
Heat risk No data
- Hot days now (above threshold)
- —
- Hot days in 30 yrs
- —
Wind risk No data
- Chance of severe wind over 30 yrs
- —
Air-quality risk No data
- Unhealthy air days now
- —
- Unhealthy air days in 30 yrs
- —
Risk factors via First Street. Map © Google.
Why this score? — see what drove the C- grade
The composite is a weighted blend of 9 inputs, each scored 0–100. Each bar is that input's sub-score; the figure is the points it added to the 100-point composite (weight × sub-score).
- ARV discount +15.0/15.0
- Cash flow +13.7/30.0
- Rent growth +5.0/5.0
- DSCR +4.2/10.0
- Livability +3.9/5.0
- 1% rule +3.8/10.0
- Condition / age +2.5/5.0
- Schools +1.9/10.0
- Appreciation +0.0/10.0
$135,000
🖨 Deal sheet 📄 Offer letter ✓ Due diligence
Listing remarks MLS
Renovated 2-3 Bedroom 2 Story Brick. Also Featuring an attached Efficiency Apt. This Property Has Metal Roof , Fireplaces, Loads of character and charm. 2 Fireplaces. Off street parking. * * * Must see to appreciate. * * * Ready To Move In. * * * Live in One Rent the other. or Rent Both. * * * * View Survey * * * * Parcel #1 as shown is Survey (Approx 0.0687 AC. 30 Feet By 100 Feet. ) is what conveys * * * * *
Key facts
- Guest accommodations
- Two-unit property
- Small office space
Tags
Property features AI
Exterior
- Parking: Off-street parking
- Utilities: Public water; Public sewer
- Home design: Detached property; Metal roof; Permanent foundation; Property condition: Average; Ownership: Fee simple
- Construction: Brick construction; Metal roof; Permanent foundation; Above-grade and below-grade structures noted
- Exterior features: Not in a federal flood zone; In city limits (Cumberland); Lot dimensions recorded by assessor
Interior
- Bedrooms: Two bedrooms on the first upper level
- Flooring: Hardwood
- Bathrooms: One full bathroom (upper level); One half bathroom (main level)
- Heating & cooling: Baseboard electric heating; Electric hot water
- Interior features: Hardwood flooring; One fireplace; Partial basement
Neighborhood map
What this means for you Summary
Snapshot
- This is a 2-bed/2.0-bath single-family listed at $135k.
Deal economics
- At list price, monthly cash flow is $11 ($128/yr) — positive.
- The deal already cash-flows at list — no discount required.
- To meet the 1% rule (rent ≥ 1% of price), the offer needs to be $119k (11.5% below list).
- Recommended offer: $119k (11.5% below list) — sets the bar for 1% rule.
Location & tenants
- Location reads 78/100 on livability (#64 in MD, #2,385 nationally) — a middle-class / working-renter tenant base. Strengths: amenities A+, commute A+, cost of living A+; Watch: schools D+, crime F, employment F.
- Allegany County Public Schools (other): math 15% / reading 30% proficiency, ranked #18 of 24 in MD (top 75%) — low school quality limits family demand, transient renter base, plan for 1-2y turnover.
- Market conditions: Rents rising fast (+10.9%/yr); 235 active listings in the ZIP; 5 comparable units currently listed for rent nearby; rentals lingering (median 44d on market — plan ~5-8 weeks vacancy on turnover, expect pricing pressure); 100% of comp listings sitting > 30 days — soft ceiling on asking rent; 24 units permitted in Allegany County in 2024 (0 in 5+ unit buildings).
Forward outlook
- Local home prices are declining (-3.0%/yr); year-one equity from $933 of loan paydown is wiped out by about $4k of value loss. Plan a longer hold.
- Allegany County population projected at -14% by 2050 — secular population decline; favor cash flow + early exit over multi-decade hold.
Negotiation context
- Only 7 days on market — expect competitive offers; lowballing is unlikely to land.
- 5 sale attempts since 24y ago with the ask held roughly flat each time — persistent listings suggest the price (not the market) is what's stuck; bring a comps-based counter.
- Current owner paid $75k; list at $135k implies a 80% gain — meaningful room to come down on a strong offer.
Risks & watch-outs
- Watch-outs: built in 1875 — expect roof / HVAC / electrical / plumbing capex.
Questions for the listing agent
- Built in 1875 — when were the roof, HVAC, electrical panel, plumbing, and water heater last replaced?
- Is there a deadline driving the sale (1031 exchange, divorce, estate, relocation)? That informs how much negotiation room exists.
- Schools are D-rated, which usually means shorter tenancies and higher turnover. Who's the typical renter profile here, and what's been the actual vacancy rate?
- Crime grade is F in this area — have there been break-ins, vandalism, or insurance claims at this property in the last 3 years? What carrier currently insures it and at what premium?
- What's the average days-on-market for RENTAL listings here right now (not sales)? A rising rental-DOM trend means longer vacancies and softer asking-rent achievability than the comps imply.
- What's the recent tenant-quality profile in this submarket — average credit score on applications, eviction rate, late-payment / NSF rate, and stable-employment percentage? A property-management company in the area should have these aggregated.
- How much new for-sale + rental construction is in the pipeline within 1–3 miles? Heavy new supply typically softens prices + rents 12–24 months out; constrained supply supports both.
Investment metrics
- 1% rule
- 0.88% ✗
- Cap rate
- 6.39%
- Cash-on-cash
- 0.34%
- DSCR
- 1.02
- GRM
- 9.4
CMA / ARV
- ARV (on-the-fly)
- $163,936
- Comps found
- 12
Show comp detail 12 sales within ~0.75 mi
| Address | Dist | Beds/Ba | Sqft | Sold | Price | $/sf | Match |
|---|---|---|---|---|---|---|---|
| 411 Pulaski St | 0.14mi | 3/2.0 (+1) | 1,900 (+9%) | 0mo | $66,000 | $35 | 73 |
| 121 Independence St | 0.38mi | 2/1.0 | 1,794 (+3%) | 3mo | $45,000 | $25 | 71 |
| 308 Cumberland St | 0.40mi | 3/1.5 (+1) | 1,684 (-3%) | 2mo | $265,000 | $157 | 67 |
| 1106 Holland St | 0.59mi | 3/2.0 (+1) | 1,770 (+2%) | 1mo | $166,000 | $94 | 64 |
| 806 Trost Ave | 0.63mi | 3/2.0 (+1) | 1,758 (+1%) | 1mo | $220,000 | $125 | 64 |
| 840 Columbia Ave | 0.39mi | 3/2.0 (+1) | 1,590 (-9%) | 2mo | $183,500 | $115 | 60 |
| 520 Cumberland St | 0.46mi | 2/2.0 | 1,540 (-12%) | 2mo | $122,000 | $79 | 57 |
| 517 Linden St | 0.51mi | 3/2.0 (+1) | 1,872 (+7%) | 5mo | $87,000 | $46 | 55 |
| 118 Karns Ave | 0.75mi | 3/1.5 (+1) | 1,741 (-0%) | 3mo | $152,000 | $87 | 55 |
| 109 Karns Ave | 0.73mi | 3/2.5 (+1) | 1,716 (-2%) | 3mo | $175,000 | $102 | 54 |
| 17 N Chase St | 0.50mi | 3/1.5 (+1) | 1,964 (+13%) | 0mo | $121,000 | $62 | 48 |
| 501 Rose Hill Ave | 0.69mi | 3/1.5 (+1) | 1,612 (-8%) | 2mo | $159,900 | $99 | 46 |
Match score weights: distance 35% · size 25% · config 20% · recency 20%. Top-matched comps best support the ARV.
Projected returns pro-forma
-3.0% appreciation · 8.0% rent growth · sell at horizon
- IRR
- -10.3%
- Equity multiple
- 0.61×
- Total profit
- $-14,864
- Equity at exit
- $20,129
- IRR
- 4.9%
- Equity multiple
- 1.44×
- Total profit
- $16,739
- Equity at exit
- $11,672
Cash invested: $37,800 (down + closing). Projections, not guarantees.
Landlord ↔ Tenant lean methodology
- Overall (STATE)
- 27 Tenant-Leaning
- State Maryland
- 27 Tenant-Leaning · D+14
- County
- — inherits STATE
- City
- — inherits STATE
ZIP-level market 21502
- Home prices YoY
- -17.4%
- Rents YoY
- 10.9%
- Active inventory
- 235
- Price-to-rent
- 9.4×
Monthly cashflow live
- Estimated rent
- $1,194 high interval (Pro) →
- Mortgage (P&I)
- −$708
- Tax est. 1.5%
- −$169 /mo · $2,025/yr
- Insurance
- −$56
- HOA
- −$0
- Vacancy / Maint / Mgmt
- −$251
- Net cashflow
- $11
Break-even live
UW: 25.0% down · 7.5% · 30yr · 1.5% tax · 5.0% vac · 8.0% maint · 8.0% mgmt
Financing live
Cash to close
- Down payment
- $33,750
- Closing costs
- $4,050
- Reserves months
- —
- Total cash needed
- —
Loan-product check · same deal, 3 products live
Conventional
25% down · 7.5% · 30yr
- Down + closing
- —
- Monthly P&I
- —
- Monthly cashflow
- —
- DSCR
- —
- Eligible?
- —
Personal DTI + credit; lowest rate.
DSCR
20% down · 8.5% · 30yr
- Down + closing
- —
- Monthly P&I
- —
- Monthly cashflow
- —
- DSCR
- —
- Eligible?
- —
No personal income docs; deal must DSCR.
Hard money
10% down · 12.0% · 12mo
- Down + closing
- —
- Monthly P&I
- —
- Monthly cashflow
- —
- DSCR
- —
- Eligible?
- —
Short-term bridge; refi at stabilization.
Rent comps 5 comps
| Address | Beds | Baths | Sqft | Rent | $/sqft | DOM | Units | Dist |
|---|---|---|---|---|---|---|---|---|
| 423 Furnace St Cumberland, MD | 3.0 | 1.5 | 1440 | $1,250 | $0.87 | 43d | 1 | 0.17mi |
| 418 N Mechanic St Unit 1C Cumberland, MD | 3.0 | 1.0 | 1500 | $1,295 | $0.86 | 43d | 1 | 0.21mi |
| 118 Independence St Cumberland, MD | 3.0 | 1.5 | 1260 | $1,250 | $0.99 | 44d | 1 | 0.40mi |
| 516 Bedford St Cumberland, MD | 3.0 | 1.5 | 1500 | $1,195 | $0.80 | 43d | 1 | 0.52mi |
| 201 Spring St Cumberland, MD | 3.0 | 1.0 | 1332 | $950 | $0.71 | 43d | 1 | 1.09mi |
Listing history 7 events
-
2026-06-19days on market $135,000 Active 7 DOM
-
2026-06-18days on market $135,000 Active 6 DOM
-
2026-06-17days on market $135,000 Active 5 DOM
-
2026-06-16days on market $135,000 Active 4 DOM
-
2026-06-15days on market $135,000 Active 3 DOM
-
2026-06-13remarks 601-char remark
-
2026-06-13$135,000 Active 1 DOM
ⓘ Source: listings_history table (triggers on properties + properties_extension) + one-shot
backfill from property_details.listing_events for pre-trigger history.
Nearby sold comps map
Loading sold comps map…
Walkable amenities ~0.75 mi
Loading nearby amenities…
Taxation est. · year 1
- Rental income
- $14,334
- − Mortgage interest
- −$7,562
- − Property taxes
- −$2,025
- − Insurance
- −$675
- − Repairs & maintenance
- −$1,147
- − Management
- −$1,147
- − Depreciation
- −$3,927
- Taxable loss
- −$2,149
- Est. tax savings @ 24.0%
- +$516
- After-tax cash flow
- $644/yr
For passive investors: Depreciation is non-cash, so a rental often shows a tax loss while cash-flowing — sheltering income. Rental losses are passive: they offset passive income freely, and up to $25,000/yr can offset ordinary (W-2) income if you actively participate and your MAGI is under $100k (phasing out to $0 by $150k); unused losses carry forward. On sale, claimed depreciation is recaptured at up to 25%, and gains may owe capital-gains tax (a 1031 exchange can defer both). Figures are a year-1 estimate at your 24.0% rate — not tax advice; consult a CPA.
Schools (NCES district)
- District
- Allegany County Public Schools
- NCES district ID
- 2400030
- Math proficiency
- 15% ▼ -26.00%
- Reading proficiency
- 30% ▼ -20.00%
- Median HH income
- $39,760
- Composite
- 18.95/100
- National rank
- #8854
- State rank
- #18 of 24 in MD
Livability — Cumberland
- Score
- 78/100
- State rank
- #64
- US rank
- #2385
Category grades
Schools grade is shown separately in the Schools card above.
Census & demographics
- Census place
- Cumberland, MD
- County
- Allegany County · 41,015 people
- City population
- 41,015
- Metro
- Cumberland, MD-WV
- Population (ZIP)
- 41,015
- Household income
- $60,725
- Rent vs Own
- Severe rent burden
- 824.0
Population outlook (Allegany County) Hauer SSP2
- Today (2025)
- 68,778 people
- By 2030
- 66,766 · -2.9%
- By 2040
- 62,784 · -8.7%
- By 2050
- 59,179 · -14.0%
- By 2075
- 50,732 · -26.2%
- By 2100
- 40,837 · -40.6%
Race, ethnicity, and origin ACS 2023
- Neighborhood character
- Predominantly White (83%)
- Race & ethnicity
- White 83% Black 9% Two or more races 5% Hispanic / Latino 2%
- Common ancestry
- Slovak 3% Romanian 2% Italian 1%
- Foreign-born
- 2% · Canada
- Languages at home
- 96% English-only · Spanish 2%
Political lean MEDSL · Allegany
- 2024 margin
- Solid R (+40.3) · D 28.9% · R 69.2% · Other 2.0%
- 2008→2024 swing
- -14.4pp toward R · 2008: -25.9pp · 2024: -40.3pp
- All cycles
- 2024: R+40.3 2020: R+38.3 2016: R+48.0 2012: R+32.9 2008: R+25.9
Not yet ingested
- Civics
- —
Market trends
- HPI YoY
- ▼ -54.33%
- Current HPI
- 258.6676
- Rent YoY
- ▲ 10.88%
- Metro
- Cumberland, MD-WV
- State GDP YoY
- ▲ 2.97%
- F500 in state
- 12
Industry mix (Fortune 500 HQ in MD)
| Industry | F500 HQs | Revenue |
|---|---|---|
| Aerospace / Defense | 1 | $71B |
|
||
| Utilities | 1 | $25B |
|
||
| Hotels | 1 | $24B |
|
||
| Consumer Goods | 1 | $7B |
|
||
| Real Estate | 1 | $6B |
|
||
| Chemicals | 1 | $2B |
|
||
Price history
+80.2% since first listed11 events — show timeline
- 2026-06-12 Listed $135,000 BRIGHT MLS
- 2025-12-16 Listing Removed — BRIGHT MLS
- 2025-08-18 Listed $130,000 BRIGHT MLS
- 2022-11-02 Listing Removed — BRIGHT MLS
- 2022-11-02 Sold (MLS) $74,900 BRIGHT MLS
- 2022-09-24 Contingent — BRIGHT MLS
- 2022-09-17 Listed $74,900 BRIGHT MLS
- 2003-12-19 Delisted — MRIS
- 2003-11-22 Listed — MRIS
- 2002-07-02 Delisted — MRIS
- 2002-01-08 Listed — MRIS
Property tax history
-9.8%/yrLatest (2024): $94 · -5.7% YoY. Source: county tax records.
Cash-flow waterfall
monthlySold comps — $/sqft
last 12 mo · ≤1 miLoading sold comps…