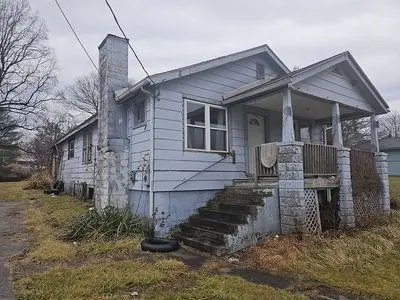
115 Victory St · Oak Hill, WV
Flood risk 1/10 · Minimal
- FEMA flood zone
- X (unshaded)
- Chance of flooding over 30 yrs
- 0.0%
- Est. flood insurance / yr
- $473 – $860
Fire risk 5/10 · Moderate
- Est. fire insurance / yr
- $787 – $1,461
Heat risk 3/10 · Minor
- Hot days now (above 95°F)
- 7 days/yr
- Hot days in 30 yrs
- 20 days/yr
Wind risk 1/10 · Minimal
- Chance of severe wind over 30 yrs
- —
Air-quality risk 1/10 · Minimal
- Unhealthy air days now
- 0 days/yr
- Unhealthy air days in 30 yrs
- 0 days/yr
Risk factors via First Street. Map © Google.
Why this score? — see what drove the B- grade
The composite is a weighted blend of 9 inputs, each scored 0–100. Each bar is that input's sub-score; the figure is the points it added to the 100-point composite (weight × sub-score).
- Cash flow +30.0/30.0
- 1% rule +10.0/10.0
- DSCR +10.0/10.0
- ARV discount +7.5/15.0
- Livability +3.1/5.0
- Rent growth +2.5/5.0
- Condition / age +2.5/5.0
- Schools +2.0/10.0
- Appreciation +0.0/10.0
$35,000
🖨 Deal sheet (PDF) 📄 Offer letter ✓ Due diligence
Listing remarks
3 bed 1 bath home This home is in need of extensive repair! Would be a great flip or rental home. Right behind advance autoparts in oak Hill, very close to everything! Nice neighborhood Has a nice backyard and nice paved driveway! Asking $35,000 obo! Can do rent to own with $5,000 down! The address is 115 victory Street oak Hill wv
Key facts
- Backyard
- Paved driveway
- Nice neighborhood
Tags
Neighborhood map
What this means for you Summary
Snapshot
- This is a 3-bed/1.0-bath single-family listed at $35k.
Deal economics
- At list price, monthly cash flow is $584 ($7k/yr) — positive.
- The deal already cash-flows at list — no discount required.
- Meets the 1% rule at list price ($1k rent vs $35k).
- Recommended offer: $34k (1.5% below list) — sets the bar for market timing.
Location & tenants
- Location reads 62/100 on livability (#181 in WV) — a middle-class / working-renter tenant base. Strengths: cost of living A+, housing A+, crime B; Watch: amenities F, commute F, employment F.
- Fayette County Schools (suburban): math 17% / reading 31% proficiency, ranked #51 of 55 in WV (top 93%) — low school quality limits family demand, transient renter base, plan for 1-2y turnover.
- Zoned schools: Oak Hill Middle School (math 14% / reading 26%, grade F, #104 of 109 statewide, top 96%, 656 students, 0% FRL) — zoned schools average 0% FRL vs 54% district-wide (54 pts lower); this property's tenant base skews higher-income than the district average.
- Market conditions: 18 active listings in the ZIP; 26 units permitted in Fayette County in 2024 (0 in 5+ unit buildings).
Forward outlook
- Local home prices are declining (-3.0%/yr); year-one equity from $242 of loan paydown is wiped out by about $1k of value loss. Plan a longer hold.
- Fayette County population projected at -23% by 2050 — secular population decline; favor cash flow + early exit over multi-decade hold.
- At projected returns (-3.0% appreciation + 3.0% rent growth), your $10k cash investment doubles in ~2 years — after that, you're playing with house money.
Negotiation context
- It's been on market 15 days — a 2% lower offer ($34k) is reasonable based on typical stale-listing flexibility.
Risks & watch-outs
- Watch-outs: built in 1940 — expect roof / HVAC / electrical / plumbing capex.
- Climate carrying-cost: moderate wildfire risk — expect insurance premiums to compound above CPI over the hold.
Questions for the listing agent
- Built in 1940 — when were the roof, HVAC, electrical panel, plumbing, and water heater last replaced?
- Is there a deadline driving the sale (1031 exchange, divorce, estate, relocation)? That informs how much negotiation room exists.
- Schools are A-rated — typically a magnet for longer-tenancy family renters. What's the average tenant stay here, and is there a school-zone premium baked into asking?
- What's the average days-on-market for RENTAL listings here right now (not sales)? A rising rental-DOM trend means longer vacancies and softer asking-rent achievability than the comps imply.
- What's the recent tenant-quality profile in this submarket — average credit score on applications, eviction rate, late-payment / NSF rate, and stable-employment percentage? A property-management company in the area should have these aggregated.
- How much new for-sale + rental construction is in the pipeline within 1–3 miles? Heavy new supply typically softens prices + rents 12–24 months out; constrained supply supports both.
Investment metrics
- 1% rule
- 2.96% ✓
- Cap rate
- 26.33%
- Cash-on-cash
- 71.56%
- DSCR
- 4.18
- GRM
- 2.8
CMA / ARV
- ARV (on-the-fly)
- $149,460
- Comps found
- 12
Show comp detail 12 sales within ~0.75 mi
| Address | Dist | Beds/Ba | Sqft | Sold | Price | $/sf | Match |
|---|---|---|---|---|---|---|---|
| 226 Ridgewood Ave | 0.32mi | 3/1.0 | 1,014 (-4%) | 2mo | $125,000 | $123 | 76 |
| 503 Hidden Valley Dr | 0.42mi | 3/1.0 | 1,040 (-2%) | 11mo | $95,000 | $91 | 69 |
| 229 Center St | 0.47mi | 3/1.0 | 1,016 (-4%) | 8mo | $175,000 | $172 | 65 |
| 225 Ridgewood Ave | 0.31mi | 2/2.0 (-1) | 1,064 (+0%) | 17mo | $190,000 | $179 | 62 |
| 112 Butler St | 0.65mi | 3/1.5 | 1,078 (+2%) | 4mo | $75,000 | $70 | 62 |
| 6 Coleman Cir | 0.67mi | 3/1.0 | 1,000 (-6%) | 1mo | $169,000 | $169 | 59 |
| 110 Huff St | 0.69mi | 3/1.0 | 1,060 (0%) | 19mo | $47,000 | $44 | 52 |
| 203 Highlawn Park Ave | 0.47mi | 2/1.0 (-1) | 960 (-9%) | 11mo | $135,000 | $141 | 48 |
| 601 25th St | 0.44mi | 2/2.0 (-1) | 1,104 (+4%) | 22mo | $220,000 | $199 | 46 |
| 1018 Elizabeth St | 0.53mi | 3/2.0 | 1,152 (+9%) | 18mo | $162,000 | $141 | 42 |
| 233 W Martin Ave | 0.70mi | 3/1.5 | 1,120 (+6%) | 20mo | $170,000 | $152 | 39 |
| 101 White St | 0.73mi | 2/2.0 (-1) | 1,024 (-3%) | 20mo | $50,000 | $49 | 35 |
Match score weights: distance 35% · size 25% · config 20% · recency 20%. Top-matched comps best support the ARV.
Projected returns pro-forma
-3.0% appreciation · 3.0% rent growth · sell at horizon
- IRR
- 71.2%
- Equity multiple
- 4.22×
- Total profit
- $31,560
- Equity at exit
- $5,219
- IRR
- 75.2%
- Equity multiple
- 8.70×
- Total profit
- $75,451
- Equity at exit
- $3,026
Cash invested: $9,800 (down + closing). Projections, not guarantees.
Landlord ↔ Tenant lean methodology
- Overall (STATE)
- 83 Strongly Landlord-Friendly
- State West Virginia
- 83 Strongly Landlord-Friendly · R+22
- County
- — inherits STATE
- City
- — inherits STATE
ZIP-level market 25901
- Home prices YoY
- -16.7%
- Active inventory
- 18
- Price-to-rent
- 2.8×
Monthly cashflow live
- Estimated rent
- $1,035 medium interval (Pro) →
- Mortgage (P&I)
- −$184
- Tax from tax record
- −$35 /mo · $419/yr
- Insurance
- −$15
- HOA
- −$0
- Vacancy / Maint / Mgmt
- −$217
- Net cashflow
- $584
Break-even live
Sensitivity live
| Price | -10% $604 | -5% $594 | +0% $584 | +5% $574 | +10% $565 |
|---|---|---|---|---|---|
| Rent | -10% $503 | -5% $544 | +0% $584 | +5% $625 | +10% $666 |
| Rate | -1.0pp $602 | -0.5pp $593 | base $584 | +0.5pp $575 | +1.0pp $566 |
UW: 25.0% down · 7.5% · 30yr · 1.5% tax · 5.0% vac · 8.0% maint · 8.0% mgmt
Financing live
Cash to close
- Down payment
- $8,750
- Closing costs
- $1,050
- Reserves months
- —
- Total cash needed
- —
Loan-product check · same deal, 3 products live
Conventional
25% down · 7.5% · 30yr
- Down + closing
- —
- Monthly P&I
- —
- Monthly cashflow
- —
- DSCR
- —
- Eligible?
- —
Personal DTI + credit; lowest rate.
DSCR
20% down · 8.5% · 30yr
- Down + closing
- —
- Monthly P&I
- —
- Monthly cashflow
- —
- DSCR
- —
- Eligible?
- —
No personal income docs; deal must DSCR.
Hard money
10% down · 12.0% · 12mo
- Down + closing
- —
- Monthly P&I
- —
- Monthly cashflow
- —
- DSCR
- —
- Eligible?
- —
Short-term bridge; refi at stabilization.
Listing history 1 events
-
2026-05-12$35,000 Active
ⓘ Source: listings_history table (triggers on properties + properties_extension) + one-shot
backfill from property_details.listing_events for pre-trigger history.
Tax reassessment forecast WV · Resets to sale price
- Current annual tax
- $419 · $35/mo
- Projected year-2 tax
- $419 · $35/mo
- Expected delta
- $0/yr ($0/mo · 0.0%)
ⓘ Screening estimate from a state-policy table — verify with the county assessor before closing.
Climate risk First Street
- Flood 1/10 Low FEMA zone X (unshaded) · 0% chance over 30 yrs
- Wildfire 5/10 Major
- Heat 3/10 Moderate 7 d/yr ≥95°F today · 20 d/yr by 30 yrs out
- Wind 1/10 Low
- Air quality 1/10 Low 0 unhealthy d/yr today · 0 by 30 yrs out
Nearby sold comps map
Loading sold comps map…
Walkable amenities ~0.75 mi
Loading nearby amenities…
Taxation est. · year 1
- Rental income
- $12,417
- − Mortgage interest
- −$1,961
- − Property taxes
- −$419
- − Insurance
- −$175
- − Repairs & maintenance
- −$993
- − Management
- −$993
- − Depreciation
- −$1,018
- Taxable income
- $6,858
- Est. tax owed @ 24.0%
- −$1,646
- After-tax cash flow
- $5,367/yr
For passive investors: Depreciation is non-cash, so a rental often shows a tax loss while cash-flowing — sheltering income. Rental losses are passive: they offset passive income freely, and up to $25,000/yr can offset ordinary (W-2) income if you actively participate and your MAGI is under $100k (phasing out to $0 by $150k); unused losses carry forward. On sale, claimed depreciation is recaptured at up to 25%, and gains may owe capital-gains tax (a 1031 exchange can defer both). Figures are a year-1 estimate at your 24.0% rate — not tax advice; consult a CPA.
Schools (NCES district)
- District
- Fayette County Schools
- NCES district ID
- 5400300
- Math proficiency
- 17% ▼ -12.00%
- Reading proficiency
- 31% ▼ -4.00%
- Median HH income
- $35,293
- Composite
- 19.77/100
- National rank
- #8706
- State rank
- #51 of 55 in WV
Livability — Oak Hill
- Score
- 62/100
- State rank
- #181
- US rank
- #16601
Category grades
Schools grade is shown separately in the Schools card above.
Census & demographics
- Census place
- Oak Hill, WV
- City population
- 260
- Population (ZIP)
- 10,225
Population outlook (Fayette County) Hauer SSP2
- Today (2025)
- 41,745 people
- By 2030
- 39,758 · -4.8%
- By 2040
- 35,751 · -14.4%
- By 2050
- 32,223 · -22.8%
- By 2075
- 24,307 · -41.8%
- By 2100
- 16,671 · -60.1%
Race, ethnicity, and origin ACS 2023
- Neighborhood character
- Predominantly White (90%)
- Race & ethnicity
- White 90% Black 6% Two or more races 2% Hispanic / Latino 1%
- Common ancestry
- Serbian 4% Slovak 3% Italian 2%
- Foreign-born
- 1%
Political lean MEDSL · Fayette
- 2024 margin
- Solid R (+41.8) · D 28.1% · R 69.8% · Other 2.1%
- 2008→2024 swing
- -39.0pp toward R · 2008: -2.7pp · 2024: -41.8pp
- All cycles
- 2024: R+41.8 2020: R+38.6 2016: R+39.6 2012: R+21.0 2008: R+2.7
Not yet ingested
- Civics
- —
Market trends
- HPI YoY
- ▼ -38.08%
- Current HPI
- 190.177
- Rent YoY
- —
- Metro
- —
- State GDP YoY
- —
- F500 in state
- 0
Price history
1 event — show timeline
- 2026-05-12 Listed $35,000 FSBO.com
Property tax history
+2.5%/yrLatest (2025): $419 · +6.1% YoY. Source: county tax records.
Cash-flow waterfall
monthlySold comps — $/sqft
last 12 mo · ≤1 miLoading sold comps…