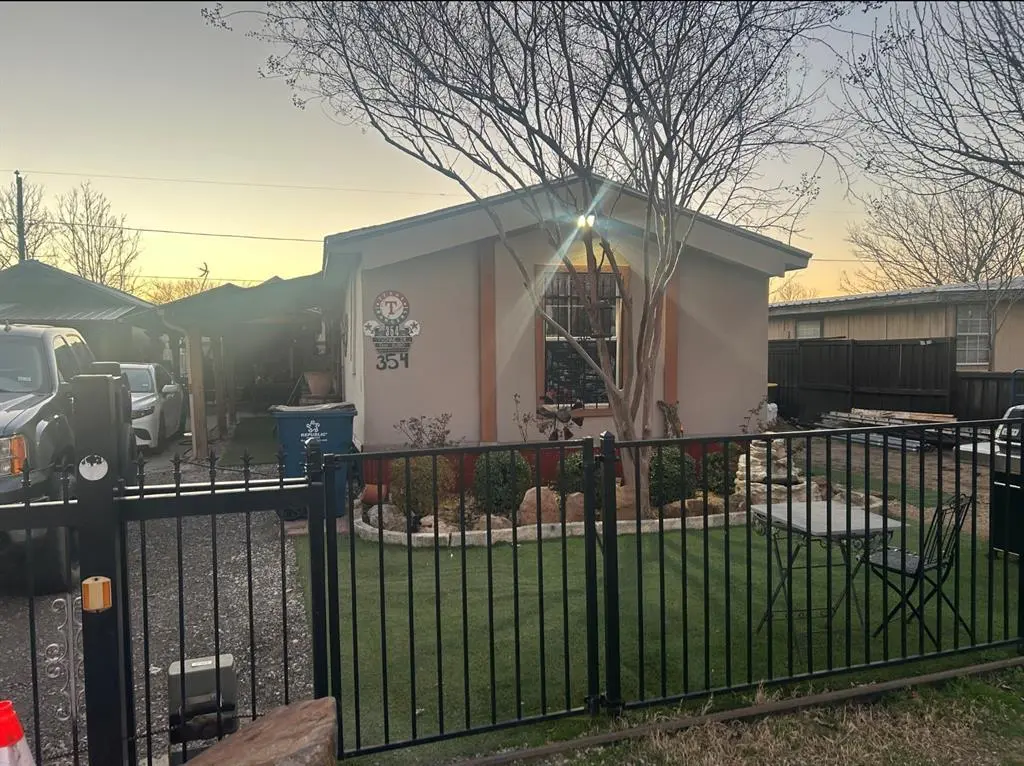
354 Yvonne Dr · Rockwall, TX
Flood risk 1/10 · Minimal
- FEMA flood zone
- X (unshaded)
- Chance of flooding over 30 yrs
- 0.0%
- Est. flood insurance / yr
- $507 – $1,088
Fire risk 5/10 · Moderate
- Est. fire insurance / yr
- $1,222 – $2,270
Heat risk 7/10 · Major
- Hot days now (above 109°F)
- 7 days/yr
- Hot days in 30 yrs
- 24 days/yr
Wind risk 6/10 · Moderate
- Chance of severe wind over 30 yrs
- 27.0%
Air-quality risk 2/10 · Minimal
- Unhealthy air days now
- 1 days/yr
- Unhealthy air days in 30 yrs
- 2 days/yr
Risk factors via First Street. Map © Google.
Why this score? — see what drove the B- grade
The composite is a weighted blend of 9 inputs, each scored 0–100. Each bar is that input's sub-score; the figure is the points it added to the 100-point composite (weight × sub-score).
- Cash flow +29.3/30.0
- DSCR +10.0/10.0
- 1% rule +7.7/10.0
- ARV discount +7.5/15.0
- Schools +5.0/10.0
- Livability +3.9/5.0
- Rent growth +2.9/5.0
- Condition / age +2.5/5.0
- Appreciation +0.0/10.0
$165,900
🖨 Deal sheet 📄 Offer letter ✓ Due diligence
Listing remarks MLS
Location, Location! 3 bedroom, 2-bathroom home offers spacious carport and a small barn, this property provides plenty of room for storage, hobbies, or additional workspace. Situated just minutes from shopping centers, grocery stores, and a variety of restaurants. Enjoy walks by Lake Ray Hubbard nearby, offering amazing views. Don’t miss out on this wonderful home in an unbeatable location! You’ll also appreciate being just minutes from Dallas, Richardson, Rowlett, Royse City, Caddo Mills, Garland, and Mesquite. As well as other communities throughout Collin County, Rockwall County, Dallas County, and Kaufman County. Buyer to verify accuracy of all information including room & lot sizes, schools, taxes, amenities, etc. Neither Seller nor LA makes any warranties or representation as to accuracy.
Key facts
- Room for storage
- Small barn
- Spacious carport
Tags
Neighborhood map
What this means for you Summary
Snapshot
- This is a 3-bed/2.0-bath land listed at $166k.
Deal economics
- At list price, monthly cash flow is $581 ($7k/yr) — positive.
- The deal already cash-flows at list — no discount required.
- Meets the 1% rule at list price ($2k rent vs $166k).
- Recommended offer: $151k (9.0% below list) — sets the bar for market timing.
- Cap rate 10.5% vs local median 2.9% in Rockwall — top-decile yield for the area; either an underpriced asset or a hidden risk that comps aren't pricing in. Stress-test before assuming the spread holds.
Location & tenants
- Location reads 77/100 on livability (#86 in TX, #3,043 nationally) — a middle-class / working-renter tenant base. Strengths: employment A+, housing A+, crime A-; Watch: amenities F, commute F.
- Rockwall ISD (suburban): math 54% / reading 54% proficiency, ranked #83 of 826 in TX (top 10%) — acceptable for families but not a draw, mixed tenant base, ~2y average lease.
- Market conditions: Rents rising (+1.5%/yr); 966 active listings in the ZIP; 16 comparable units currently listed for rent nearby; rentals at typical pace (median 20d on market — plan ~3-4 weeks tenant-placement turnaround); high-income renter base; 1,810 units permitted in Rockwall County in 2024 (0 in 5+ unit buildings).
Forward outlook
- Local home prices are declining (-3.0%/yr); year-one equity from $1k of loan paydown is wiped out by about $5k of value loss. Plan a longer hold.
- Rockwall County population projected at +56% by 2050 — long-run rental-demand tailwind backs the buy-and-hold thesis.
- At projected returns (-3.0% appreciation + 1.5% rent growth), your $46k cash investment doubles in ~10 years — after that, you're playing with house money.
Negotiation context
- It's been on market 98 days — a 9% lower offer ($151k) is reasonable based on typical stale-listing flexibility.
Risks & watch-outs
- Climate carrying-cost: major wind risk, 27% chance of damaging wind over 30y; moderate wildfire risk; extreme-heat days projected 7→24/yr by 2055 (HVAC capex compounding) — expect insurance premiums to compound above CPI over the hold.
Questions for the listing agent
- It's been on market 98 days. Have you received any prior offers? Is the seller open to a 9% concession, seller financing, or rate buy-down credit?
- Why hasn't it sold? Are there any deal-killer items the seller is aware of (foundation, flood, title, zoning, code violations)?
- Is there a deadline driving the sale (1031 exchange, divorce, estate, relocation)? That informs how much negotiation room exists.
- Schools are B-rated — typically a magnet for longer-tenancy family renters. What's the average tenant stay here, and is there a school-zone premium baked into asking?
- What's the average days-on-market for RENTAL listings here right now (not sales)? A rising rental-DOM trend means longer vacancies and softer asking-rent achievability than the comps imply.
- What's the recent tenant-quality profile in this submarket — average credit score on applications, eviction rate, late-payment / NSF rate, and stable-employment percentage? A property-management company in the area should have these aggregated.
- How much new for-sale + rental construction is in the pipeline within 1–3 miles? Heavy new supply typically softens prices + rents 12–24 months out; constrained supply supports both.
Investment metrics
- 1% rule
- 1.27% ✓
- Cap rate
- 10.50%
- Cash-on-cash
- 15.01%
- DSCR
- 1.67
- GRM
- 6.6
CMA / ARV
No comps found within radius.
Projected returns pro-forma
-3.0% appreciation · 1.47% rent growth · sell at horizon
- IRR
- 3.9%
- Equity multiple
- 1.15×
- Total profit
- $6,916
- Equity at exit
- $24,736
- IRR
- 12.0%
- Equity multiple
- 1.88×
- Total profit
- $40,926
- Equity at exit
- $14,344
Cash invested: $46,452 (down + closing). Projections, not guarantees.
Landlord ↔ Tenant lean methodology
- Overall (STATE)
- 87 Strongly Landlord-Friendly
- State Texas
- 87 Strongly Landlord-Friendly · R+5
- County
- — inherits STATE
- City
- — inherits STATE
ZIP-level market 75032
- Home prices YoY
- -22.9%
- Rents YoY
- 1.5%
- Active inventory
- 966
- Price-to-rent
- 6.6×
Monthly cashflow live
- Estimated rent
- $2,107 high interval (Pro) →
- Mortgage (P&I)
- −$870
- Tax from tax record
- −$144 /mo · $1,733/yr
- Insurance
- −$69
- HOA
- −$0
- Vacancy / Maint / Mgmt
- −$442
- Net cashflow
- $581
Break-even live
UW: 25.0% down · 7.5% · 30yr · 1.5% tax · 5.0% vac · 8.0% maint · 8.0% mgmt
Financing live
Cash to close
- Down payment
- $41,475
- Closing costs
- $4,977
- Reserves months
- —
- Total cash needed
- —
Loan-product check · same deal, 3 products live
Conventional
25% down · 7.5% · 30yr
- Down + closing
- —
- Monthly P&I
- —
- Monthly cashflow
- —
- DSCR
- —
- Eligible?
- —
Personal DTI + credit; lowest rate.
DSCR
20% down · 8.5% · 30yr
- Down + closing
- —
- Monthly P&I
- —
- Monthly cashflow
- —
- DSCR
- —
- Eligible?
- —
No personal income docs; deal must DSCR.
Hard money
10% down · 12.0% · 12mo
- Down + closing
- —
- Monthly P&I
- —
- Monthly cashflow
- —
- DSCR
- —
- Eligible?
- —
Short-term bridge; refi at stabilization.
Rent comps 16 comps
| Address | Beds | Baths | Sqft | Rent | $/sqft | DOM | Units | Dist |
|---|---|---|---|---|---|---|---|---|
| 552 Trout St Rockwall, TX | 3.0 | 2.0 | 1415 | $2,195 | $1.55 | 7d | 1 | 0.51mi |
| 552 Trout St Rockwall, TX | 3.0 | 2.0 | 1415 | $2,195 | $1.55 | 17d | 1 | 0.51mi |
| 185 Trout St Rockwall, TX | 3.0 | 2.0 | 1229 | $1,619 | $1.32 | 16d | 1 | 0.66mi |
| 140 Trout St Rockwall, TX | 3.0 | 2.0 | 1480 | $1,950 | $1.32 | 22d | 1 | 0.69mi |
| 112 Walnut Ln Rockwall, TX | 3.0 | 2.0 | 1491 | $1,895 | $1.27 | 16d | 1 | 0.73mi |
| 152 Pinion Ln Rockwall, TX | 3.0 | 2.0 | 1349 | $1,950 | $1.45 | 7d | 1 | 0.82mi |
| 109 Brockway Dr Rockwall, TX | 3.0 | 2.0 | 1286 | $1,950 | $1.52 | 24d | 1 | 0.87mi |
| 133 Brockway Dr Rockwall, TX | 3.0 | 2.0 | 1358 | $1,799 | $1.32 | 43d | 1 | 0.88mi |
| 149 Brockway Dr Rockwall, TX | 3.0 | 2.0 | 1358 | $2,100 | $1.55 | 43d | 1 | 0.97mi |
| 128 Overbrook Dr Rockwall, TX | 3.0 | 2.0 | 1368 | $3,000 | $2.19 | 2d | 1 | 0.98mi |
| 202 Mapleridge Dr Rockwall, TX | 3.0 | 2.0 | 1156 | $1,965 | $1.70 | 5d | 1 | 0.98mi |
| 151 Brockway Dr Rockwall, TX | 3.0 | 2.0 | 1274 | $1,949 | $1.53 | 43d | 1 | 0.98mi |
| 2825 Beverly Dr Rockwall, TX | 3.0 | 2.0 | 1379 | $1,985 | $1.44 | 43d | 1 | 1.07mi |
| 336 Cresthaven Dr Rockwall, TX | 3.0 | 2.0 | 1233 | $1,950 | $1.58 | 5d | 1 | 1.13mi |
| 1452 Hickory Creek Ln Rockwall, TX | 3.0 | 2.0 | 1498 | $1,995 | $1.33 | 24d | 1 | 1.29mi |
| 1476 Hickory Creek Ln Rockwall, TX | 3.0 | 2.0 | 1498 | $1,855 | $1.24 | 19d | 1 | 1.33mi |
Listing history 4 events
-
2026-06-01days on market $165,900 Active 98 DOM
-
2026-05-31days on market $165,900 Active 97 DOM
-
2026-02-24price $165,900 821-char remark
Show marketing remark (821 chars)
Location, Location! 3 bedroom, 2-bathroom home offers spacious carport and a small barn, this property provides plenty of room for storage, hobbies, or additional workspace. Situated just minutes from shopping centers, grocery stores, and a variety of restaurants. Enjoy walks by Lake Ray Hubbard nearby, offering amazing views. Don’t miss out on this wonderful home in an unbeatable location! You’ll also appreciate being just minutes from Dallas, Richardson, Rowlett, Royse City, Caddo Mills, Garland, and Mesquite. As well as other communities throughout Collin County, Rockwall County, Dallas County, and Kaufman County. Buyer to verify accuracy of all information including room & lot sizes, schools, taxes, amenities, etc. Neither Seller nor LA makes any warranties or representation as to accuracy.
-
2026-02-23$16,590 Active 821-char remark
Show marketing remark (821 chars)
Location, Location! 3 bedroom, 2-bathroom home offers spacious carport and a small barn, this property provides plenty of room for storage, hobbies, or additional workspace. Situated just minutes from shopping centers, grocery stores, and a variety of restaurants. Enjoy walks by Lake Ray Hubbard nearby, offering amazing views. Don’t miss out on this wonderful home in an unbeatable location! You’ll also appreciate being just minutes from Dallas, Richardson, Rowlett, Royse City, Caddo Mills, Garland, and Mesquite. As well as other communities throughout Collin County, Rockwall County, Dallas County, and Kaufman County. Buyer to verify accuracy of all information including room & lot sizes, schools, taxes, amenities, etc. Neither Seller nor LA makes any warranties or representation as to accuracy.
ⓘ Source: listings_history table (triggers on properties + properties_extension) + one-shot
backfill from property_details.listing_events for pre-trigger history.
Tax reassessment forecast TX · Resets to sale price
- Current annual tax
- $1,733 · $144/mo
- Projected year-2 tax
- $3,036 · $253/mo
- Expected delta
- +$1,303/yr (+$109/mo · 75.2%)
ⓘ Screening estimate from a state-policy table — verify with the county assessor before closing.
Climate risk First Street
- Flood 1/10 Low FEMA zone X (unshaded) · 0% chance over 30 yrs
- Wildfire 5/10 Major
- Heat 7/10 Severe 7 d/yr ≥109°F today · 24 d/yr by 30 yrs out
- Wind 6/10 Major 27% chance of damaging wind over 30 yrs
- Air quality 2/10 Low 1 unhealthy d/yr today · 2 by 30 yrs out
Nearby sold comps map
Loading sold comps map…
Walkable amenities ~0.75 mi
Loading nearby amenities…
Taxation est. · year 1
- Rental income
- $25,283
- − Mortgage interest
- −$9,293
- − Property taxes
- −$1,733
- − Insurance
- −$830
- − Repairs & maintenance
- −$2,023
- − Management
- −$2,023
- − Depreciation
- −$4,826
- Taxable income
- $4,556
- Est. tax owed @ 24.0%
- −$1,094
- After-tax cash flow
- $5,878/yr
For passive investors: Depreciation is non-cash, so a rental often shows a tax loss while cash-flowing — sheltering income. Rental losses are passive: they offset passive income freely, and up to $25,000/yr can offset ordinary (W-2) income if you actively participate and your MAGI is under $100k (phasing out to $0 by $150k); unused losses carry forward. On sale, claimed depreciation is recaptured at up to 25%, and gains may owe capital-gains tax (a 1031 exchange can defer both). Figures are a year-1 estimate at your 24.0% rate — not tax advice; consult a CPA.
Schools (NCES district)
- District
- Rockwall ISD
- NCES district ID
- 4837650
- Math proficiency
- 54% ▼ -13.00%
- Reading proficiency
- 54% ▼ -8.00%
- Median HH income
- $88,800
- Composite
- 49.82/100
- National rank
- #1952
- State rank
- #83 of 826 in TX
Livability — Rockwall
- Score
- 77/100
- State rank
- #86
- US rank
- #3043
Category grades
Schools grade is shown separately in the Schools card above.
Census & demographics
- Census place
- Rockwall, TX
- County
- Rockwall County · 132,930 people
- City population
- 84,191
- Metro
- Dallas-Fort Worth-Arlington, TX
- Population (ZIP)
- 39,865
- Household income
- $135,742
- Rent vs Own
- Severe rent burden
- 636.0
Population outlook (Rockwall County) Hauer SSP2
- Today (2025)
- 118,396 people
- By 2030
- 132,209 · +11.7%
- By 2040
- 159,538 · +34.7%
- By 2050
- 185,299 · +56.5%
- By 2075
- 243,489 · +105.7%
- By 2100
- 277,814 · +134.6%
Race, ethnicity, and origin ACS 2023
- Neighborhood character
- Predominantly White (67%)
- Race & ethnicity
- White 67% Hispanic / Latino 17% Two or more races 9% Black 9% Asian 3%
- Hispanic origin (detail)
- Mexican 11% Puerto Rican 1%
- Common ancestry
- Slovak 3% Lithuanian 2% Italian 2%
- Foreign-born
- 10% · Canada
- Languages at home
- 84% English-only · Spanish 10% Other Indo-European 2% Arabic 1%
Political lean MEDSL · Rockwall
- 2024 margin
- Solid R (+40.9) · D 29.1% · R 70.0%
- 2008→2024 swing
- +5.3pp toward D · 2008: -46.2pp · 2024: -40.9pp
- All cycles
- 2024: R+40.9 2020: R+37.7 2016: R+47.5 2012: R+53.3 2008: R+46.2
Not yet ingested
- Civics
- —
Market trends
- HPI YoY
- ▼ -61.97%
- Current HPI
- 209.0229
- Rent YoY
- ▲ 1.47%
- Metro
- Dallas-Fort Worth-Arlington, TX
- State GDP YoY
- ▲ 3.95%
- F500 in state
- 110
Industry mix (Fortune 500 HQ in TX)
| Industry | F500 HQs | Revenue |
|---|---|---|
| Energy | 16 | $1,198B |
|
||
| Technology | 5 | $198B |
|
||
| Engineering / Construction | 4 | $72B |
|
||
| Energy Services | 3 | $60B |
|
||
| Utilities | 3 | $41B |
|
||
| Healthcare | 2 | $330B |
|
||
Price history
+900.0% since first listed2 events — show timeline
- 2026-02-24 Price Changed $165,900 NTREIS
- 2026-02-23 Listed $16,590 NTREIS
Property tax history
+17.4%/yrLatest (2025): $1,733 · -4.5% YoY. Source: county tax records.
Cash-flow waterfall
monthlySold comps — $/sqft
last 12 mo · ≤1 miLoading sold comps…