 Fourplex
5625 Massachusetts St · Merrillville, IN
Flood risk 1/10 · Minimal
- FEMA flood zone
- X (unshaded)
- Chance of flooding over 30 yrs
- 0.0%
- Est. flood insurance / yr
- $507 – $1,088
Fire risk 2/10 · Minimal
- Est. fire insurance / yr
- $717 – $1,331
Heat risk 2/10 · Minimal
- Hot days now (above 101°F)
- 7 days/yr
- Hot days in 30 yrs
- 15 days/yr
Wind risk 2/10 · Minimal
- Chance of severe wind over 30 yrs
- 0.0%
Air-quality risk 3/10 · Minor
- Unhealthy air days now
- 2 days/yr
- Unhealthy air days in 30 yrs
- 3 days/yr
Risk factors via First Street. Map © Google.
Why this score? — see what drove the B- grade
The composite is a weighted blend of 9 inputs, each scored 0–100. Each bar is that input's sub-score; the figure is the points it added to the 100-point composite (weight × sub-score).
- Cash flow +27.8/30.0
- DSCR +9.8/10.0
- ARV discount +7.4/15.0
- 1% rule +7.2/10.0
- Livability +3.8/5.0
- Condition / age +3.8/5.0
- Rent growth +3.5/5.0
- Schools +2.6/10.0
- Appreciation +0.0/10.0
$434,900
🖨 Deal sheet 📄 Offer letter ✓ Due diligence
Multi-family units
County records classify this as Multi-Family (2-4 Unit). Listing-text estimate: 4 units. confirmed
Listing remarks
Great opportunity to own a 4 unit building in Merrillville. Property is close to Broadway. Property recently updated with new paint and flooring and is ready for tenants. Property has 3 x's 2 bedroom units and 1 x's 1 bedroom unit. Gas and electric are separated already. Property has been maintained.
Key facts
- Maintained
- New flooring
- New paint
Tags
Property features AI
Exterior
- Parking: Four total parking spaces; Driveway parking and additional parking available
- Utilities: Public water; Public sewer
- Home design: Two-story building; Built in 1969
- Construction: Asphalt roof
- Exterior features: Neighborhood view; Shed(s) on property; No pool
Interior
- Kitchen: Eat-in kitchen (appliances listed as Other)
- Bedrooms: Property contains four units: one 1-bedroom unit and three 2-bedroom units
- Flooring: Laminate flooring
- Bathrooms: Four full bathrooms (total across units)
- Heating & cooling: Central air and other cooling; Natural gas heating; Forced air; Baseboard heating; Individual unit controls
- Interior features: Ceiling fans; Eat-in kitchen; Entrance foyer; Pets allowed
- Laundry & utility: Laundry in lower level
Neighborhood map
What this means for you Summary
Snapshot
- This is a 3×2bd/1ba + 1×1bd/1ba units multifamily listed at $435k. Condition is rated good.
Deal economics
- At list price, monthly cash flow is $1k ($16k/yr) — positive. Per door: $331/mo.
- The deal already cash-flows at list — no discount required.
- Meets the 1% rule at list price ($5k rent vs $435k).
- Cap rate 9.9% vs local median 4.7% in Merrillville — top-decile yield for the area; either an underpriced asset or a hidden risk that comps aren't pricing in. Stress-test before assuming the spread holds.
Location & tenants
- Location reads 76/100 on livability (#50 in IN, #3,393 nationally) — a middle-class / working-renter tenant base. Strengths: commute A+, cost of living A+, housing A+; Watch: schools D+, amenities F, health & safety D-.
- Merrillville Community School Corporation (suburban): math 22% / reading 36% proficiency, ranked #240 of 301 in IN (top 80%) — low school quality limits family demand, transient renter base, plan for 1-2y turnover.
- Market conditions: Rents rising fast (+4.1%/yr); 264 active listings in the ZIP; 1,642 units permitted in Lake County in 2024 (14 in 5+ unit buildings).
- At $5,293/mo this rent would consume 99% of the median local household income ($64k/yr) (locally 1644% of renters already pay >50% of income on rent) — very limited rent-growth headroom before tenants either downsize or default.
Forward outlook
- Local home prices are declining (-3.0%/yr); year-one equity from $3k of loan paydown is wiped out by about $13k of value loss. Plan a longer hold.
- Lake County population projected to shrink 7% by 2050 — rents likely to lag national; underwrite the cash flow, not the appreciation.
- At projected returns (-3.0% appreciation + 4.1% rent growth), your $122k cash investment doubles in ~8 years — after that, you're playing with house money.
Negotiation context
- Only 7 days on market — expect competitive offers; lowballing is unlikely to land.
Questions for the listing agent
- Can we see the unit-by-unit rent roll, current vacancy, and any below-market leases? What's the average tenancy length?
- What capital expenditures (roof, boiler, parking lot, exteriors) have been made in the last 5 years, and what's planned in the next 2?
- Built in 1969 — when were the roof, HVAC, electrical panel, plumbing, and water heater last replaced?
- Is there a deadline driving the sale (1031 exchange, divorce, estate, relocation)? That informs how much negotiation room exists.
- Schools are D-rated, which usually means shorter tenancies and higher turnover. Who's the typical renter profile here, and what's been the actual vacancy rate?
- What's the average days-on-market for RENTAL listings here right now (not sales)? A rising rental-DOM trend means longer vacancies and softer asking-rent achievability than the comps imply.
- What's the recent tenant-quality profile in this submarket — average credit score on applications, eviction rate, late-payment / NSF rate, and stable-employment percentage? A property-management company in the area should have these aggregated.
- How much new apartment / multifamily construction is in the pipeline within 1–3 miles? Heavy new supply (>2% of stock underway) typically softens rents 12–24 months out; light construction supports rent growth.
Investment metrics
- 1% rule
- 1.22% ✓
- Cap rate
- 9.94%
- Cash-on-cash
- 13.03%
- DSCR
- 1.58
- GRM
- 6.8
CMA / ARV
- ARV (on-the-fly)
- $434,000
- Comps found
- 2
Show comp detail 2 sales within ~0.75 mi
| Address | Dist | Beds/Ba | Sqft | Sold | Price | $/sf | Match |
|---|---|---|---|---|---|---|---|
| 5625 Massachusetts St | 0.00mi | 7/4.0 | 3,500 (0%) | 0mo | $435,000 | $124 | 100 |
| 5629 Massachusetts St | 0.02mi | 7/4.0 | 3,710 (+6%) | 7mo | $455,000 | $123 | 83 |
Match score weights: distance 35% · size 25% · config 20% · recency 20%. Top-matched comps best support the ARV.
Projected returns pro-forma
-3.0% appreciation · 4.1% rent growth · sell at horizon
- IRR
- 4.1%
- Equity multiple
- 1.16×
- Total profit
- $19,668
- Equity at exit
- $64,845
- IRR
- 14.6%
- Equity multiple
- 2.24×
- Total profit
- $150,396
- Equity at exit
- $37,602
Cash invested: $121,772 (down + closing). Projections, not guarantees.
Landlord ↔ Tenant lean methodology
- Overall (STATE)
- 90 Strongly Landlord-Friendly
- State Indiana
- 90 Strongly Landlord-Friendly · R+11
- County
- — inherits STATE
- City
- — inherits STATE
ZIP-level market 46410
- Rents YoY
- 4.1%
- Active inventory
- 264
- Price-to-rent
- 26.4×
Monthly cashflow live
- Estimated rent
- $5,293 high interval (Pro) →
- Mortgage (P&I)
- −$2,281
- Tax from tax record
- −$397 /mo · $4,766/yr
- Insurance
- −$181
- HOA
- −$0
- Vacancy / Maint / Mgmt
- −$1,112
- Net cashflow
- $1,322
Break-even live
4-unit breakdown (identical units grouped — click to expand)
| Units | Beds | Baths | Est. rent |
|---|---|---|---|
| 3× units | 2 | 1 | $4,116 |
| #1 | 2 | 1 | $1,372 |
| #2 | 2 | 1 | $1,372 |
| #3 | 2 | 1 | $1,372 |
| 1× unit | 1 | 1 | $1,176 |
| Total (4 units) | $5,293 | ||
UW: 25.0% down · 7.5% · 30yr · 1.5% tax · 5.0% vac · 8.0% maint · 8.0% mgmt
Financing live
Cash to close
- Down payment
- $108,725
- Closing costs
- $13,047
- Reserves months
- —
- Total cash needed
- —
Loan-product check · same deal, 3 products live
Conventional
25% down · 7.5% · 30yr
- Down + closing
- —
- Monthly P&I
- —
- Monthly cashflow
- —
- DSCR
- —
- Eligible?
- —
Personal DTI + credit; lowest rate.
DSCR
20% down · 8.5% · 30yr
- Down + closing
- —
- Monthly P&I
- —
- Monthly cashflow
- —
- DSCR
- —
- Eligible?
- —
No personal income docs; deal must DSCR.
Hard money
10% down · 12.0% · 12mo
- Down + closing
- —
- Monthly P&I
- —
- Monthly cashflow
- —
- DSCR
- —
- Eligible?
- —
Short-term bridge; refi at stabilization.
Listing history 2 events
-
2026-05-01status Pending
-
2026-04-23$434,900 Active
ⓘ Source: listings_history table (triggers on properties + properties_extension) + one-shot
backfill from property_details.listing_events for pre-trigger history.
Tax reassessment forecast IN · Partial reset (capped growth)
- Current annual tax
- $4,766 · $397/mo
- Projected year-2 tax
- $4,766 · $397/mo
- Expected delta
- $0/yr ($0/mo · 0.0%)
ⓘ Screening estimate from a state-policy table — verify with the county assessor before closing.
Climate risk First Street
- Flood 1/10 Low FEMA zone X (unshaded) · 0% chance over 30 yrs
- Wildfire 2/10 Low
- Heat 2/10 Low 7 d/yr ≥101°F today · 15 d/yr by 30 yrs out
- Wind 2/10 Low 0% chance of damaging wind over 30 yrs
- Air quality 3/10 Moderate 2 unhealthy d/yr today · 3 by 30 yrs out
Nearby sold comps map
Loading sold comps map…
Walkable amenities ~0.75 mi
Loading nearby amenities…
Taxation est. · year 1
- Rental income
- $63,516
- − Mortgage interest
- −$24,361
- − Property taxes
- −$4,766
- − Insurance
- −$2,174
- − Repairs & maintenance
- −$5,081
- − Management
- −$5,081
- − Depreciation
- −$12,652
- Taxable income
- $9,401
- Est. tax owed @ 24.0%
- −$2,256
- After-tax cash flow
- $13,614/yr
For passive investors: Depreciation is non-cash, so a rental often shows a tax loss while cash-flowing — sheltering income. Rental losses are passive: they offset passive income freely, and up to $25,000/yr can offset ordinary (W-2) income if you actively participate and your MAGI is under $100k (phasing out to $0 by $150k); unused losses carry forward. On sale, claimed depreciation is recaptured at up to 25%, and gains may owe capital-gains tax (a 1031 exchange can defer both). Figures are a year-1 estimate at your 24.0% rate — not tax advice; consult a CPA.
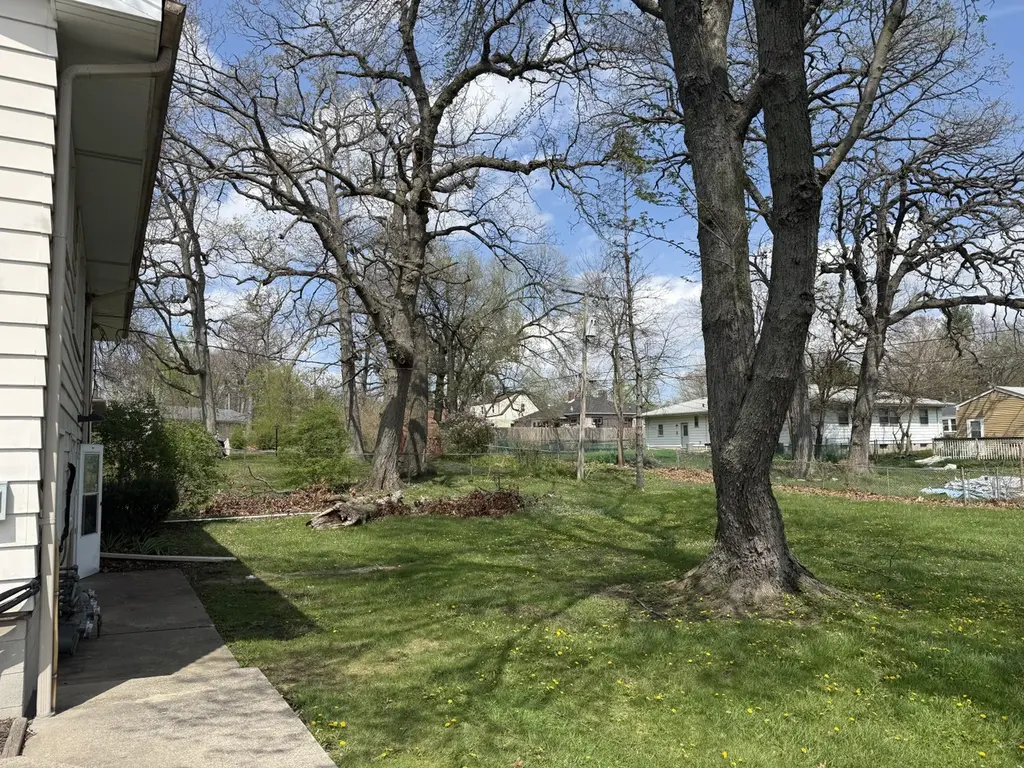
Condition & rehab AI · 6 photos
This 4-unit property is in good condition with recent updates and is ready for tenants. It has potential for further improvements to increase its value.
Value-add opportunities
- Both Paint the exterior siding — Painting the exterior siding can improve the curb appeal and increase the property's value.
- Both Replace the HVAC units — Replacing the HVAC units can improve the comfort and energy efficiency of the property, which can increase its value.
- Both Landscaping improvements — Improving the landscaping can enhance the curb appeal and increase the property's value.
- Both Replace the windows — Replacing the windows can improve the energy efficiency and increase the property's value.
- Both Replace the flooring — Replacing the flooring can improve the appearance and increase the property's value.
- Both Replace the interior walls/paint — Replacing the interior walls and paint can improve the appearance and increase the property's value.
Renovation cost estimate screening
Value-add ROI direction
- Both Paint the exterior siding — Painting the exterior siding can improve the curb appeal and increase the property's value. ↑
- Both Replace the HVAC units — Replacing the HVAC units can improve the comfort and energy efficiency of the property, which can increase its value. ↑
- Both Landscaping improvements — Improving the landscaping can enhance the curb appeal and increase the property's value. ↑
- Both Replace the windows — Replacing the windows can improve the energy efficiency and increase the property's value. ↑
- Both Replace the flooring — Replacing the flooring can improve the appearance and increase the property's value. ↑
- Both Replace the interior walls/paint — Replacing the interior walls and paint can improve the appearance and increase the property's value. ↑
ⓘ Cost ranges are severity-bucket heuristics (US national rule-of-thumb). Get contractor quotes + a written scope before underwriting a rehab budget.
Schools (NCES district)
- District
- Merrillville Community School Corporation
- NCES district ID
- 1809690
- Math proficiency
- 22% ▼ -17.00%
- Reading proficiency
- 36% ▼ -8.00%
- Median HH income
- $54,401
- Composite
- 25.74/100
- National rank
- #7375
- State rank
- #240 of 301 in IN
Livability — Merrillville
- Score
- 76/100
- State rank
- #50
- US rank
- #3393
Category grades
Schools grade is shown separately in the Schools card above.
Census & demographics
- Census place
- Merrillville, IN
- County
- Lake County · 422,878 people
- City population
- 39,243
- Metro
- Chicago-Naperville-Elgin, IL-IN-WI
- Population (ZIP)
- 39,243
- Household income
- $64,127
- Rent vs Own
- Severe rent burden
- 1644.0
Population outlook (Lake County) Hauer SSP2
- Today (2025)
- 484,026 people
- By 2030
- 478,091 · -1.2%
- By 2040
- 462,974 · -4.3%
- By 2050
- 449,894 · -7.1%
- By 2075
- 436,169 · -9.9%
- By 2100
- 426,607 · -11.9%
Race, ethnicity, and origin ACS 2023
- Neighborhood character
- Diverse neighborhood (Simpson 0.66)
- Race & ethnicity
- Black 46% White 32% Hispanic / Latino 16% Two or more races 9% Asian 2%
- Hispanic origin (detail)
- Mexican 11% Puerto Rican 3%
- Common ancestry
- Romanian 4% Iranian 2% Italian 1%
- Foreign-born
- 7% · Canada
- Languages at home
- 88% English-only · Spanish 7% Other Indo-European 2%
Political lean MEDSL · Lake
- 2024 margin
- Lean D (+5.6) · D 52.1% · R 46.5% · Other 1.5%
- 2008→2024 swing
- -28.6pp toward R · 2008: 34.3pp · 2024: 5.6pp
- All cycles
- 2024: D+5.6 2020: D+15.1 2016: D+20.6 2012: D+31.0 2008: D+34.3
Not yet ingested
- Civics
- —
Market trends
- HPI YoY
- ▼ -180.11%
- Current HPI
- 240.8833
- Rent YoY
- ▲ 4.10%
- Metro
- Chicago-Naperville-Elgin, IL-IN-WI
- State GDP YoY
- ▲ 2.90%
- F500 in state
- 18
Industry mix (Fortune 500 HQ in IN)
| Industry | F500 HQs | Revenue |
|---|---|---|
| Industrial Machinery | 2 | $37B |
|
||
| Healthcare | 1 | $177B |
|
||
| Pharmaceuticals | 1 | $45B |
|
||
| Metals / Steel | 1 | $18B |
|
||
| Agriculture | 1 | $17B |
|
||
| Packaging | 1 | $12B |
|
||
Price history
2 events — show timeline
- 2026-05-01 Pending — NIRA MLS as Distributed by MLS Grid
- 2026-04-23 Listed $434,900 NIRA MLS as Distributed by MLS Grid
Property tax history
+10.4%/yrLatest (2024): $4,766 · +2.6% YoY. Source: county tax records.
Cash-flow waterfall
monthlySold comps — $/sqft
last 12 mo · ≤1 miLoading sold comps…