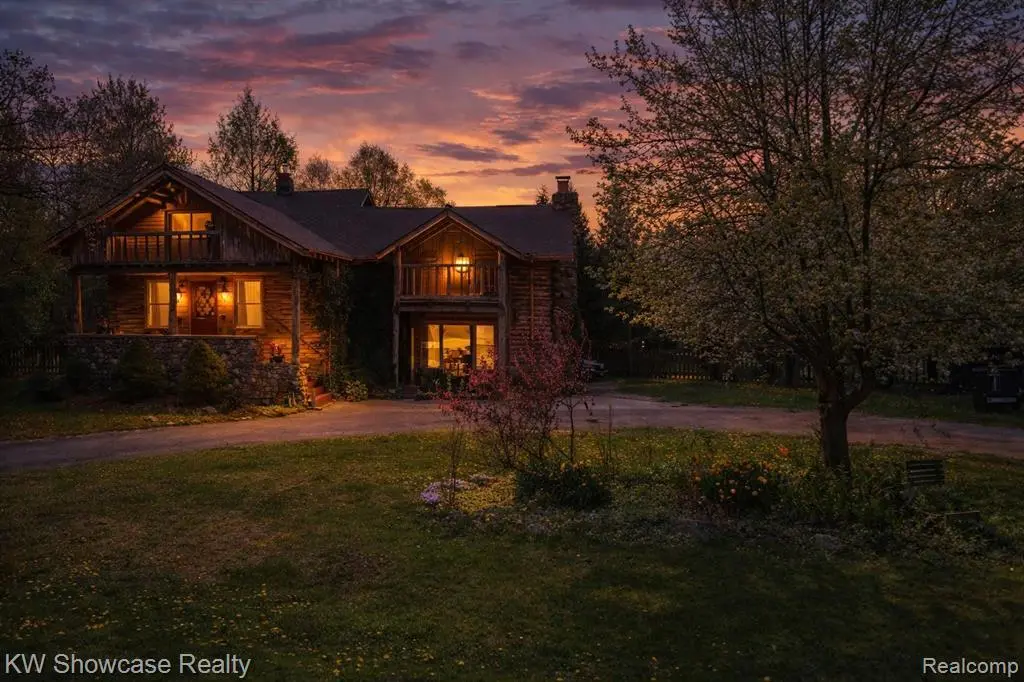
405 Shortridge Ave · Rochester Hills, MI
Flood risk 1/10 · Minimal
- FEMA flood zone
- X (unshaded)
- Chance of flooding over 30 yrs
- 0.0%
- Est. flood insurance / yr
- $507 – $1,088
Fire risk 1/10 · Minimal
- Est. fire insurance / yr
- $784 – $1,456
Heat risk 2/10 · Minimal
- Hot days now (above 97°F)
- 7 days/yr
- Hot days in 30 yrs
- 15 days/yr
Wind risk 2/10 · Minimal
- Chance of severe wind over 30 yrs
- —
Air-quality risk 3/10 · Minor
- Unhealthy air days now
- 3 days/yr
- Unhealthy air days in 30 yrs
- 4 days/yr
Risk factors via First Street. Map © Google.
Why this score? — see what drove the C grade
The composite is a weighted blend of 9 inputs, each scored 0–100. Each bar is that input's sub-score; the figure is the points it added to the 100-point composite (weight × sub-score).
- Cash flow +18.0/30.0
- ARV discount +15.0/15.0
- DSCR +5.7/10.0
- 1% rule +3.9/10.0
- Livability +3.9/5.0
- Schools +3.7/10.0
- Rent growth +2.9/5.0
- Condition / age +2.5/5.0
- Appreciation +0.0/10.0
$290,000
🖨 Deal sheet 📄 Offer letter ✓ Due diligence
Listing remarks MLS
Country living in Rochester Hills! Where else can you find a half acre oasis in the Avondale school district for this price? The entire quad level home oozes original log cabin charm with modern updates including forced air through the home, updated electrical wiring and insulation. While the layout is currently a 2bd, this home could easily be converted to a 3bed without even moving a wall. Fieldstone chimney, two story fireplace, original tile and floors, full basement, hewn log and plaster interior and 3 balconies. What more could you ask for?
Key facts
- 0.51 acre lot
- Built 1928
- Listed 58 days
Neighborhood map
What this means for you Summary
Snapshot
- This is a 2-bed/2.0-bath single-family listed at $290k.
Deal economics
- At list price, monthly cash flow is $252 ($3k/yr) — positive.
- The deal already cash-flows at list — no discount required.
- To meet the 1% rule (rent ≥ 1% of price), the offer needs to be $259k (10.7% below list).
- Recommended offer: $259k (10.7% below list) — sets the bar for 1% rule.
- Cap rate 7.3% vs local median 3.2% in Rochester Hills — top-decile yield for the area; either an underpriced asset or a hidden risk that comps aren't pricing in. Stress-test before assuming the spread holds.
Location & tenants
- Location reads 77/100 on livability (#127 in MI, #3,163 nationally) — a middle-class / working-renter tenant base. Strengths: crime A+, employment A+, housing A+; Watch: health & safety D, amenities F, commute F.
- Avondale School District (suburban): math 34% / reading 48% proficiency, ranked #162 of 540 in MI (top 30%) — families likely to look elsewhere, expect single-tenant / working-renter base with shorter leases.
- Market conditions: Rents rising (+1.8%/yr); 208 active listings in the ZIP; 6 comparable units currently listed for rent nearby; rentals at typical pace (median 15d on market — plan ~3-4 weeks tenant-placement turnaround); solid renter incomes; 2,614 units permitted in Oakland County in 2024 (721 in 5+ unit buildings).
Forward outlook
- Local home prices are declining (-3.0%/yr); year-one equity from $2k of loan paydown is wiped out by about $9k of value loss. Plan a longer hold.
- Oakland County population projected at +10% by 2050 — modest demand growth; plan on rents tracking national, not racing it.
Negotiation context
- It's been on market 58 days — a 3% lower offer ($281k) is reasonable based on typical stale-listing flexibility.
- 6 sale attempts since 30y ago with the ask held roughly flat each time — persistent listings suggest the price (not the market) is what's stuck; bring a comps-based counter.
- Current owner paid $87k; list at $290k implies a 233% gain — meaningful room to come down on a strong offer.
Risks & watch-outs
- Watch-outs: built in 1928 — expect roof / HVAC / electrical / plumbing capex.
Questions for the listing agent
- It's been on market 58 days. Have you received any prior offers? Is the seller open to a 11% concession, seller financing, or rate buy-down credit?
- Built in 1928 — when were the roof, HVAC, electrical panel, plumbing, and water heater last replaced?
- Is there a deadline driving the sale (1031 exchange, divorce, estate, relocation)? That informs how much negotiation room exists.
- Schools are A-rated — typically a magnet for longer-tenancy family renters. What's the average tenant stay here, and is there a school-zone premium baked into asking?
- What's the average days-on-market for RENTAL listings here right now (not sales)? A rising rental-DOM trend means longer vacancies and softer asking-rent achievability than the comps imply.
- What's the recent tenant-quality profile in this submarket — average credit score on applications, eviction rate, late-payment / NSF rate, and stable-employment percentage? A property-management company in the area should have these aggregated.
- How much new for-sale + rental construction is in the pipeline within 1–3 miles? Heavy new supply typically softens prices + rents 12–24 months out; constrained supply supports both.
Investment metrics
- 1% rule
- 0.89% ✗
- Cap rate
- 7.34%
- Cash-on-cash
- 3.73%
- DSCR
- 1.17
- GRM
- 9.3
CMA / ARV
- ARV (median comp)
- $414,587
- List price
- $290,000
- Delta
- -30.05%
- Verdict
- UNDERPRICED
- Comps
- 20 within 1.0 mi
Show comp detail 7 sales within ~0.75 mi
| Address | Dist | Beds/Ba | Sqft | Sold | Price | $/sf | Match |
|---|---|---|---|---|---|---|---|
| 3469 Hazelton St | 0.30mi | 3/2.5 (+1) | 1,996 (+2%) | 12mo | $386,500 | $194 | 66 |
| 232 Grace Ave | 0.26mi | 3/2.5 (+1) | 1,984 (+1%) | 23mo | $420,000 | $212 | 60 |
| 2908 Hickory Lawn Rd | 0.63mi | 3/2.0 (+1) | 2,000 (+2%) | 20mo | $200,000 | $100 | 45 |
| 758 South Blvd W | 0.46mi | 3/1.5 (+1) | 1,675 (-14%) | 4mo | $345,000 | $206 | 45 |
| 3295 Primrose Dr | 0.74mi | 3/2.5 (+1) | 1,826 (-7%) | 4mo | $350,000 | $192 | 43 |
| 677 Amberwood Ct | 0.45mi | 3/2.5 (+1) | 2,155 (+10%) | 19mo | $525,000 | $244 | 39 |
| 240 Michelson St | 0.66mi | 3/2.0 (+1) | 1,684 (-14%) | 21mo | $285,000 | $169 | 23 |
Match score weights: distance 35% · size 25% · config 20% · recency 20%. Top-matched comps best support the ARV.
Projected returns pro-forma
-3.0% appreciation · 1.78% rent growth · sell at horizon
- IRR
- -11.7%
- Equity multiple
- 0.58×
- Total profit
- $-34,168
- Equity at exit
- $43,240
- IRR
- -4.3%
- Equity multiple
- 0.73×
- Total profit
- $-22,018
- Equity at exit
- $25,074
Cash invested: $81,200 (down + closing). Projections, not guarantees.
Landlord ↔ Tenant lean methodology
- Overall (STATE)
- 62 Landlord-Friendly
- State Michigan
- 62 Landlord-Friendly · EVEN
- County
- — inherits STATE
- City
- — inherits STATE
ZIP-level market 48307
- Rents YoY
- 1.8%
- Active inventory
- 208
- Price-to-rent
- 9.3×
Monthly cashflow live
- Estimated rent
- $2,589 high interval (Pro) →
- Mortgage (P&I)
- −$1,521
- Tax from tax record
- −$151 /mo · $1,817/yr
- Insurance
- −$121
- HOA
- −$0
- Vacancy / Maint / Mgmt
- −$544
- Net cashflow
- $252
Break-even live
UW: 25.0% down · 7.5% · 30yr · 1.5% tax · 5.0% vac · 8.0% maint · 8.0% mgmt
Financing live
Cash to close
- Down payment
- $72,500
- Closing costs
- $8,700
- Reserves months
- —
- Total cash needed
- —
Loan-product check · same deal, 3 products live
Conventional
25% down · 7.5% · 30yr
- Down + closing
- —
- Monthly P&I
- —
- Monthly cashflow
- —
- DSCR
- —
- Eligible?
- —
Personal DTI + credit; lowest rate.
DSCR
20% down · 8.5% · 30yr
- Down + closing
- —
- Monthly P&I
- —
- Monthly cashflow
- —
- DSCR
- —
- Eligible?
- —
No personal income docs; deal must DSCR.
Hard money
10% down · 12.0% · 12mo
- Down + closing
- —
- Monthly P&I
- —
- Monthly cashflow
- —
- DSCR
- —
- Eligible?
- —
Short-term bridge; refi at stabilization.
Rent comps 6 comps
| Address | Beds | Baths | Sqft | Rent | $/sqft | DOM | Units | Dist |
|---|---|---|---|---|---|---|---|---|
| 3465 Hazelton Ave Rochester Hills, MI | 3.0 | 1.5 | 1240 | $3,690 | $2.98 | 3d | 1 | 0.33mi |
| 1128 Alameda Blvd Unit 1128 Troy, MI | 2.0 | 2.0 | 1457 | $2,150 | $1.48 | 22d | 1 | 0.89mi |
| 951 Barclay Cir Rochester Hills, MI | 3.0 | 4.0 | 1960 | $2,995 | $1.53 | 15d | 1 | 0.96mi |
| 2845 Hartwick Dr Rochester, MI | 3.0 | 3.5 | 1805 | $2,800 | $1.55 | 15d | 1 | 1.10mi |
| 716 Eton Ct Rochester Hills, MI | 2.0 | 3.0 | 1614 | $2,300 | $1.43 | 24d | 1 | 1.30mi |
| 1886 Ruby Ave Rochester Hills, MI | 3.0 | 2.0 | 1755 | $2,600 | $1.48 | 2d | 1 | 1.47mi |
Listing history 31 events
-
2026-06-18days on market $290,000 Active 58 DOM
-
2026-06-17days on market $290,000 Active 57 DOM
-
2026-06-16days on market $290,000 Active 56 DOM
-
2026-06-15days on market $290,000 Active 55 DOM
-
2026-06-13days on market $290,000 Active 53 DOM
-
2026-06-13days on market $290,000 Active 52 DOM
-
2026-06-09days on market $290,000 Active 49 DOM
-
2026-06-08days on market $290,000 Active 48 DOM
-
2026-06-07remarks 598-char remark
-
2026-06-07pricedays on market $290,000 Active 47 DOM
-
2026-06-04days on market $300,000 Active 44 DOM
-
2026-06-03days on market $300,000 Active 43 DOM
-
2026-06-02days on market $300,000 Active 42 DOM
-
2026-06-01days on market $300,000 Active 41 DOM
-
2026-05-31days on market $300,000 Active 40 DOM
-
2026-04-22$300,000 Active 552-char remark
Show marketing remark (555 chars)
Country living in Rochester Hills! Where else can you find a half acre oasis in the Avondale school district for this price? The entire quad level home oozes original log cabin charm with modern updates including forced air through the home, updated electrical wiring and insulation. While the layout is currently a 2bd, this home could easily be converted to a 3bed without even moving a wall. Fieldstone chimney, two story fireplace, original tile and floors, full basement, hewn log and plaster interior and 3 balconies. What more could you ask for?
-
2026-04-22$300,000 Active 555-char remark
Show marketing remark (555 chars)
Country living in Rochester Hills! Where else can you find a half acre oasis in the Avondale school district for this price? The entire quad level home oozes original log cabin charm with modern updates including forced air through the home, updated electrical wiring and insulation. While the layout is currently a 2bd, this home could easily be converted to a 3bed without even moving a wall. Fieldstone chimney, two story fireplace, original tile and floors, full basement, hewn log and plaster interior and 3 balconies. What more could you ask for?
-
2026-04-15historical $300,000 552-char remark
Show marketing remark (552 chars)
Country living in Rochester Hills! Where else can you find a half acre oasis in the Avondale school district for this price? The entire quad level home oozes original log cabin charm with modern updates including forced air through the home, updated electrical wiring and insulation. While the layout is currently a 2bd, this home could easily be converted to a 3bed without even moving a wall. Fieldstone chimney, two story fireplace, original tile and floors, full basement, hewn log and plaster interior and 3 balconies. What more could you ask for?
-
2011-03-25soldstatus $87,021
-
2011-03-25soldstatus $87,021
-
2011-02-21historical
-
2010-10-26$85,000
-
2010-10-26$85,000
-
1999-08-03soldstatus $175,000
-
1999-07-13soldstatus $175,000
-
1999-06-21historical
-
1999-06-08$179,900
-
1997-02-07soldstatus $140,000
-
1997-02-03soldstatus $140,000
-
1997-01-06historical
-
1996-12-02$139,900
ⓘ Source: listings_history table (triggers on properties + properties_extension) + one-shot
backfill from property_details.listing_events for pre-trigger history.
Tax reassessment forecast MI · Partial reset (capped growth)
- Current annual tax
- $1,817 · $151/mo
- Projected year-2 tax
- $3,142 · $262/mo
- Expected delta
- +$1,324/yr (+$110/mo · 72.9%)
ⓘ Screening estimate from a state-policy table — verify with the county assessor before closing.
Climate risk First Street
- Flood 1/10 Low FEMA zone X (unshaded) · 0% chance over 30 yrs
- Wildfire 1/10 Low
- Heat 2/10 Low 7 d/yr ≥97°F today · 15 d/yr by 30 yrs out
- Wind 2/10 Low
- Air quality 3/10 Moderate 3 unhealthy d/yr today · 4 by 30 yrs out
Nearby sold comps map
Loading sold comps map…
Walkable amenities ~0.75 mi
Loading nearby amenities…
Taxation est. · year 1
- Rental income
- $31,065
- − Mortgage interest
- −$16,245
- − Property taxes
- −$1,817
- − Insurance
- −$1,450
- − Repairs & maintenance
- −$2,485
- − Management
- −$2,485
- − Depreciation
- −$8,436
- Taxable loss
- −$1,853
- Est. tax savings @ 24.0%
- +$445
- After-tax cash flow
- $3,470/yr
For passive investors: Depreciation is non-cash, so a rental often shows a tax loss while cash-flowing — sheltering income. Rental losses are passive: they offset passive income freely, and up to $25,000/yr can offset ordinary (W-2) income if you actively participate and your MAGI is under $100k (phasing out to $0 by $150k); unused losses carry forward. On sale, claimed depreciation is recaptured at up to 25%, and gains may owe capital-gains tax (a 1031 exchange can defer both). Figures are a year-1 estimate at your 24.0% rate — not tax advice; consult a CPA.
Schools (NCES district)
- District
- Avondale School District
- NCES district ID
- 2603690
- Math proficiency
- 34% ▼ -8.00%
- Reading proficiency
- 48% ▼ -4.00%
- Median HH income
- $71,549
- Composite
- 37.33/100
- National rank
- #4442
- State rank
- #162 of 540 in MI
Livability — Rochester Hills
- Score
- 77/100
- State rank
- #127
- US rank
- #3163
Category grades
Schools grade is shown separately in the Schools card above.
Census & demographics
- Census place
- Rochester Hills, MI
- County
- Oakland County · 1,009,092 people
- City population
- 44,714
- Metro
- Detroit-Warren-Dearborn, MI
- Population (ZIP)
- 44,714
- Household income
- $106,576
- Rent vs Own
- Severe rent burden
- 926.0
Population outlook (Oakland County) Hauer SSP2
- Today (2025)
- 1,335,747 people
- By 2030
- 1,375,100 · +2.9%
- By 2040
- 1,435,385 · +7.5%
- By 2050
- 1,469,250 · +10.0%
- By 2075
- 1,531,946 · +14.7%
- By 2100
- 1,450,485 · +8.6%
Race, ethnicity, and origin ACS 2023
- Neighborhood character
- Predominantly White (74%)
- Race & ethnicity
- White 74% Asian 14% Two or more races 6% Black 4% Hispanic / Latino 4%
- Common ancestry
- Romanian 9% Lithuanian 3% Slovak 2%
- Foreign-born
- 19% · Canada, China, South Korea
- Languages at home
- 76% English-only · Other Indo-European 9% Spanish 3% Arabic 2%
Political lean MEDSL · Oakland
- 2024 margin
- D (+10.6) · D 54.4% · R 43.8% · Other 1.9%
- 2008→2024 swing
- -3.9pp toward R · 2008: 14.5pp · 2024: 10.6pp
- All cycles
- 2024: D+10.6 2020: D+14.1 2016: D+8.1 2012: D+8.1 2008: D+14.5
Not yet ingested
- Civics
- —
Market trends
- HPI YoY
- ▼ -339.13%
- Current HPI
- 188.8794
- Rent YoY
- ▲ 1.78%
- Metro
- Detroit-Warren-Dearborn, MI
- State GDP YoY
- ▲ 1.37%
- F500 in state
- 28
Industry mix (Fortune 500 HQ in MI)
| Industry | F500 HQs | Revenue |
|---|---|---|
| Automotive Parts | 3 | $48B |
|
||
| Automotive | 2 | $372B |
|
||
| Chemicals | 1 | $45B |
|
||
| Automotive Retail | 1 | $29B |
|
||
| Healthcare / Medical Devices | 1 | $23B |
|
||
| Automotive Technology | 1 | $20B |
|
||
Price history
+114.4% since first listed16 events — show timeline
- 2026-04-22 Listed $300,000 MiRealSource-MiMLS
- 2026-04-22 Listed $300,000 REALCOMP
- 2026-04-15 Coming Soon $300,000 MiRealSource-MiMLS
- 2011-03-25 Sold (MLS) $87,021 REALCOMP
- 2011-03-25 Sold (MLS) $87,021 MiRealSource-MiMLS
- 2011-02-21 Listing Removed — MiRealSource-MiMLS
- 2010-10-26 Listed $85,000 REALCOMP
- 2010-10-26 Listed $85,000 MiRealSource-MiMLS
- 1999-08-03 Sold (Public Records) $175,000 Public Records
- 1999-07-13 Sold (MLS) $175,000 MiRealSource-MiMLS
- 1999-06-21 Listing Removed — MiRealSource-MiMLS
- 1999-06-08 Listed $179,900 MiRealSource-MiMLS
- 1997-02-07 Sold (Public Records) $140,000 Public Records
- 1997-02-03 Sold (MLS) $140,000 MiRealSource-MiMLS
- 1997-01-06 Listing Removed — MiRealSource-MiMLS
- 1996-12-02 Listed $139,900 MiRealSource-MiMLS
Property tax history
-3.1%/yrLatest (2025): $1,817 · -46.2% YoY. Source: county tax records.
Cash-flow waterfall
monthlySold comps — $/sqft
last 12 mo · ≤1 miLoading sold comps…