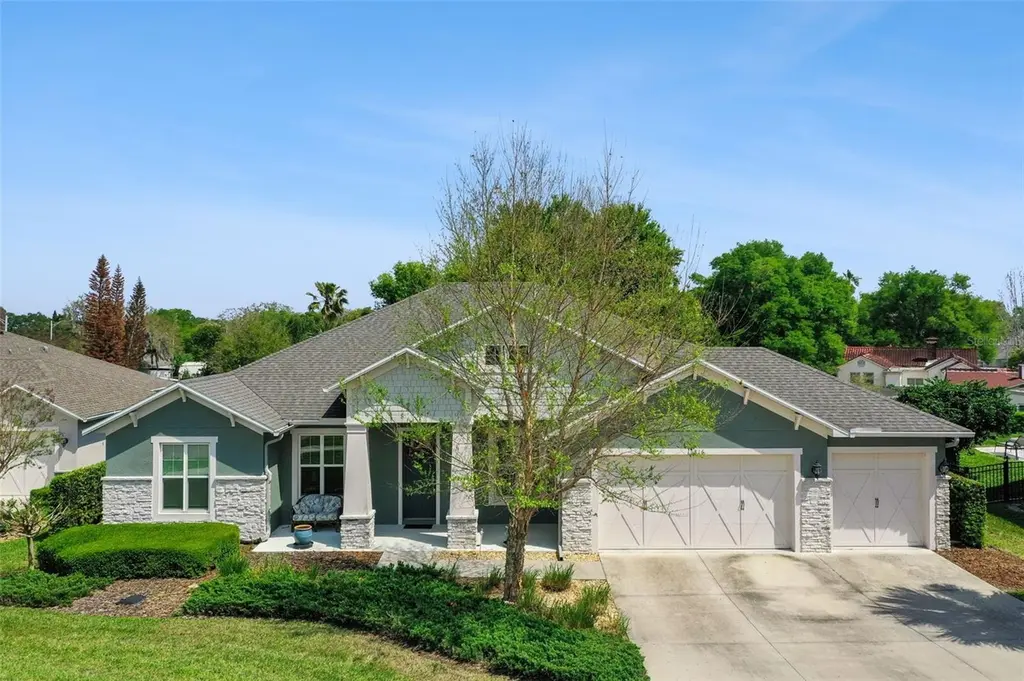
16816 Lakemont Ave · Montverde, FL
Flood risk 1/10 · Minimal
- FEMA flood zone
- X (unshaded)
- Chance of flooding over 30 yrs
- 0.0%
- Est. flood insurance / yr
- $507 – $1,088
Fire risk 3/10 · Minor
- Est. fire insurance / yr
- $947 – $1,759
Heat risk 8/10 · Major
- Hot days now (above 108°F)
- 7 days/yr
- Hot days in 30 yrs
- 23 days/yr
Wind risk 9/10 · Severe
- Chance of severe wind over 30 yrs
- 99.0%
Air-quality risk 1/10 · Minimal
- Unhealthy air days now
- 0 days/yr
- Unhealthy air days in 30 yrs
- 0 days/yr
Risk factors via First Street. Map © Google.
Why this score? — see what drove the F grade
The composite is a weighted blend of 9 inputs, each scored 0–100. Each bar is that input's sub-score; the figure is the points it added to the 100-point composite (weight × sub-score).
- Cash flow +10.9/30.0
- Schools +4.2/10.0
- Livability +3.3/5.0
- DSCR +3.2/10.0
- 1% rule +2.6/10.0
- Rent growth +2.5/5.0
- Condition / age +2.5/5.0
- ARV discount +2.3/15.0
- Appreciation +2.3/10.0
$779,000
🖨 Deal sheet 📄 Offer letter ✓ Due diligence
Listing remarks
Under contract-accepting backup offers. Welcome to this beautifully maintained 4-bedroom, 3-bath home with a 3 car garage built by Pillar Homes, perfectly situated in the heart of Montverde. Set on a spacious . 33-acre lot with no HOA, this property offers the freedom and space that’s hard to find. The home has been meticulously cared for, making it truly move-in ready. Step inside to an open, airy floor plan designed for both everyday living and entertaining. The kitchen is truly the heart of the home, featuring a large center island, a separate bar counter with seating for stools, built-in oven and microwave, and plenty of space for gathering with family and friends. The layout flow
Key facts
- 0.33 acre lot
- 3 garage spots
- Pool
Property features AI
Finance
- Other: Private heated gunite pool with salt water system, auto cleaner, tile finish and screen enclosure; Lot approximately 0.33 acres (approx. 98 x 163); Public maintained paved road
- Financial info: Homestead exemption applied
- HOA & community: No association reported
Exterior
- Parking: Attached 3-car garage; Garage door opener; Golf cart garage; Garage dimensions approximately 30 x 22
- Security: Generator (on property)
- Utilities: Public water; Septic tank; Electricity connected; High-speed internet available
- Home design: Single family residence; One story; Home faces west; Residential property
- Construction: Block and stucco construction; Shingle roof; Slab foundation; Built with irrigation equipment
- Exterior features: Front porch; Rear porch; Screened porch; Rain gutters; Sliding doors; Paved lot; Landscaped with trees
Interior
- Kitchen: Built-in oven; Cooktop; Dishwasher; Disposal; Microwave; Range hood; Refrigerator; Stone counters; Eat-in kitchen
- Bedrooms: 4 bedrooms
- Flooring: Carpet; Laminate
- Bathrooms: 3 full bathrooms
- Heating & cooling: Electric heating; Central air conditioning
- Interior features: Ceiling fans; Crown molding; Eat-in kitchen; Open floorplan; Stone counters; Thermostat; Tray ceilings; Walk-in closets
- Laundry & utility: Laundry room with washer and dryer hookups; Electric dryer hookup; Inside laundry
Neighborhood map
What this means for you Summary
Snapshot
- This is a 4-bed/3.0-bath single-family listed at $779k.
Deal economics
- At list price, monthly cash flow is $-342 ($-4k/yr) — negative.
- To cash-flow at today's rent, offer at most $719k (7.7% below list).
- To meet the 1% rule (rent ≥ 1% of price), the offer needs to be $590k (24.2% below list).
- Recommended offer: $590k (24.2% below list) — sets the bar for 1% rule.
- Cap rate 5.8% vs local median 2.2% in Montverde — top-decile yield for the area; either an underpriced asset or a hidden risk that comps aren't pricing in. Stress-test before assuming the spread holds.
Location & tenants
- Location reads 66/100 on livability (#598 in FL) — a middle-class / working-renter tenant base. Strengths: crime A+, employment A+, housing A+; Watch: cost of living D, amenities F, commute F.
- Lake (suburban): math 49% / reading 50% proficiency, ranked #37 of 73 in FL (top 51%) — families likely to look elsewhere, expect single-tenant / working-renter base with shorter leases.
- Zoned schools: Grassy Lake Elementary School (math 58% / reading 63%, grade B-, #664 of 2,144 statewide, top 32%, 1,209 students, 29% FRL); Lake Minneola High School (math 44% / reading 57%, grade D+, #171 of 667 statewide, top 26%, 2,176 students, 28% FRL) — zoned schools average 29% FRL vs 49% district-wide (20 pts lower); this property's tenant base skews higher-income than the district average.
- Market conditions: 199 active listings in the ZIP; 3 comparable units currently listed for rent nearby; rentals at typical pace (median 24d on market — plan ~3-4 weeks tenant-placement turnaround); solid renter incomes; 4,799 units permitted in Lake County in 2024 (814 in 5+ unit buildings).
- At $5,904/mo this rent would consume 65% of the median local household income ($108k/yr) (locally 24% of renters already pay >50% of income on rent) — very limited rent-growth headroom before tenants either downsize or default.
Forward outlook
- Local home prices are declining (-3.0%/yr); year-one equity from $5k of loan paydown is wiped out by about $23k of value loss. Plan a longer hold.
- Lake County population projected at +37% by 2050 — long-run rental-demand tailwind backs the buy-and-hold thesis.
Negotiation context
- It's been on market 50 days — a 3% lower offer ($756k) is reasonable based on typical stale-listing flexibility.
Risks & watch-outs
- Climate carrying-cost: severe wind risk, 99% chance of damaging wind over 30y; extreme-heat days projected 7→23/yr by 2055 (HVAC capex compounding) — expect insurance premiums to compound above CPI over the hold.
Questions for the listing agent
- What do current leases actually rent for vs. the listed asking? Can we see a recent rent roll and the last 12 months of T-12 income?
- It's been on market 50 days. Have you received any prior offers? Is the seller open to a 24% concession, seller financing, or rate buy-down credit?
- Is there a deadline driving the sale (1031 exchange, divorce, estate, relocation)? That informs how much negotiation room exists.
- The area grade is low — what's the realistic commute time and amenity access for the typical tenant pool here? Any planned neighborhood developments (good or bad) we should know about?
- What's the average days-on-market for RENTAL listings here right now (not sales)? A rising rental-DOM trend means longer vacancies and softer asking-rent achievability than the comps imply.
- What's the recent tenant-quality profile in this submarket — average credit score on applications, eviction rate, late-payment / NSF rate, and stable-employment percentage? A property-management company in the area should have these aggregated.
- How much new for-sale + rental construction is in the pipeline within 1–3 miles? Heavy new supply typically softens prices + rents 12–24 months out; constrained supply supports both.
Investment metrics
- 1% rule
- 0.76% ✗
- Cap rate
- 5.77%
- Cash-on-cash
- -1.88%
- DSCR
- 0.92
- GRM
- 11.0
CMA / ARV
- ARV (on-the-fly)
- $698,022
- Comps found
- 4
Show comp detail 4 sales within ~0.75 mi
| Address | Dist | Beds/Ba | Sqft | Sold | Price | $/sf | Match |
|---|---|---|---|---|---|---|---|
| 16846 Florence View Dr | 0.56mi | 4/3.0 | 2,972 (+5%) | 0mo | $575,000 | $193 | 65 |
| 16703 Magnolia Ter | 0.43mi | 5/3.0 (+1) | 2,960 (+5%) | 8mo | $810,000 | $274 | 60 |
| 16418 Magnolia Bluff Dr | 0.31mi | 4/4.0 | 3,219 (+14%) | 21mo | $787,500 | $245 | 41 |
| 16908 Florence View Dr | 0.53mi | 4/4.0 | 3,245 (+15%) | 16mo | $800,000 | $247 | 34 |
Match score weights: distance 35% · size 25% · config 20% · recency 20%. Top-matched comps best support the ARV.
Projected returns pro-forma
-3.0% appreciation · 3.0% rent growth · sell at horizon
- IRR
- -19.4%
- Equity multiple
- 0.32×
- Total profit
- $-148,139
- Equity at exit
- $116,151
- IRR
- -12.2%
- Equity multiple
- 0.28×
- Total profit
- $-157,602
- Equity at exit
- $67,354
Cash invested: $218,120 (down + closing). Projections, not guarantees.
Landlord ↔ Tenant lean methodology
- Overall (STATE)
- 87 Strongly Landlord-Friendly
- State Florida
- 87 Strongly Landlord-Friendly · R+3
- County
- — inherits STATE
- City
- — inherits STATE
ZIP-level market 34756
- Home prices YoY
- -1.3%
- Active inventory
- 199
- Price-to-rent
- 11.0×
Monthly cashflow live
- Estimated rent
- $5,904 medium interval (Pro) →
- Mortgage (P&I)
- −$4,085
- Tax from tax record
- −$597 /mo · $7,158/yr
- Insurance
- −$325
- HOA
- −$0
- Vacancy / Maint / Mgmt
- −$1,240
- Net cashflow
- $-342
Break-even live
UW: 25.0% down · 7.5% · 30yr · 1.5% tax · 5.0% vac · 8.0% maint · 8.0% mgmt
Financing live
Cash to close
- Down payment
- $194,750
- Closing costs
- $23,370
- Reserves months
- —
- Total cash needed
- —
Loan-product check · same deal, 3 products live
Conventional
25% down · 7.5% · 30yr
- Down + closing
- —
- Monthly P&I
- —
- Monthly cashflow
- —
- DSCR
- —
- Eligible?
- —
Personal DTI + credit; lowest rate.
DSCR
20% down · 8.5% · 30yr
- Down + closing
- —
- Monthly P&I
- —
- Monthly cashflow
- —
- DSCR
- —
- Eligible?
- —
No personal income docs; deal must DSCR.
Hard money
10% down · 12.0% · 12mo
- Down + closing
- —
- Monthly P&I
- —
- Monthly cashflow
- —
- DSCR
- —
- Eligible?
- —
Short-term bridge; refi at stabilization.
Rent comps 3 comps
| Address | Beds | Baths | Sqft | Rent | $/sqft | DOM | Units | Dist |
|---|---|---|---|---|---|---|---|---|
| 16008 Volterra Pt Bella Collina, FL | 4.0 | 4.0 | 2979 | $7,500 | $2.52 | 23d | 1 | 1.30mi |
| 16029 Volterra Pt Bella Collina, FL | 5.0 | 3.5 | 3076 | $5,600 | $1.82 | 23d | 1 | 1.35mi |
| 16120 Volterra Pt Bella Collina, FL | 5.0 | 4.0 | 3076 | $5,850 | $1.90 | 16d | 1 | 1.39mi |
Listing history 3 events
-
2026-05-15status Pending
-
2026-05-08price $779,000
-
2026-03-26$799,990 Active
ⓘ Source: listings_history table (triggers on properties + properties_extension) + one-shot
backfill from property_details.listing_events for pre-trigger history.
Tax reassessment forecast FL · Resets to sale price
- Current annual tax
- $7,158 · $597/mo
- Projected year-2 tax
- $7,158 · $597/mo
- Expected delta
- $0/yr ($0/mo · 0.0%)
ⓘ Screening estimate from a state-policy table — verify with the county assessor before closing.
Climate risk First Street
- Flood 1/10 Low FEMA zone X (unshaded) · 0% chance over 30 yrs
- Wildfire 3/10 Moderate
- Heat 8/10 Severe 7 d/yr ≥108°F today · 23 d/yr by 30 yrs out
- Wind 9/10 Extreme 99% chance of damaging wind over 30 yrs
- Air quality 1/10 Low 0 unhealthy d/yr today · 0 by 30 yrs out
Nearby sold comps map
Loading sold comps map…
Walkable amenities ~0.75 mi
Loading nearby amenities…
Taxation est. · year 1
- Rental income
- $70,854
- − Mortgage interest
- −$43,636
- − Property taxes
- −$7,158
- − Insurance
- −$3,895
- − Repairs & maintenance
- −$5,668
- − Management
- −$5,668
- − Depreciation
- −$22,662
- Taxable loss
- −$17,834
- Est. tax savings @ 24.0%
- +$4,280
- After-tax cash flow
- $179/yr
For passive investors: Depreciation is non-cash, so a rental often shows a tax loss while cash-flowing — sheltering income. Rental losses are passive: they offset passive income freely, and up to $25,000/yr can offset ordinary (W-2) income if you actively participate and your MAGI is under $100k (phasing out to $0 by $150k); unused losses carry forward. On sale, claimed depreciation is recaptured at up to 25%, and gains may owe capital-gains tax (a 1031 exchange can defer both). Figures are a year-1 estimate at your 24.0% rate — not tax advice; consult a CPA.
Schools (NCES district)
- District
- Lake
- NCES district ID
- 1201050
- Math proficiency
- 49% ▼ -7.00%
- Reading proficiency
- 50% ▼ -4.00%
- Median HH income
- $46,632
- Composite
- 42.05/100
- National rank
- #3327
- State rank
- #37 of 73 in FL
Livability — Montverde
- Score
- 66/100
- State rank
- #598
- US rank
- #11453
Category grades
Schools grade is shown separately in the Schools card above.
Census & demographics
- Census place
- Montverde, FL
- County
- Lake County · 364,602 people
- City population
- 4,876
- Metro
- Orlando-Kissimmee-Sanford, FL
- Population (ZIP)
- 4,876
- Household income
- $108,500
- Rent vs Own
- Severe rent burden
- 24.0
Population outlook (Lake County) Hauer SSP2
- Today (2025)
- 386,640 people
- By 2030
- 417,107 · +7.9%
- By 2040
- 476,676 · +23.3%
- By 2050
- 531,296 · +37.4%
- By 2075
- 648,303 · +67.7%
- By 2100
- 698,530 · +80.7%
Race, ethnicity, and origin ACS 2023
- Neighborhood character
- Predominantly White (74%)
- Race & ethnicity
- White 74% Hispanic / Latino 17% Two or more races 6% Black 5%
- Hispanic origin (detail)
- Mexican 6% Puerto Rican 4% Cuban 6%
- Common ancestry
- Romanian 4% Italian 2% Lithuanian 1%
- Foreign-born
- 6% · Canada, Mexico, Jamaica
- Languages at home
- 84% English-only · Spanish 14% Arabic 2% Other Indo-European 1%
Political lean MEDSL · Lake
- 2024 margin
- Strong R (+24.7) · D 37.3% · R 62.0%
- 2008→2024 swing
- -11.2pp toward R · 2008: -13.5pp · 2024: -24.7pp
- All cycles
- 2024: R+24.7 2020: R+20.0 2016: R+23.1 2012: R+17.1 2008: R+13.5
Not yet ingested
- Civics
- —
Market trends
- HPI YoY
- ▼ -5.42%
- Current HPI
- 410.9213
- Rent YoY
- —
- Metro
- Orlando-Kissimmee-Sanford, FL
- State GDP YoY
- ▲ 3.28%
- F500 in state
- 36
Industry mix (Fortune 500 HQ in FL)
| Industry | F500 HQs | Revenue |
|---|---|---|
| Industrial Technology | 2 | $29B |
|
||
| Insurance | 2 | $17B |
|
||
| Retail | 1 | $60B |
|
||
| Technology Distribution | 1 | $58B |
|
||
| Homebuilding | 1 | $35B |
|
||
| Technology Manufacturing | 1 | $35B |
|
||
Price history
-2.6% since first listed3 events — show timeline
- 2026-05-15 Pending — Stellar MLS as Distributed by MLS Grid
- 2026-05-08 Price Changed $779,000 Stellar MLS as Distributed by MLS Grid
- 2026-03-26 Listed $799,990 Stellar MLS as Distributed by MLS Grid
Property tax history
+55.4%/yrLatest (2025): $7,158 · +2.3% YoY. Source: county tax records.
Cash-flow waterfall
monthlySold comps — $/sqft
last 12 mo · ≤1 miLoading sold comps…