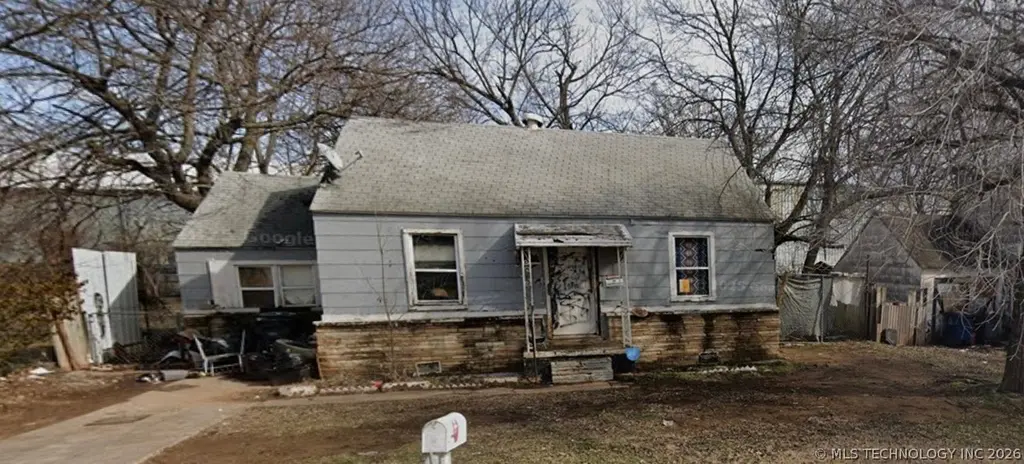
1171 N Columbia Pl · Tulsa, OK
Flood risk 1/10 · Minimal
- FEMA flood zone
- X (unshaded)
- Chance of flooding over 30 yrs
- 0.0%
- Est. flood insurance / yr
- $507 – $1,088
Fire risk 1/10 · Minimal
- Est. fire insurance / yr
- $2,463 – $4,575
Heat risk 6/10 · Moderate
- Hot days now (above 110°F)
- 7 days/yr
- Hot days in 30 yrs
- 18 days/yr
Wind risk 2/10 · Minimal
- Chance of severe wind over 30 yrs
- 4.0%
Air-quality risk 2/10 · Minimal
- Unhealthy air days now
- 2 days/yr
- Unhealthy air days in 30 yrs
- 2 days/yr
Risk factors via First Street. Map © Google.
Why this score? — see what drove the C- grade
The composite is a weighted blend of 9 inputs, each scored 0–100. Each bar is that input's sub-score; the figure is the points it added to the 100-point composite (weight × sub-score).
- Cash flow +15.0/30.0
- Appreciation +9.3/10.0
- ARV discount +7.5/15.0
- 1% rule +5.0/10.0
- DSCR +5.0/10.0
- Livability +3.8/5.0
- Rent growth +2.9/5.0
- Condition / age +2.5/5.0
- Schools +0.8/10.0
$21,000
🖨 Deal sheet (PDF) 📄 Offer letter ✓ Due diligence
Listing remarks
Calling all investors! This deal is so hot its extra crispy!! Half of the house is "well done", but makes a perfect blank canvass for an investor. Home to be sold in as-is condition.
Key facts
- 7,680 sq ft lot
- Built 1944
- Listed 39 days
Property features AI
Exterior
- Security: No safety shelter
- Utilities: Public water; Public sewer
- Home design: Single-story home
- Construction: Vinyl siding with wood frame construction; Asphalt fiberglass roof; Crawlspace foundation; Built per public records
- Exterior features: No notable exterior features listed; Property faces west
Interior
- Bathrooms: 1 full bathroom
- Interior features: Aluminum frame windows; No additional interior features listed
- Laundry & utility: No hot water appliance present
Neighborhood map
What this means for you Summary
Snapshot
- This is a 2-bed/1.0-bath single-family listed at $21k.
Deal economics
- At list price, monthly cash flow is $692 ($8k/yr) — positive.
- The deal already cash-flows at list — no discount required.
- Meets the 1% rule at list price ($1k rent vs $21k).
- Recommended offer: $20k (3.0% below list) — sets the bar for market timing.
- Cap rate 45.9% vs local median 3.9% in Tulsa — top-decile yield for the area; either an underpriced asset or a hidden risk that comps aren't pricing in. Stress-test before assuming the spread holds.
Location & tenants
- Location reads 75/100 on livability (#13 in OK, #4,058 nationally) — a middle-class / working-renter tenant base. Strengths: amenities A+, commute A+, cost of living A+; Watch: schools F, crime F, employment D-.
- Tulsa (urban): math 7% / reading 12% proficiency, ranked #250 of 270 in OK (top 93%) — low school quality limits family demand, transient renter base, plan for 1-2y turnover; 76% free/reduced lunch — lower-income household profile, screen leases tightly.
- Market conditions: Rents rising (+1.8%/yr); 57 active listings in the ZIP; 22 comparable units currently listed for rent nearby; rentals at typical pace (median 25d on market — plan ~3-4 weeks tenant-placement turnaround); lower-income renter base — watch delinquency; 2,818 units permitted in Tulsa County in 2024 (518 in 5+ unit buildings).
Forward outlook
- In year one you build about $2k of equity ($145 loan paydown + $2k appreciation (8.7% local appreciation)).
- Tulsa County population projected at +30% by 2050 — long-run rental-demand tailwind backs the buy-and-hold thesis.
- At projected returns (8.7% appreciation + 1.8% rent growth), your $6k cash investment doubles in ~1 year — after that, you're playing with house money.
Negotiation context
- It's been on market 40 days — a 3% lower offer ($20k) is reasonable based on typical stale-listing flexibility.
- Current owner paid $8k; list at $21k implies a 162% gain — meaningful room to come down on a strong offer.
Risks & watch-outs
- Watch-outs: built in 1944 — expect roof / HVAC / electrical / plumbing capex.
- Climate carrying-cost: extreme-heat days projected 7→18/yr by 2055 (HVAC capex compounding) — expect insurance premiums to compound above CPI over the hold.
Questions for the listing agent
- It's been on market 40 days. Have you received any prior offers? Is the seller open to a 3% concession, seller financing, or rate buy-down credit?
- Built in 1944 — when were the roof, HVAC, electrical panel, plumbing, and water heater last replaced?
- Is there a deadline driving the sale (1031 exchange, divorce, estate, relocation)? That informs how much negotiation room exists.
- Schools are F-rated, which usually means shorter tenancies and higher turnover. Who's the typical renter profile here, and what's been the actual vacancy rate?
- Crime grade is F in this area — have there been break-ins, vandalism, or insurance claims at this property in the last 3 years? What carrier currently insures it and at what premium?
- What's the average days-on-market for RENTAL listings here right now (not sales)? A rising rental-DOM trend means longer vacancies and softer asking-rent achievability than the comps imply.
- What's the recent tenant-quality profile in this submarket — average credit score on applications, eviction rate, late-payment / NSF rate, and stable-employment percentage? A property-management company in the area should have these aggregated.
- How much new for-sale + rental construction is in the pipeline within 1–3 miles? Heavy new supply typically softens prices + rents 12–24 months out; constrained supply supports both.
Investment metrics
- 1% rule
- 4.99% ✓
- Cap rate
- 45.85%
- Cash-on-cash
- 141.28%
- DSCR
- 7.29
- GRM
- 1.7
CMA / ARV
- ARV (on-the-fly)
- $139,200
- Comps found
- 12
Show comp detail 12 sales within ~0.75 mi
| Address | Dist | Beds/Ba | Sqft | Sold | Price | $/sf | Match |
|---|---|---|---|---|---|---|---|
| 2707 E Marshall St | 0.06mi | 3/1.0 (+1) | 965 (+0%) | 2mo | $105,000 | $109 | 90 |
| 1146 N Harvard Ave | 0.56mi | 2/1.0 | 955 (-0%) | 9mo | $120,000 | $126 | 65 |
| 1041 N Florence Ave E | 0.39mi | 3/1.0 (+1) | 939 (-2%) | 11mo | $70,000 | $75 | 64 |
| 149 N Columbia Pl | 0.55mi | 2/1.0 | 991 (+3%) | 9mo | $150,000 | $151 | 62 |
| 119 N Columbia Ave | 0.62mi | 2/1.0 | 903 (-6%) | 2mo | $137,000 | $152 | 59 |
| 1034 N College Ave E | 0.33mi | 2/1.0 | 1,080 (+12%) | 10mo | $75,000 | $69 | 56 |
| 1901 N Atlanta Ave | 0.75mi | 3/1.0 (+1) | 909 (-5%) | 0mo | $131,500 | $145 | 51 |
| 2837 E Admiral Ct | 0.73mi | 3/1.0 (+1) | 982 (+2%) | 10mo | $149,900 | $153 | 48 |
| 1621 N Delaware Ave | 0.51mi | 2/1.0 | 1,080 (+12%) | 12mo | $116,000 | $107 | 46 |
| 736 N Gary Pl | 0.65mi | 2/1.0 | 1,060 (+10%) | 9mo | $150,000 | $142 | 45 |
| 1421 N Indianapolis Ave | 0.67mi | 2/1.0 | 841 (-12%) | 7mo | $179,000 | $213 | 42 |
| 711 N Gillette Ave | 0.74mi | 2/1.0 | 1,090 (+14%) | 12mo | $183,000 | $168 | 33 |
Match score weights: distance 35% · size 25% · config 20% · recency 20%. Top-matched comps best support the ARV.
Projected returns pro-forma
8.69% appreciation · 1.78% rent growth · sell at horizon
- IRR
- —
- Equity multiple
- 9.91×
- Total profit
- $52,420
- Equity at exit
- $16,953
- IRR
- —
- Equity multiple
- 20.89×
- Total profit
- $116,924
- Equity at exit
- $34,652
Cash invested: $5,880 (down + closing). Projections, not guarantees.
Landlord ↔ Tenant lean methodology
- Overall (STATE)
- 83 Strongly Landlord-Friendly
- State Oklahoma
- 83 Strongly Landlord-Friendly · R+20
- County
- — inherits STATE
- City
- — inherits STATE
ZIP-level market 74110
- Home prices YoY
- 3.2%
- Rents YoY
- 1.8%
- Active inventory
- 57
- Price-to-rent
- 1.7×
Monthly cashflow live
- Estimated rent
- $1,049 high interval (Pro) →
- Mortgage (P&I)
- −$110
- Tax from tax record
- −$17 /mo · $206/yr
- Insurance
- −$9
- HOA
- −$0
- Vacancy / Maint / Mgmt
- −$220
- Net cashflow
- $692
Break-even live
Sensitivity live
| Price | -10% $704 | -5% $698 | +0% $692 | +5% $686 | +10% $680 |
|---|---|---|---|---|---|
| Rent | -10% $609 | -5% $651 | +0% $692 | +5% $734 | +10% $775 |
| Rate | -1.0pp $703 | -0.5pp $698 | base $692 | +0.5pp $687 | +1.0pp $681 |
UW: 25.0% down · 7.5% · 30yr · 1.5% tax · 5.0% vac · 8.0% maint · 8.0% mgmt
Financing live
Cash to close
- Down payment
- $5,250
- Closing costs
- $630
- Reserves months
- —
- Total cash needed
- —
Loan-product check · same deal, 3 products live
Conventional
25% down · 7.5% · 30yr
- Down + closing
- —
- Monthly P&I
- —
- Monthly cashflow
- —
- DSCR
- —
- Eligible?
- —
Personal DTI + credit; lowest rate.
DSCR
20% down · 8.5% · 30yr
- Down + closing
- —
- Monthly P&I
- —
- Monthly cashflow
- —
- DSCR
- —
- Eligible?
- —
No personal income docs; deal must DSCR.
Hard money
10% down · 12.0% · 12mo
- Down + closing
- —
- Monthly P&I
- —
- Monthly cashflow
- —
- DSCR
- —
- Eligible?
- —
Short-term bridge; refi at stabilization.
Rent comps 22 comps
| Address | Beds | Baths | Sqft | Rent | $/sqft | DOM | Units | Dist |
|---|---|---|---|---|---|---|---|---|
| 1507 N Florence Ave Tulsa, OK | 3.0 | 1.0 | 1000 | $1,100 | $1.10 | 24d | 1 | 0.55mi |
| 1623 N Atlanta Ave Tulsa, OK | 3.0 | 1.0 | 975 | $1,175 | $1.21 | 4d | 1 | 0.58mi |
| 1816 N Delaware Pl Tulsa, OK | 3.0 | 1.0 | 990 | $950 | $0.96 | 4d | 1 | 0.65mi |
| 2614 E Archer St Tulsa, OK | 1.0 | 1.0 | 845 | $900 | $1.07 | 4d | 1 | 0.67mi |
| 3326 E Marshall St Unit 1 Tulsa, OK | 2.0 | 1.0 | 700 | $825 | $1.18 | 24d | 1 | 0.68mi |
| 3326 E Marshall St Apt 4 Tulsa, OK | 2.0 | 1.0 | 750 | $925 | $1.23 | 24d | 1 | 0.68mi |
| 1807 N Atlanta Ave Tulsa, OK | 3.0 | 1.0 | 812 | $995 | $1.23 | 24d | 1 | 0.69mi |
| 3336 E Marshall St Unit 10 Tulsa, OK | 1.0 | 1.0 | 575 | $799 | $1.39 | 24d | 1 | 0.70mi |
| 3336 E Marshall St Unit 06 Tulsa, OK | 1.0 | 1.0 | 700 | $895 | $1.28 | 24d | 1 | 0.70mi |
| 1825 N College Ave Unit 13 Tulsa, OK | 1.0 | 1.0 | 675 | $745 | $1.10 | 24d | 1 | 0.74mi |
| 1928 N Columbia Pl Tulsa, OK | 2.0 | 1.0 | 888 | $1,000 | $1.13 | 16d | 1 | 0.75mi |
| 2529 E Admiral Pl Unit A Tulsa, OK | 2.0 | 1.0 | 1100 | $1,295 | $1.18 | 24d | 1 | 0.78mi |
| 3238 E Easton St Tulsa, OK | 2.0 | 1.0 | 800 | $1,150 | $1.44 | 4d | 1 | 0.82mi |
| 2808 E 1st Pl Unit P21-Q Tulsa, OK | 2.0 | 1.0 | 1025 | $1,250 | $1.22 | 24d | 1 | 0.97mi |
| 2132 N Atlanta Ave Tulsa, OK | 1.0 | 1.0 | 572 | $945 | $1.65 | 24d | 1 | 0.98mi |
| 44 S Florence Ave Tulsa, OK | 2.0 | 1.0 | 1080 | $1,450 | $1.34 | 24d | 1 | 1.00mi |
| 1830 N New Haven Ave Tulsa, OK | 2.0 | 1.0 | 840 | $1,295 | $1.54 | 24d | 1 | 1.15mi |
| 2532 E 4th St Tulsa, OK | 2.0 | 2.0 | 1088 | $800 | $0.74 | 24d | 1 | 1.17mi |
| 4008 E Virgin St Tulsa, OK | 3.0 | 1.0 | 1125 | $1,400 | $1.24 | 4d | 1 | 1.31mi |
| 2516 E 6th St Unit 2 Tulsa, OK | 1.0 | 1.0 | 630 | $999 | $1.59 | 4d | 1 | 1.43mi |
| 4703 E Latimer Pl Tulsa, OK | 2.0 | 1.0 | 1103 | $1,290 | $1.17 | 4d | 1 | 1.48mi |
| 2606 E 7th St Tulsa, OK | 1.0 | 1.0 | 625 | $1,125 | $1.80 | 4d | 1 | 1.48mi |
Listing history 15 events
-
2026-06-17days on market $21,000 Active 40 DOM
-
2026-06-16days on market $21,000 Active 39 DOM
-
2026-06-15days on market $21,000 Active 38 DOM
-
2026-06-13days on market $21,000 Active 36 DOM
-
2026-06-10days on market $21,000 Active 33 DOM
-
2026-06-09days on market $21,000 Active 32 DOM
-
2026-06-08days on market $21,000 Active 31 DOM
-
2026-06-07days on market $21,000 Active 30 DOM
-
2026-06-05days on market $21,000 Active 27 DOM
-
2026-06-03pricedays on market $21,000 Active 26 DOM
-
2026-06-02days on market $38,000 Active 25 DOM
-
2026-06-01days on market $38,000 Active 24 DOM
-
2026-05-31days on market $38,000 Active 23 DOM
-
2026-05-08$38,000 Active
-
1995-09-21soldstatus $8,000
ⓘ Source: listings_history table (triggers on properties + properties_extension) + one-shot
backfill from property_details.listing_events for pre-trigger history.
Tax reassessment forecast OK · Resets to sale price
- Current annual tax
- $206 · $17/mo
- Projected year-2 tax
- $206 · $17/mo
- Expected delta
- $0/yr ($0/mo · 0.0%)
ⓘ Screening estimate from a state-policy table — verify with the county assessor before closing.
Climate risk First Street
- Flood 1/10 Low FEMA zone X (unshaded) · 0% chance over 30 yrs
- Wildfire 1/10 Low
- Heat 6/10 Major 7 d/yr ≥110°F today · 18 d/yr by 30 yrs out
- Wind 2/10 Low 4% chance of damaging wind over 30 yrs
- Air quality 2/10 Low 2 unhealthy d/yr today · 2 by 30 yrs out
Nearby sold comps map
Loading sold comps map…
Walkable amenities ~0.75 mi
Loading nearby amenities…
Taxation est. · year 1
- Rental income
- $12,582
- − Mortgage interest
- −$1,176
- − Property taxes
- −$206
- − Insurance
- −$105
- − Repairs & maintenance
- −$1,007
- − Management
- −$1,007
- − Depreciation
- −$611
- Taxable income
- $8,471
- Est. tax owed @ 24.0%
- −$2,033
- After-tax cash flow
- $6,274/yr
For passive investors: Depreciation is non-cash, so a rental often shows a tax loss while cash-flowing — sheltering income. Rental losses are passive: they offset passive income freely, and up to $25,000/yr can offset ordinary (W-2) income if you actively participate and your MAGI is under $100k (phasing out to $0 by $150k); unused losses carry forward. On sale, claimed depreciation is recaptured at up to 25%, and gains may owe capital-gains tax (a 1031 exchange can defer both). Figures are a year-1 estimate at your 24.0% rate — not tax advice; consult a CPA.
Schools (NCES district)
- District
- Tulsa
- NCES district ID
- 4030240
- Math proficiency
- 7% ▼ -9.00%
- Reading proficiency
- 12% ▼ -7.00%
- Median HH income
- $37,895
- Composite
- 8.04/100
- National rank
- #9919
- State rank
- #250 of 270 in OK
Livability — Tulsa
- Score
- 75/100
- State rank
- #13
- US rank
- #4058
Category grades
Schools grade is shown separately in the Schools card above.
Census & demographics
- Census place
- Tulsa, OK
- County
- Tulsa County · 640,811 people
- City population
- 389,418
- Metro
- Tulsa, OK
- Population (ZIP)
- 15,244
- Household income
- $42,054
- Rent vs Own
- Severe rent burden
- 528.0
Population outlook (Tulsa County) Hauer SSP2
- Today (2025)
- 723,846 people
- By 2030
- 766,033 · +5.8%
- By 2040
- 851,386 · +17.6%
- By 2050
- 938,389 · +29.6%
- By 2075
- 1,166,011 · +61.1%
- By 2100
- 1,350,277 · +86.5%
Race, ethnicity, and origin ACS 2023
- Neighborhood character
- Highly diverse neighborhood (Simpson 0.72)
- Race & ethnicity
- Hispanic / Latino 40% White 24% Black 24% Two or more races 16% Native American 6%
- Hispanic origin (detail)
- Mexican 36%
- Common ancestry
- Slovak 1%
- Foreign-born
- 17% · Canada
- Languages at home
- 62% English-only · Spanish 37%
Political lean MEDSL · Tulsa
- 2024 margin
- R (+15.2) · D 41.3% · R 56.5% · Other 2.2%
- 2008→2024 swing
- +9.2pp toward D · 2008: -24.5pp · 2024: -15.2pp
- All cycles
- 2024: R+15.2 2020: R+15.6 2016: R+22.9 2012: R+27.4 2008: R+24.5
Not yet ingested
- Civics
- —
Market trends
- HPI YoY
- ▲ 8.69%
- Current HPI
- 277.6663
- Rent YoY
- ▲ 1.78%
- Metro
- Tulsa, OK
- State GDP YoY
- ▲ 1.55%
- F500 in state
- 6
Industry mix (Fortune 500 HQ in OK)
| Industry | F500 HQs | Revenue |
|---|---|---|
| Energy | 3 | $48B |
|
||
Price history
+375.0% since first listed2 events — show timeline
- 2026-05-08 Listed $38,000 MLS Technology, Inc.
- 1995-09-21 Sold (Public Records) $8,000 Public Records
Property tax history
-4.0%/yrLatest (2025): $206 · -68.7% YoY. Source: county tax records.
Cash-flow waterfall
monthlySold comps — $/sqft
last 12 mo · ≤1 miLoading sold comps…