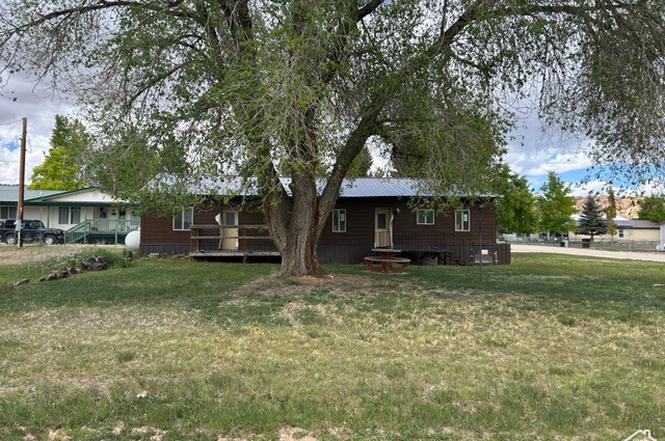
111 N 4th E · Manila, UT
Flood risk 1/10 · Minimal
- FEMA flood zone
- —
- Chance of flooding over 30 yrs
- 0.0%
- Est. flood insurance / yr
- —
Fire risk 4/10 · Minor
- Est. fire insurance / yr
- $453 – $841
Heat risk 2/10 · Minimal
- Hot days now (above 89°F)
- 7 days/yr
- Hot days in 30 yrs
- 19 days/yr
Wind risk 1/10 · Minimal
- Chance of severe wind over 30 yrs
- —
Air-quality risk 1/10 · Minimal
- Unhealthy air days now
- 0 days/yr
- Unhealthy air days in 30 yrs
- 0 days/yr
Risk factors via First Street. Map © Google.
Why this score? — see what drove the D- grade
The composite is a weighted blend of 9 inputs, each scored 0–100. Each bar is that input's sub-score; the figure is the points it added to the 100-point composite (weight × sub-score).
- Cash flow +8.1/30.0
- ARV discount +7.5/15.0
- Appreciation +5.8/10.0
- Schools +4.5/10.0
- Livability +3.1/5.0
- Rent growth +2.5/5.0
- Condition / age +2.5/5.0
- DSCR +2.2/10.0
- 1% rule +1.5/10.0
$179,900
🖨 Deal sheet 📄 Offer letter ✓ Due diligence
Listing remarks MLS
There are no remarks available.
Key facts
- Ldl smart siding
- Triple pane windows
- 9,583 sq ft lot
Tags
Property features AI
Finance
- Other: Property currently used as a single-family residence; Above-grade finished area reported
- Financial info: No additional financial details provided
- HOA & community: Located in Flaming Gorge Estates subdivision
Exterior
- Parking: RV parking
- Security: No specific security features provided
- Utilities: Natural gas connected; Electricity connected; Public sewer connected; Water connected (culinary)
- Home design: Mobile home; Ground-level access; Built/standing
- Construction: Composition exterior materials; Metal roof
- Exterior features: Covered patio; Open porch; Sliding glass doors; Exterior lighting; Triple-pane windows; Partially fenced yard; Corner lot; Landscaping in part; Mature trees; Flat terrain
Interior
- Kitchen: Gas range (free standing); Microwave; Range hood; Refrigerator
- Bedrooms: 3 main-level bedrooms
- Flooring: Carpet
- Bathrooms: 1 full bathroom
- Heating & cooling: Central gas heating; Propane heating available; Evaporative cooling
- Interior features: Primary bathroom; Gas range (free standing); Microwave; Range hood; Refrigerator; Blinds and drapes; Partial window coverings; Total of 8 rooms; No basement
- Laundry & utility: No specific laundry details provided
Neighborhood map
What this means for you Summary
Snapshot
- This is a 3-bed/1.0-bath manufactured listed at $180k.
Deal economics
- At list price, monthly cash flow is $-174 ($-2k/yr) — negative.
- To cash-flow at today's rent, offer at most $149k (17.1% below list).
- To meet the 1% rule (rent ≥ 1% of price), the offer needs to be $118k (34.6% below list).
- Recommended offer: $118k (34.6% below list) — sets the bar for 1% rule.
Location & tenants
- Location reads 61/100 on livability (#221 in UT) — a middle-class / working-renter tenant base. Strengths: employment A+, cost of living A+, crime A; Watch: amenities F, commute F, housing F.
- Daggett District (rural): math 45% / reading 55% proficiency, ranked #44 of 110 in UT (top 40%) — acceptable for families but not a draw, mixed tenant base, ~2y average lease; only 17% free/reduced lunch — higher-income household profile.
- Zoned schools: Manila School (math 34% / reading 54%, grade F, #240 of 585 statewide, top 43%, 79 students, 14% FRL); Manila High (math 34% / reading 54%, grade F, #45 of 171 statewide, top 28%, 112 students, 19% FRL) — zoned schools at 16% FRL track the district average.
- Market conditions: 26 active listings in the ZIP; 18 units permitted in Daggett County in 2024 (0 in 5+ unit buildings).
Forward outlook
- In year one you build about $4k of equity ($1k loan paydown + $3k appreciation (1.5% local appreciation)).
- Daggett County population projected at +16% by 2050 — long-run rental-demand tailwind backs the buy-and-hold thesis.
- By year 8, paydown + projected appreciation supports a ~$30k cash-out refi (75% LTV) — recoverable capital for the next deal without selling this one.
Negotiation context
- It's been on market 259 days — a 12% lower offer ($158k) is reasonable based on typical stale-listing flexibility.
- 4 sale attempts since 8y ago; this cycle's ask has dropped $10k (5%) from the opening price — seller is motivated, your offer sets the floor, not the list.
Questions for the listing agent
- What do current leases actually rent for vs. the listed asking? Can we see a recent rent roll and the last 12 months of T-12 income?
- It's been on market 259 days. Have you received any prior offers? Is the seller open to a 35% concession, seller financing, or rate buy-down credit?
- Built in 1969 — when were the roof, HVAC, electrical panel, plumbing, and water heater last replaced?
- Why hasn't it sold? Are there any deal-killer items the seller is aware of (foundation, flood, title, zoning, code violations)?
- Is there a deadline driving the sale (1031 exchange, divorce, estate, relocation)? That informs how much negotiation room exists.
- Schools are B-rated — typically a magnet for longer-tenancy family renters. What's the average tenant stay here, and is there a school-zone premium baked into asking?
- The area grade is low — what's the realistic commute time and amenity access for the typical tenant pool here? Any planned neighborhood developments (good or bad) we should know about?
- What's the average days-on-market for RENTAL listings here right now (not sales)? A rising rental-DOM trend means longer vacancies and softer asking-rent achievability than the comps imply.
- What's the recent tenant-quality profile in this submarket — average credit score on applications, eviction rate, late-payment / NSF rate, and stable-employment percentage? A property-management company in the area should have these aggregated.
- How much new for-sale + rental construction is in the pipeline within 1–3 miles? Heavy new supply typically softens prices + rents 12–24 months out; constrained supply supports both.
Investment metrics
- 1% rule
- 0.65% ✗
- Cap rate
- 5.13%
- Cash-on-cash
- -4.14%
- DSCR
- 0.82
- GRM
- 12.7
CMA / ARV
No comps found within radius.
Projected returns pro-forma
1.52% appreciation · 3.0% rent growth · sell at horizon
- IRR
- -1.2%
- Equity multiple
- 0.94×
- Total profit
- $-3,123
- Equity at exit
- $66,372
- IRR
- 3.4%
- Equity multiple
- 1.44×
- Total profit
- $22,386
- Equity at exit
- $92,171
Cash invested: $50,372 (down + closing). Projections, not guarantees.
Landlord ↔ Tenant lean methodology
- Overall (STATE)
- 86 Strongly Landlord-Friendly
- State Utah
- 86 Strongly Landlord-Friendly · R+15
- County
- — inherits STATE
- City
- — inherits STATE
ZIP-level market 84046
- Home prices YoY
- 1.4%
- Active inventory
- 26
- Price-to-rent
- 12.7×
Monthly cashflow live
- Estimated rent
- $1,176 medium interval (Pro) →
- Mortgage (P&I)
- −$943
- Tax from tax record
- −$85 /mo · $1,019/yr
- Insurance
- −$75
- HOA
- −$0
- Vacancy / Maint / Mgmt
- −$247
- Net cashflow
- $-174
Break-even live
UW: 25.0% down · 7.5% · 30yr · 1.5% tax · 5.0% vac · 8.0% maint · 8.0% mgmt
Financing live
Cash to close
- Down payment
- $44,975
- Closing costs
- $5,397
- Reserves months
- —
- Total cash needed
- —
Loan-product check · same deal, 3 products live
Conventional
25% down · 7.5% · 30yr
- Down + closing
- —
- Monthly P&I
- —
- Monthly cashflow
- —
- DSCR
- —
- Eligible?
- —
Personal DTI + credit; lowest rate.
DSCR
20% down · 8.5% · 30yr
- Down + closing
- —
- Monthly P&I
- —
- Monthly cashflow
- —
- DSCR
- —
- Eligible?
- —
No personal income docs; deal must DSCR.
Hard money
10% down · 12.0% · 12mo
- Down + closing
- —
- Monthly P&I
- —
- Monthly cashflow
- —
- DSCR
- —
- Eligible?
- —
Short-term bridge; refi at stabilization.
Listing history 27 events
-
2026-06-19days on market $179,900 Active 259 DOM
-
2026-06-18days on market $179,900 Active 258 DOM
-
2026-06-17days on market $179,900 Active 257 DOM
-
2026-06-16days on market $179,900 Active 256 DOM
-
2026-06-15days on market $179,900 Active 255 DOM
-
2026-06-14days on market $179,900 Active 253 DOM
-
2026-06-12days on market $179,900 Active 252 DOM
-
2026-06-09days on market $179,900 Active 249 DOM
-
2026-06-08days on market $179,900 Active 248 DOM
-
2026-06-07days on market $179,900 Active 247 DOM
-
2026-06-03days on market $179,900 Active 243 DOM
-
2026-06-02days on market $179,900 Active 242 DOM
-
2026-06-01price $179,900 Active 241 DOM
-
2026-06-01days on market $189,900 Active 241 DOM
-
2026-05-31days on market $189,900 Active 240 DOM
-
2026-05-30days on market $189,900 Active 239 DOM
-
2026-04-11status Active
-
2025-12-02historical
-
2025-11-08status Active
-
2025-11-06historical
-
2025-08-07price $189,900
-
2025-06-25price $209,900
-
2025-05-27price $229,900
-
2025-05-25$189,900 Active
-
2018-04-09soldstatus Sold 31-char remark
Show marketing remark (31 chars)
There are no remarks available.
-
2018-03-02status Under Contract 31-char remark
Show marketing remark (31 chars)
There are no remarks available.
-
2018-01-01$44,500 Active 31-char remark
Show marketing remark (31 chars)
There are no remarks available.
ⓘ Source: listings_history table (triggers on properties + properties_extension) + one-shot
backfill from property_details.listing_events for pre-trigger history.
Tax reassessment forecast UT · Resets to sale price
- Current annual tax
- $1,019 · $85/mo
- Projected year-2 tax
- $1,187 · $99/mo
- Expected delta
- +$168/yr (+$14/mo · 16.5%)
ⓘ Screening estimate from a state-policy table — verify with the county assessor before closing.
Climate risk First Street
- Flood 1/10 Low 0% chance over 30 yrs
- Wildfire 4/10 Moderate
- Heat 2/10 Low 7 d/yr ≥89°F today · 19 d/yr by 30 yrs out
- Wind 1/10 Low
- Air quality 1/10 Low 0 unhealthy d/yr today · 0 by 30 yrs out
Nearby sold comps map
Loading sold comps map…
Walkable amenities ~0.75 mi
Loading nearby amenities…
Taxation est. · year 1
- Rental income
- $14,117
- − Mortgage interest
- −$10,077
- − Property taxes
- −$1,019
- − Insurance
- −$900
- − Repairs & maintenance
- −$1,129
- − Management
- −$1,129
- − Depreciation
- −$5,233
- Taxable loss
- −$5,371
- Est. tax savings @ 24.0%
- +$1,289
- After-tax cash flow
- $-798/yr
For passive investors: Depreciation is non-cash, so a rental often shows a tax loss while cash-flowing — sheltering income. Rental losses are passive: they offset passive income freely, and up to $25,000/yr can offset ordinary (W-2) income if you actively participate and your MAGI is under $100k (phasing out to $0 by $150k); unused losses carry forward. On sale, claimed depreciation is recaptured at up to 25%, and gains may owe capital-gains tax (a 1031 exchange can defer both). Figures are a year-1 estimate at your 24.0% rate — not tax advice; consult a CPA.
Schools (NCES district)
- District
- Daggett District
- NCES district ID
- 4900180
- Math proficiency
- 45% ▬ 0.00%
- Reading proficiency
- 55% ▬ 0.00%
- Median HH income
- $51,980
- Composite
- 44.97/100
- National rank
- #5870
- State rank
- #44 of 110 in UT
Livability — Manila
- Score
- 61/100
- State rank
- #221
- US rank
- #18432
Category grades
Schools grade is shown separately in the Schools card above.
Census & demographics
- Census place
- Manila, UT
- Population (ZIP)
- 651
Population outlook (Daggett County) Hauer SSP2
- Today (2025)
- 1,247 people
- By 2030
- 1,302 · +4.4%
- By 2040
- 1,385 · +11.1%
- By 2050
- 1,444 · +15.8%
- By 2075
- 1,541 · +23.6%
- By 2100
- 1,362 · +9.2%
Race, ethnicity, and origin ACS 2023
- Neighborhood character
- Predominantly White (92%)
- Race & ethnicity
- White 92% Two or more races 6% Hispanic / Latino 3% Native American 2%
- Common ancestry
- Slovak 9% Italian 2% Lithuanian 2%
- Foreign-born
- 1% · Canada
- Languages at home
- 97% English-only · Spanish 1%
Political lean MEDSL · Daggett
- 2024 margin
- Solid R (+62.2) · D 18.4% · R 80.5% · Other 1.1%
- 2008→2024 swing
- -24.4pp toward R · 2008: -37.8pp · 2024: -62.2pp
- All cycles
- 2024: R+62.2 2020: R+62.2 2016: R+54.0 2012: R+60.5 2008: R+37.8
Not yet ingested
- Civics
- —
Market trends
- HPI YoY
- ▲ 1.52%
- Current HPI
- 111.1561
- Rent YoY
- —
- Metro
- —
- State GDP YoY
- ▲ 3.54%
- F500 in state
- 2
Industry mix (Fortune 500 HQ in UT)
| Industry | F500 HQs | Revenue |
|---|---|---|
| Financial Services | 1 | $3B |
|
||
Price history
+326.7% since first listed11 events — show timeline
- 2026-04-11 Relisted — WFRMLS
- 2025-12-02 Listing Removed — WFRMLS
- 2025-11-08 Relisted — WFRMLS
- 2025-11-06 Listing Removed — WFRMLS
- 2025-08-07 Price Changed $189,900 WFRMLS
- 2025-06-25 Price Changed $209,900 WFRMLS
- 2025-05-27 Price Changed $229,900 WFRMLS
- 2025-05-25 Listed $189,900 WFRMLS
- 2018-04-09 Sold (MLS) — WFRMLS
- 2018-03-02 Pending — WFRMLS
- 2018-01-01 Listed $44,500 WFRMLS
Property tax history
+3.1%/yrLatest (2025): $1,019 · +1.2% YoY. Source: county tax records.
Cash-flow waterfall
monthlySold comps — $/sqft
last 12 mo · ≤1 miLoading sold comps…