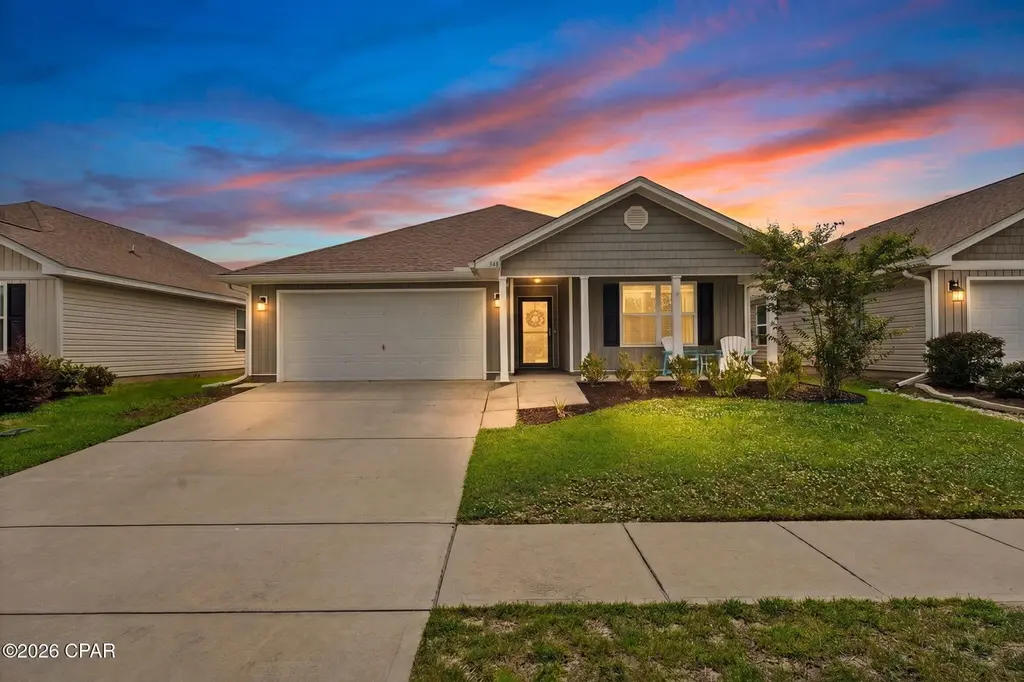
348 Bridge Harbor Dr · Callaway, FL
Flood risk 6/10 · Moderate
- FEMA flood zone
- X (unshaded)
- Chance of flooding over 30 yrs
- 0.68%
- Est. flood insurance / yr
- $507 – $1,088
Fire risk 4/10 · Minor
- Est. fire insurance / yr
- $947 – $1,759
Heat risk 10/10 · Severe
- Hot days now (above 104°F)
- 7 days/yr
- Hot days in 30 yrs
- 21 days/yr
Wind risk 10/10 · Severe
- Chance of severe wind over 30 yrs
- 99.0%
Air-quality risk 1/10 · Minimal
- Unhealthy air days now
- 0 days/yr
- Unhealthy air days in 30 yrs
- 0 days/yr
Risk factors via First Street. Map © Google.
Why this score? — see what drove the C- grade
The composite is a weighted blend of 9 inputs, each scored 0–100. Each bar is that input's sub-score; the figure is the points it added to the 100-point composite (weight × sub-score).
- Cash flow +17.7/30.0
- ARV discount +12.1/15.0
- DSCR +5.5/10.0
- Schools +4.3/10.0
- 1% rule +3.9/10.0
- Livability +3.2/5.0
- Rent growth +2.8/5.0
- Condition / age +2.5/5.0
- Appreciation +0.0/10.0
$294,900
🖨 Deal sheet (PDF) 📄 Offer letter ✓ Due diligence
Listing remarks
Welcome to this beautifully designed 4-bedroom, 2-bathroom home located in the highly desirable Bridge Harbor community, close to Tyndall AFB. Featuring an open-floor plan, this home offers spacious living areas perfect for both everyday living and entertaining. Vinyl flooring flows throughout the main living spaces, while plush carpet adds comfort to each bedroom. The split-bedroom layout provides privacy, with a spacious primary suite featuring his-and-her walk-in closets, a double vanity, and a walk-in shower. The well-appointed kitchen is the heart of the home, complete with stainless steel appliances, a large island, breakfast bar, and walk-in pantry. The living room showcases a custom
Key facts
- 5,227 sq ft lot
- 2 garage spots
- Community pool
Property features AI
Finance
- HOA & community: Homeowners association; Community pool
Exterior
- Parking: Detached garage with 2 garage spaces
- Utilities: Public sewer
- Home design: Single-family residence; Resid Single Family zoning
- Construction: Vinyl siding; Composition/shingle roof; Slab foundation; Built on a 0.13-acre lot (approx. 50 ft x 110 ft)
- Exterior features: Porch; Screened porch; Fenced yard with privacy fencing; Paved lot
Interior
- Kitchen: Electric oven; Electric range
- Bedrooms: Primary and all bedrooms on the first floor; Bedroom sizes include: 13 x 10; 13 x 10.1; 12.4 x 11; primary/other room 17.4 x 15.8
- Bathrooms: 2 full bathrooms
- Heating & cooling: Central heating (electric); Central air conditioning; Ceiling fan(s)
- Interior features: Double vanity; Main-level primary bedroom; Walk-in closet(s)
- Laundry & utility: Electric water heater
Neighborhood map
What this means for you Summary
Snapshot
- This is a 4-bed/2.0-bath single-family listed at $295k.
Deal economics
- At list price, monthly cash flow is $238 ($3k/yr) — positive.
- The deal already cash-flows at list — no discount required.
- To meet the 1% rule (rent ≥ 1% of price), the offer needs to be $263k (11.0% below list).
- Recommended offer: $263k (11.0% below list) — sets the bar for 1% rule.
- Cap rate 7.3% vs local median 5.1% in Callaway — top-decile yield for the area; either an underpriced asset or a hidden risk that comps aren't pricing in. Stress-test before assuming the spread holds.
Location & tenants
- Location reads 64/100 on livability (#690 in FL) — a middle-class / working-renter tenant base. Strengths: cost of living A+, housing A+; Watch: employment D+, amenities F, commute F.
- Bay (suburban): math 51% / reading 51% proficiency, ranked #29 of 73 in FL (top 40%) — acceptable for families but not a draw, mixed tenant base, ~2y average lease.
- Zoned schools: Parker Elementary School (math 24% / reading 32%, grade F, #1,951 of 2,144 statewide, top 91%, 496 students, 74% FRL); Rutherford High School (math 24% / reading 29%, grade F, #489 of 667 statewide, top 74%, 1,337 students, 63% FRL) — zoned schools average 69% FRL vs 48% district-wide (20 pts higher); higher-poverty schools than district average — tighter screening recommended.
- Zoned-school proficiency averages 27% at this address vs 51% district-wide (-24 pts) — the specific schools serving this property underperform the Bay average; the district grade overstates school quality for this exact location.
- Market conditions: Rents rising (+1.1%/yr); 983 active listings in the ZIP; 7 comparable units currently listed for rent nearby; rentals at typical pace (median 23d on market — plan ~3-4 weeks tenant-placement turnaround); 2,473 units permitted in Bay County in 2024 (559 in 5+ unit buildings).
- This rent runs 42% of the median local income ($75k/yr) — at the standard rent-burdened threshold; future hikes will face affordability resistance.
Forward outlook
- Local home prices are declining (-3.0%/yr); year-one equity from $2k of loan paydown is wiped out by about $9k of value loss. Plan a longer hold.
- Bay County population projected at +24% by 2050 — long-run rental-demand tailwind backs the buy-and-hold thesis.
Negotiation context
- Only 8 days on market — expect competitive offers; lowballing is unlikely to land.
Risks & watch-outs
- Climate carrying-cost: major flood risk; severe wind risk, 99% chance of damaging wind over 30y; extreme-heat days projected 7→21/yr by 2055 (HVAC capex compounding) — expect insurance premiums to compound above CPI over the hold.
Questions for the listing agent
- Is there a deadline driving the sale (1031 exchange, divorce, estate, relocation)? That informs how much negotiation room exists.
- Schools are F-rated, which usually means shorter tenancies and higher turnover. Who's the typical renter profile here, and what's been the actual vacancy rate?
- What's the average days-on-market for RENTAL listings here right now (not sales)? A rising rental-DOM trend means longer vacancies and softer asking-rent achievability than the comps imply.
- What's the recent tenant-quality profile in this submarket — average credit score on applications, eviction rate, late-payment / NSF rate, and stable-employment percentage? A property-management company in the area should have these aggregated.
- How much new for-sale + rental construction is in the pipeline within 1–3 miles? Heavy new supply typically softens prices + rents 12–24 months out; constrained supply supports both.
Investment metrics
- 1% rule
- 0.89% ✗
- Cap rate
- 7.26%
- Cash-on-cash
- 3.45%
- DSCR
- 1.15
- GRM
- 9.4
CMA / ARV
- ARV (on-the-fly)
- $328,350
- Comps found
- 12
Show comp detail 12 sales within ~0.75 mi
| Address | Dist | Beds/Ba | Sqft | Sold | Price | $/sf | Match |
|---|---|---|---|---|---|---|---|
| 498 Albert Meadow Ln | 0.23mi | 4/2.0 | 1,827 (-8%) | 2mo | $302,000 | $165 | 74 |
| 343 Highbrook Rd | 0.18mi | 4/2.0 | 1,827 (-8%) | 4mo | $285,000 | $156 | 74 |
| 140 Carriage Rd | 0.11mi | 4/3.5 | 2,147 (+8%) | 5mo | $495,000 | $231 | 72 |
| 468 Eagle Lake Way | 0.23mi | 4/2.5 | 2,151 (+8%) | 4mo | $311,000 | $145 | 70 |
| 6689 Wallace Rd | 0.50mi | 4/2.5 | 1,934 (-3%) | 2mo | $422,987 | $219 | 68 |
| 1257 S Katherine Ave | 0.54mi | 4/2.5 | 1,934 (-3%) | 4mo | $402,000 | $208 | 65 |
| 239 Ryder Ln | 0.44mi | 4/2.0 | 1,827 (-8%) | 3mo | $299,900 | $164 | 63 |
| 917 Plantation Dr | 0.57mi | 4/2.0 | 2,154 (+8%) | 2mo | $265,000 | $123 | 58 |
| 6697 Wallace Rd | 0.48mi | 3/2.0 (-1) | 1,862 (-6%) | 6mo | $370,000 | $199 | 57 |
| 6705 Pridgen St | 0.65mi | 4/2.5 | 1,783 (-10%) | 1mo | $275,500 | $155 | 50 |
| 7024 Mike Ln | 0.46mi | 3/2.0 (-1) | 1,702 (-14%) | 3mo | $230,000 | $135 | 47 |
| 7405 Ray Glenn Cir | 0.59mi | 3/2.0 (-1) | 1,756 (-12%) | 3mo | $325,000 | $185 | 46 |
Match score weights: distance 35% · size 25% · config 20% · recency 20%. Top-matched comps best support the ARV.
Projected returns pro-forma
-3.0% appreciation · 1.12% rent growth · sell at horizon
- IRR
- -12.9%
- Equity multiple
- 0.54×
- Total profit
- $-37,606
- Equity at exit
- $43,971
- IRR
- -6.8%
- Equity multiple
- 0.60×
- Total profit
- $-32,857
- Equity at exit
- $25,498
Cash invested: $82,572 (down + closing). Projections, not guarantees.
Landlord ↔ Tenant lean methodology
- Overall (STATE)
- 87 Strongly Landlord-Friendly
- State Florida
- 87 Strongly Landlord-Friendly · R+3
- County
- — inherits STATE
- City
- — inherits STATE
ZIP-level market 32404
- Home prices YoY
- -16.1%
- Rents YoY
- 1.1%
- Active inventory
- 983
- Price-to-rent
- 9.4×
Monthly cashflow live
- Estimated rent
- $2,625 high interval (Pro) →
- Mortgage (P&I)
- −$1,546
- Tax from tax record
- −$167 /mo · $2,004/yr
- Insurance
- −$123
- HOA
- −$0
- Vacancy / Maint / Mgmt
- −$551
- Net cashflow
- $238
Break-even live
Sensitivity live
| Price | -10% $405 | -5% $321 | +0% $238 | +5% $154 | +10% $71 |
|---|---|---|---|---|---|
| Rent | -10% $30 | -5% $134 | +0% $238 | +5% $341 | +10% $445 |
| Rate | -1.0pp $386 | -0.5pp $313 | base $238 | +0.5pp $161 | +1.0pp $84 |
UW: 25.0% down · 7.5% · 30yr · 1.5% tax · 5.0% vac · 8.0% maint · 8.0% mgmt
Financing live
Cash to close
- Down payment
- $73,725
- Closing costs
- $8,847
- Reserves months
- —
- Total cash needed
- —
Loan-product check · same deal, 3 products live
Conventional
25% down · 7.5% · 30yr
- Down + closing
- —
- Monthly P&I
- —
- Monthly cashflow
- —
- DSCR
- —
- Eligible?
- —
Personal DTI + credit; lowest rate.
DSCR
20% down · 8.5% · 30yr
- Down + closing
- —
- Monthly P&I
- —
- Monthly cashflow
- —
- DSCR
- —
- Eligible?
- —
No personal income docs; deal must DSCR.
Hard money
10% down · 12.0% · 12mo
- Down + closing
- —
- Monthly P&I
- —
- Monthly cashflow
- —
- DSCR
- —
- Eligible?
- —
Short-term bridge; refi at stabilization.
Rent comps 7 comps
| Address | Beds | Baths | Sqft | Rent | $/sqft | DOM | Units | Dist |
|---|---|---|---|---|---|---|---|---|
| 140 Carriage Rd Panama City, FL | 4.0 | 3.5 | 2147 | $2,800 | $1.30 | 23d | 1 | 0.12mi |
| 133 Red Bay Rd Panama City, FL | 4.0 | 2.0 | 2208 | $2,500 | $1.13 | 23d | 1 | 0.20mi |
| 138 Ryder Ln Panama City, FL | 5.0 | 3.0 | 2552 | $2,700 | $1.06 | 23d | 1 | 0.28mi |
| 907 Lee Ct Panama City, FL | 3.0 | 3.0 | 2126 | $2,100 | $0.99 | 23d | 1 | 0.74mi |
| 7709 Betty Louise Dr Panama City, FL | 3.0 | 2.0 | 1310 | $1,800 | $1.37 | 23d | 1 | 0.96mi |
| 7727 Betty Louise Dr Panama City, FL | 3.0 | 2.0 | 1430 | $1,950 | $1.36 | 23d | 1 | 1.08mi |
| 1128 S Gay Ave Lot 146 Panama City, FL | 3.0 | 2.0 | 1536 | $20,000 | $13.02 | 23d | 1 | 1.20mi |
Listing history 8 events
-
2026-06-21days on market $294,900 Active 8 DOM
-
2026-06-19days on market $294,900 Active 6 DOM
-
2026-06-18days on market $294,900 Active 5 DOM
-
2026-06-17days on market $294,900 Active 4 DOM
-
2026-06-16days on market $294,900 Active 3 DOM
-
2026-06-15days on market $294,900 Active 2 DOM
-
2026-06-14remarks 699-char remark
-
2026-06-14$294,900 Active 1 DOM
ⓘ Source: listings_history table (triggers on properties + properties_extension) + one-shot
backfill from property_details.listing_events for pre-trigger history.
Tax reassessment forecast FL · Resets to sale price
- Current annual tax
- $2,004 · $167/mo
- Projected year-2 tax
- $2,448 · $204/mo
- Expected delta
- +$444/yr (+$37/mo · 22.1%)
ⓘ Screening estimate from a state-policy table — verify with the county assessor before closing.
Climate risk First Street
- Flood 6/10 Major FEMA zone X (unshaded) · 68% chance over 30 yrs
- Wildfire 4/10 Moderate
- Heat 10/10 Extreme 7 d/yr ≥104°F today · 21 d/yr by 30 yrs out
- Wind 10/10 Extreme 99% chance of damaging wind over 30 yrs
- Air quality 1/10 Low 0 unhealthy d/yr today · 0 by 30 yrs out
Nearby sold comps map
Loading sold comps map…
Walkable amenities ~0.75 mi
Loading nearby amenities…
Taxation est. · year 1
- Rental income
- $31,505
- − Mortgage interest
- −$16,519
- − Property taxes
- −$2,004
- − Insurance
- −$1,474
- − Repairs & maintenance
- −$2,520
- − Management
- −$2,520
- − Depreciation
- −$8,579
- Taxable loss
- −$2,112
- Est. tax savings @ 24.0%
- +$507
- After-tax cash flow
- $3,359/yr
For passive investors: Depreciation is non-cash, so a rental often shows a tax loss while cash-flowing — sheltering income. Rental losses are passive: they offset passive income freely, and up to $25,000/yr can offset ordinary (W-2) income if you actively participate and your MAGI is under $100k (phasing out to $0 by $150k); unused losses carry forward. On sale, claimed depreciation is recaptured at up to 25%, and gains may owe capital-gains tax (a 1031 exchange can defer both). Figures are a year-1 estimate at your 24.0% rate — not tax advice; consult a CPA.
Schools (NCES district)
- District
- Bay
- NCES district ID
- 1200090
- Math proficiency
- 51% ▼ -8.00%
- Reading proficiency
- 51% ▼ -7.00%
- Median HH income
- $47,740
- Composite
- 43.41/100
- National rank
- #3014
- State rank
- #29 of 73 in FL
Livability — Callaway
- Score
- 64/100
- State rank
- #690
- US rank
- #14384
Category grades
Schools grade is shown separately in the Schools card above.
Census & demographics
- Census place
- Callaway, FL
- County
- Bay County · 163,593 people
- Metro
- Panama City, FL
- Population (ZIP)
- 42,514
- Household income
- $74,708
- Rent vs Own
- Severe rent burden
- 1218.0
Population outlook (Bay County) Hauer SSP2
- Today (2025)
- 206,264 people
- By 2030
- 217,740 · +5.6%
- By 2040
- 238,738 · +15.7%
- By 2050
- 255,545 · +23.9%
- By 2075
- 288,295 · +39.8%
- By 2100
- 288,638 · +39.9%
Race, ethnicity, and origin ACS 2023
- Neighborhood character
- Predominantly White (69%)
- Race & ethnicity
- White 69% Black 12% Two or more races 10% Hispanic / Latino 9% Asian 3%
- Hispanic origin (detail)
- Mexican 2% Puerto Rican 3%
- Common ancestry
- Lithuanian 3% Slovak 2% Italian 2%
- Foreign-born
- 7% · Canada, Vietnam, Mexico
- Languages at home
- 90% English-only · Spanish 6% Vietnamese 1% Other Asian/Pacific 1%
Political lean MEDSL · Bay
- 2024 margin
- Solid R (+47.4) · D 25.8% · R 73.1% · Other 1.1%
- 2008→2024 swing
- -6.6pp toward R · 2008: -40.7pp · 2024: -47.4pp
- All cycles
- 2024: R+47.4 2020: R+43.5 2016: R+46.3 2012: R+43.6 2008: R+40.7
Not yet ingested
- Civics
- —
Market trends
- HPI YoY
- ▼ -50.59%
- Current HPI
- 263.7178
- Rent YoY
- ▲ 1.12%
- Metro
- Panama City, FL
- State GDP YoY
- ▲ 3.28%
- F500 in state
- 36
Industry mix (Fortune 500 HQ in FL)
| Industry | F500 HQs | Revenue |
|---|---|---|
| Industrial Technology | 2 | $29B |
|
||
| Insurance | 2 | $17B |
|
||
| Retail | 1 | $60B |
|
||
| Technology Distribution | 1 | $58B |
|
||
| Homebuilding | 1 | $35B |
|
||
| Technology Manufacturing | 1 | $35B |
|
||
Price history
1 event — show timeline
- 2026-06-12 Listed $294,900 CPARMLS
Property tax history
+45.7%/yrLatest (2025): $2,004 · +3.4% YoY. Source: county tax records.
Cash-flow waterfall
monthlySold comps — $/sqft
last 12 mo · ≤1 miLoading sold comps…