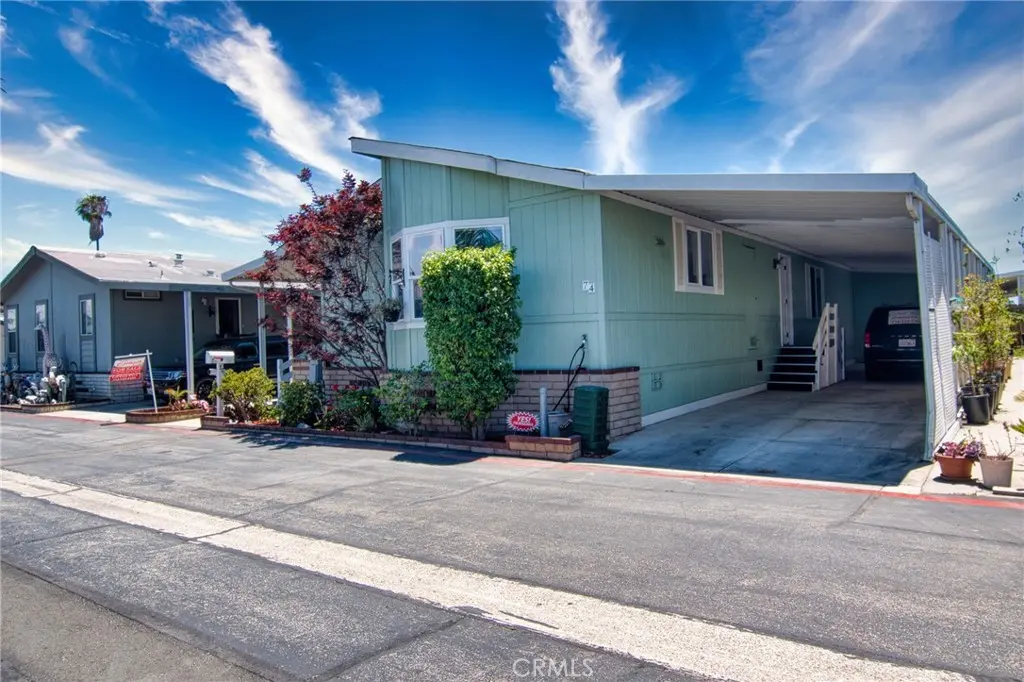
16444 Bolsa Chica Ave #74 · Huntington Beach, CA
Flood risk 1/10 · Minimal
- FEMA flood zone
- X (shaded)
- Chance of flooding over 30 yrs
- 0.0%
- Est. flood insurance / yr
- $507 – $1,088
Fire risk 4/10 · Minor
- Est. fire insurance / yr
- $659 – $1,223
Heat risk 5/10 · Moderate
- Hot days now (above 85°F)
- 7 days/yr
- Hot days in 30 yrs
- 22 days/yr
Wind risk 1/10 · Minimal
- Chance of severe wind over 30 yrs
- —
Air-quality risk 4/10 · Minor
- Unhealthy air days now
- 5 days/yr
- Unhealthy air days in 30 yrs
- 7 days/yr
Risk factors via First Street. Map © Google.
Why this score? — see what drove the B- grade
The composite is a weighted blend of 9 inputs, each scored 0–100. Each bar is that input's sub-score; the figure is the points it added to the 100-point composite (weight × sub-score).
- Cash flow +30.0/30.0
- 1% rule +10.0/10.0
- DSCR +10.0/10.0
- Schools +5.5/10.0
- Livability +3.4/5.0
- Rent growth +3.0/5.0
- Condition / age +2.5/5.0
- ARV discount +1.5/15.0
- Appreciation +0.0/10.0
$259,500
🖨 Deal sheet 📄 Offer letter ✓ Due diligence
Listing remarks
Welcome to this beautifully remodeled coastal home in the highly desirable Skandia Mobile Country Club, a premier 55+ community just minutes from the beach, restaurants, shopping, and everyday conveniences. A charming front deck with brick steps leads to an expansive covered porch, perfect for relaxing and enjoying the coastal breeze. Inside, you'll find a bright, open-concept floor plan featuring soaring ceilings, abundant natural light, fresh interior paint, and a spacious living area designed for comfort and entertaining. The stunning kitchen serves as the heart of the home, showcasing a large quartz island with bar seating, a cozy breakfast nook with a bay window, brand-new stainless st
Key facts
- Cozy breakfast nook
- Private back patio
- Large quartz island
Tags
Property features AI
Finance
- Other: Living area source: public records; Lot described as 0-1 unit/acre; Elevation units in feet
- Financial info: Monthly land lease of $2,670 (park-managed)
- HOA & community: Senior community; Park name: Skandia Country Clubb; Manager approval required; Pets allowed
Exterior
- Parking: Attached carport
- Utilities: Public sewer; District/public water
- Home design: Single-story; Mobile home (Advantage model, double wide); Mobile home remains on site
- Construction: Mobile home dimensions approximately 28 x 56; Year built (per public records)
- Exterior features: Community pool; Curbs
Interior
- Kitchen: Garbage disposal; Refrigerator; Dishwasher
- Bedrooms: Main floor primary bedroom
- Bathrooms: 2 full bathrooms
- Heating & cooling: Central cooling
- Interior features: Street-level entry; Community spa
- Laundry & utility: In-unit laundry (see remarks)
Neighborhood map
What this means for you Summary
Snapshot
- This is a 3-bed/2.0-bath manufactured listed at $260k.
Deal economics
- At list price, monthly cash flow is $1k ($17k/yr) — positive.
- The deal already cash-flows at list — no discount required.
- Meets the 1% rule at list price ($4k rent vs $260k).
- Cap rate 12.7% vs local median 1.6% in Huntington Beach — top-decile yield for the area; either an underpriced asset or a hidden risk that comps aren't pricing in. Stress-test before assuming the spread holds.
Location & tenants
- Location reads 67/100 on livability (#306 in CA) — a middle-class / working-renter tenant base. Strengths: employment A+, commute A-, schools B+; Watch: amenities C-, cost of living F, health & safety F.
- Ocean View (suburban): math 57% / reading 63% proficiency, ranked #207 of 1,400 in CA (top 15%) — acceptable for families but not a draw, mixed tenant base, ~2y average lease.
- Market conditions: Rents rising (+2.2%/yr); 83 active listings in the ZIP; 30 comparable units currently listed for rent nearby; rentals leasing fast (median 3d on market — plan ~1-2 weeks tenant-placement turnaround); high-income renter base; 6,974 units permitted in Orange County in 2024 (3,839 in 5+ unit buildings).
- This rent runs 39% of the median local income ($123k/yr) — at the standard rent-burdened threshold; future hikes will face affordability resistance.
Forward outlook
- Local home prices are declining (-3.0%/yr); year-one equity from $2k of loan paydown is wiped out by about $8k of value loss. Plan a longer hold.
- Orange County population projected at +14% by 2050 — modest demand growth; plan on rents tracking national, not racing it.
- At projected returns (-3.0% appreciation + 2.2% rent growth), your $73k cash investment doubles in ~6 years — after that, you're playing with house money.
Negotiation context
- Only 10 days on market — expect competitive offers; lowballing is unlikely to land.
Risks & watch-outs
- Climate carrying-cost: extreme-heat days projected 7→22/yr by 2055 (HVAC capex compounding) — expect insurance premiums to compound above CPI over the hold.
Questions for the listing agent
- Is there a deadline driving the sale (1031 exchange, divorce, estate, relocation)? That informs how much negotiation room exists.
- Schools are B-rated — typically a magnet for longer-tenancy family renters. What's the average tenant stay here, and is there a school-zone premium baked into asking?
- What's the average days-on-market for RENTAL listings here right now (not sales)? A rising rental-DOM trend means longer vacancies and softer asking-rent achievability than the comps imply.
- What's the recent tenant-quality profile in this submarket — average credit score on applications, eviction rate, late-payment / NSF rate, and stable-employment percentage? A property-management company in the area should have these aggregated.
- How much new for-sale + rental construction is in the pipeline within 1–3 miles? Heavy new supply typically softens prices + rents 12–24 months out; constrained supply supports both.
Investment metrics
- 1% rule
- 1.55% ✓
- Cap rate
- 12.68%
- Cash-on-cash
- 22.82%
- DSCR
- 2.02
- GRM
- 5.4
CMA / ARV
- ARV (on-the-fly)
- $228,984
- Comps found
- 9
Show comp detail 9 sales within ~0.75 mi
| Address | Dist | Beds/Ba | Sqft | Sold | Price | $/sf | Match |
|---|---|---|---|---|---|---|---|
| 16444 Bolsa Chica St #14 | 0.00mi | 2/2.0 (-1) | 1,620 (-0%) | 12mo | $265,000 | $164 | 84 |
| 16444 Bolsa Chica St #95 | 0.00mi | 3/2.0 | 1,600 (-2%) | 19mo | $109,900 | $69 | 82 |
| 16444 Bolsa Chica St #84 | 0.00mi | 3/2.0 | 1,600 (-2%) | 20mo | $129,000 | $81 | 80 |
| 16444 Bolsa Chica St #20 | 0.00mi | 3/2.0 | 1,680 (+3%) | 20mo | $259,000 | $154 | 78 |
| 16444 Bolsa Chica St #71 | 0.00mi | 3/2.0 | 1,541 (-5%) | 18mo | $198,000 | $128 | 77 |
| 16444 Bolsa Chica St #72 | 0.00mi | 3/2.0 | 1,850 (+14%) | 17mo | $259,999 | $141 | 63 |
| 16444 Bolsa Chica St #157 | 0.00mi | 2/2.0 (-1) | 1,800 (+11%) | 17mo | $125,000 | $69 | 63 |
| 4382 Lahaina Dr | 0.64mi | 3/2.0 | 1,785 (+10%) | 5mo | $875,000 | $490 | 50 |
| 16444 Bolsa Chica #42 | 0.52mi | 3/2.0 | 1,440 (-11%) | 13mo | $325,000 | $226 | 46 |
Match score weights: distance 35% · size 25% · config 20% · recency 20%. Top-matched comps best support the ARV.
Projected returns pro-forma
-3.0% appreciation · 2.17% rent growth · sell at horizon
- IRR
- 14.8%
- Equity multiple
- 1.59×
- Total profit
- $42,668
- Equity at exit
- $38,692
- IRR
- 22.9%
- Equity multiple
- 2.89×
- Total profit
- $137,266
- Equity at exit
- $22,437
Cash invested: $72,660 (down + closing). Projections, not guarantees.
Landlord ↔ Tenant lean methodology
- Overall (STATE)
- 18 Strongly Tenant-Friendly
- State California
- 18 Strongly Tenant-Friendly · D+13
- County
- — inherits STATE
- City
- — inherits STATE
ZIP-level market 92649
- Rents YoY
- 2.2%
- Active inventory
- 83
- Price-to-rent
- 5.4×
Monthly cashflow live
- Estimated rent
- $4,019 high interval (Pro) →
- Mortgage (P&I)
- −$1,361
- Tax est. 1.5%
- −$324 /mo · $3,892/yr
- Insurance
- −$108
- HOA
- −$0
- Vacancy / Maint / Mgmt
- −$844
- Net cashflow
- $1,381
Break-even live
UW: 25.0% down · 7.5% · 30yr · 1.5% tax · 5.0% vac · 8.0% maint · 8.0% mgmt
Financing live
Cash to close
- Down payment
- $64,875
- Closing costs
- $7,785
- Reserves months
- —
- Total cash needed
- —
Loan-product check · same deal, 3 products live
Conventional
25% down · 7.5% · 30yr
- Down + closing
- —
- Monthly P&I
- —
- Monthly cashflow
- —
- DSCR
- —
- Eligible?
- —
Personal DTI + credit; lowest rate.
DSCR
20% down · 8.5% · 30yr
- Down + closing
- —
- Monthly P&I
- —
- Monthly cashflow
- —
- DSCR
- —
- Eligible?
- —
No personal income docs; deal must DSCR.
Hard money
10% down · 12.0% · 12mo
- Down + closing
- —
- Monthly P&I
- —
- Monthly cashflow
- —
- DSCR
- —
- Eligible?
- —
Short-term bridge; refi at stabilization.
Rent comps 30 comps
| Address | Beds | Baths | Sqft | Rent | $/sqft | DOM | Units | Dist |
|---|---|---|---|---|---|---|---|---|
| 16592 Jib Cir Unit B Huntington Beach, CA | 3.0 | 2.5 | 1500 | $4,300 | $2.87 | 1d | 1 | 0.21mi |
| 5141 Cheryl Dr Huntington Beach, CA | 3.0 | 1.5 | 1120 | $4,200 | $3.75 | 16d | 1 | 0.33mi |
| 16795 Roosevelt Ln Unit C Huntington Beach, CA | 3.0 | 2.0 | 1600 | $3,900 | $2.44 | 1d | 1 | 0.33mi |
| 4862 Kona Dr Unit C Huntington Beach, CA | 3.0 | 2.5 | 1200 | $2,895 | $2.41 | 15d | 1 | 0.38mi |
| 4862 Kona Dr Unit C Huntington Beach, CA | 3.0 | 2.5 | 1200 | $2,895 | $2.41 | 1d | 1 | 0.38mi |
| 4862 Kona Dr Unit C Huntington Beach, CA | 3.0 | 2.5 | 1200 | $2,895 | $2.41 | 13d | 1 | 0.38mi |
| 4881 Kona Dr Unit A Huntington Beach, CA | 3.0 | 2.5 | 1300 | $3,295 | $2.53 | 10d | 1 | 0.40mi |
| 16082 Schryer Ln Huntington Beach, CA | 3.0 | 2.0 | 1214 | $8,000 | $6.59 | 2d | 1 | 0.44mi |
| 16842 Hoskins Ln Unit A Huntington Beach, CA | 3.0 | 2.0 | 1072 | $3,195 | $2.98 | 2d | 1 | 0.45mi |
| 5082 Edinger Ave Huntington Beach, CA | 3.0 | 2.0 | 1278 | $4,500 | $3.52 | 1d | 1 | 0.45mi |
| 16907 Airport Cir Unit CI103 Huntington Beach, CA | 4.0 | 3.0 | 1937 | $4,700 | $2.43 | 16d | 1 | 0.45mi |
| 4562 Heil Ave Unit 1 Huntington Beach, CA | 3.0 | 2.0 | 1250 | $3,750 | $3.00 | 2d | 1 | 0.52mi |
| 16682 Dolores Ln Huntington Beach, CA | 2.0 | 2.5 | 1700 | $3,600 | $2.12 | 10d | 1 | 0.55mi |
| 16941 Hoskins Ln Apt 1 Huntington Beach, CA | 2.0 | 2.0 | 1255 | $3,000 | $2.39 | 21d | 1 | 0.56mi |
| 5192 Robinwood Dr Huntington Beach, CA | 3.0 | 2.0 | 1232 | $5,000 | $4.06 | 1d | 1 | 0.62mi |
| 5681 Mangrum Dr Huntington Beach, CA | 3.0 | 2.0 | 1132 | $4,995 | $4.41 | 1d | 1 | 0.72mi |
| 16700 Saybrook Ln Huntington Beach, CA | 1.0–2.0 | 1.0–2.0 | 1082 | $3,670 | $3.39 | 1d | 10 | 0.75mi |
| 5952 Par Cir Huntington Beach, CA | 3.0 | 2.0 | 1437 | $5,400 | $3.76 | 13d | 1 | 0.90mi |
| 5641 Tilburg Dr Huntington Beach, CA | 3.0 | 2.0 | 1188 | $4,495 | $3.78 | 1d | 1 | 1.03mi |
| 6002 Welde Cir Huntington Beach, CA | 3.0 | 2.0 | 1284 | $3,650 | $2.84 | 10d | 1 | 1.13mi |
| 6200 Edinger Ave Huntington Beach, CA | 1.0–3.0 | 1.0–2.0 | 851 | $3,462 | $4.07 | 1d | 4 | 1.20mi |
| 4021 Aladdin Dr Huntington Beach, CA | 3.0 | 2.5 | 1496 | $7,400 | $4.95 | 1d | 1 | 1.26mi |
| 6281 Reubens Dr Huntington Beach, CA | 4.0 | 2.0 | 1820 | $4,895 | $2.69 | 10d | 1 | 1.26mi |
| 6281 Reubens Dr Huntington Beach, CA | 4.0 | 2.0 | 1820 | $4,895 | $2.69 | 1d | 1 | 1.26mi |
| 5832 Nordina Dr Huntington Beach, CA | 3.0 | 2.0 | 1171 | $4,399 | $3.76 | 1d | 1 | 1.26mi |
| 6042 Stone Cir Huntington Beach, CA | 4.0 | 2.0 | 1434 | $4,995 | $3.48 | 1d | 1 | 1.28mi |
| 5902 Nordina Dr Huntington Beach, CA | 4.0 | 2.5 | 1840 | $5,000 | $2.72 | 10d | 1 | 1.31mi |
| 3832 Montego Dr Huntington Beach, CA | 3.0 | 2.5 | 1826 | $5,900 | $3.23 | 16d | 1 | 1.33mi |
| 3726 Montego Dr Huntington Beach, CA | 4.0 | 3.0 | 2057 | $6,000 | $2.92 | 7d | 1 | 1.42mi |
| 6401 Warner Ave Huntington Beach, CA | 2.0–3.0 | 1.0–2.5 | 1145 | $4,196 | $3.66 | 1d | 16 | 1.45mi |
Listing history 9 events
-
2026-06-18days on market $259,500 Active 10 DOM
-
2026-06-17days on market $259,500 Active 9 DOM
-
2026-06-16days on market $259,500 Active 8 DOM
-
2026-06-15days on market $259,500 Active 7 DOM
-
2026-06-13days on market $259,500 Active 5 DOM
-
2026-06-13days on market $259,500 Active 4 DOM
-
2026-06-10days on market $259,500 Active 2 DOM
-
2026-06-09remarks 699-char remark
-
2026-06-09$259,500 Active 1 DOM
ⓘ Source: listings_history table (triggers on properties + properties_extension) + one-shot
backfill from property_details.listing_events for pre-trigger history.
Climate risk First Street
- Flood 1/10 Low FEMA zone X (shaded) · 0% chance over 30 yrs
- Wildfire 4/10 Moderate
- Heat 5/10 Major 7 d/yr ≥85°F today · 22 d/yr by 30 yrs out
- Wind 1/10 Low
- Air quality 4/10 Moderate 5 unhealthy d/yr today · 7 by 30 yrs out
Nearby sold comps map
Loading sold comps map…
Walkable amenities ~0.75 mi
Loading nearby amenities…
Taxation est. · year 1
- Rental income
- $48,225
- − Mortgage interest
- −$14,536
- − Property taxes
- −$3,892
- − Insurance
- −$1,298
- − Repairs & maintenance
- −$3,858
- − Management
- −$3,858
- − Depreciation
- −$7,549
- Taxable income
- $13,234
- Est. tax owed @ 24.0%
- −$3,176
- After-tax cash flow
- $13,402/yr
For passive investors: Depreciation is non-cash, so a rental often shows a tax loss while cash-flowing — sheltering income. Rental losses are passive: they offset passive income freely, and up to $25,000/yr can offset ordinary (W-2) income if you actively participate and your MAGI is under $100k (phasing out to $0 by $150k); unused losses carry forward. On sale, claimed depreciation is recaptured at up to 25%, and gains may owe capital-gains tax (a 1031 exchange can defer both). Figures are a year-1 estimate at your 24.0% rate — not tax advice; consult a CPA.
Schools (NCES district)
- District
- Ocean View
- NCES district ID
- 0628140
- Math proficiency
- 57% ▬ 0.00%
- Reading proficiency
- 63% ▼ -1.00%
- Median HH income
- $77,469
- Composite
- 55.3/100
- National rank
- #2725
- State rank
- #207 of 1400 in CA
Livability — Huntington Beach
- Score
- 67/100
- State rank
- #306
- US rank
- #10298
Category grades
Schools grade is shown separately in the Schools card above.
Census & demographics
- Census place
- Huntington Beach, CA
- County
- Orange County · 3,096,323 people
- City population
- 194,835
- Metro
- Los Angeles-Long Beach-Anaheim, CA
- Population (ZIP)
- 35,346
- Household income
- $123,257
- Rent vs Own
- Severe rent burden
- 1504.0
Population outlook (Orange County) Hauer SSP2
- Today (2025)
- 3,477,456 people
- By 2030
- 3,613,117 · +3.9%
- By 2040
- 3,835,945 · +10.3%
- By 2050
- 3,968,736 · +14.1%
- By 2075
- 4,097,053 · +17.8%
- By 2100
- 3,903,633 · +12.3%
Race, ethnicity, and origin ACS 2023
- Neighborhood character
- Majority White (64%)
- Race & ethnicity
- White 64% Hispanic / Latino 16% Two or more races 14% Asian 10%
- Hispanic origin (detail)
- Mexican 11%
- Common ancestry
- Lithuanian 3% Italian 2% Romanian 2%
- Foreign-born
- 14% · Canada, Vietnam, China
- Languages at home
- 81% English-only · Spanish 6% Other Asian/Pacific 3% Vietnamese 2%
Political lean MEDSL · Orange
- 2024 margin
- Toss-up / Even · D 49.7% · R 47.1% · Other 3.2%
- 2008→2024 swing
- +5.2pp toward D · 2008: -2.6pp · 2024: 2.6pp
- All cycles
- 2024: D+2.6 2020: D+9.0 2016: D+7.7 2012: R+8.3 2008: R+2.6
Not yet ingested
- Civics
- —
Market trends
- HPI YoY
- ▼ -1153.55%
- Current HPI
- 330.6956
- Rent YoY
- ▲ 2.17%
- Metro
- Los Angeles-Long Beach-Anaheim, CA
- State GDP YoY
- ▲ 3.21%
- F500 in state
- 116
Industry mix (Fortune 500 HQ in CA)
| Industry | F500 HQs | Revenue |
|---|---|---|
| Technology | 27 | $1,492B |
|
||
| Financial Services | 3 | $174B |
|
||
| Retail | 3 | $44B |
|
||
| Insurance | 3 | $26B |
|
||
| Media / Entertainment | 2 | $115B |
|
||
| Pharmaceuticals / Biotech | 2 | $62B |
|
||
Price history
1 event — show timeline
- 2026-06-08 Listed $259,500 CRMLS
Property tax history
-4.2%/yrLatest (2025): $409 · -0.3% YoY. Source: county tax records.
Cash-flow waterfall
monthlySold comps — $/sqft
last 12 mo · ≤1 miLoading sold comps…