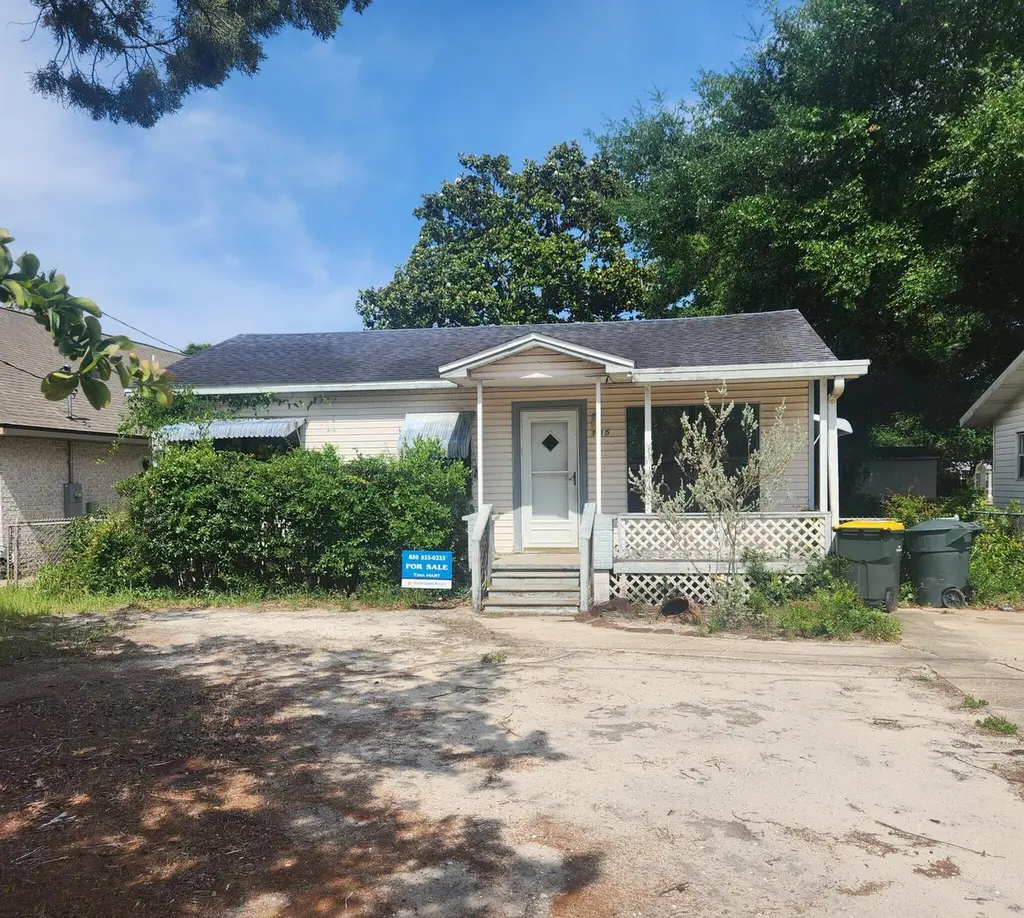
None · Fort Walton Beach, FL
Flood risk 4/10 · Minor
- FEMA flood zone
- X (unshaded)
- Chance of flooding over 30 yrs
- 0.22%
- Est. flood insurance / yr
- $507 – $1,088
Fire risk 1/10 · Minimal
- Est. fire insurance / yr
- $947 – $1,759
Heat risk 10/10 · Severe
- Hot days now (above 103°F)
- 7 days/yr
- Hot days in 30 yrs
- 22 days/yr
Wind risk 9/10 · Severe
- Chance of severe wind over 30 yrs
- 99.0%
Air-quality risk 2/10 · Minimal
- Unhealthy air days now
- 1 days/yr
- Unhealthy air days in 30 yrs
- 2 days/yr
Risk factors via First Street. Map © Google.
Why this score? — see what drove the C grade
The composite is a weighted blend of 9 inputs, each scored 0–100. Each bar is that input's sub-score; the figure is the points it added to the 100-point composite (weight × sub-score).
- Cash flow +19.4/30.0
- ARV discount +15.0/15.0
- DSCR +6.1/10.0
- Schools +5.2/10.0
- 1% rule +4.9/10.0
- Livability +4.0/5.0
- Rent growth +2.8/5.0
- Condition / age +2.5/5.0
- Appreciation +0.0/10.0
$160,000
🖨 Deal sheet 📄 Offer letter ✓ Due diligence
Listing remarks
Needs TOTAL renovation. Sold 'as is' Appliances and inside debris has been removed. Yard has been partially cleared. The lot is narrow but very long. Rear access from back of lot. Location is super close to the beach and downtown. Build new or rebuild. Lots of potential for this location!
Key facts
- Lots of potential
- Build new
- Rear access
Tags
Property features AI
Finance
- HOA & community: Subdivision: OCEAN CITY
Exterior
- Parking: Driveway with 2 spaces
- Utilities: Public water; Public sewer; Electric service
- Home design: Florida Cottage style; Single-story
- Construction: Built in 1954
- Exterior features: Private yard with lawn pump; Yard building; Covered patio; Chain link fencing; Level lot; City street frontage; Paved road access
Interior
- Kitchen: First-floor kitchen
- Bedrooms: 3 bedrooms (all on the first floor)
- Bathrooms: 1 full bathroom
- Heating & cooling: Central air conditioning; Ceiling fans
- Interior features: Washer/dryer hookup; Unfurnished
- Laundry & utility: First-floor laundry room; Electric water heater
Neighborhood map
What this means for you Summary
Snapshot
- This is a 2-bed/1.0-bath single-family listed at $160k.
Deal economics
- At list price, monthly cash flow is $178 ($2k/yr) — positive.
- The deal already cash-flows at list — no discount required.
- To meet the 1% rule (rent ≥ 1% of price), the offer needs to be $159k (0.7% below list).
- Recommended offer: $159k (0.7% below list) — sets the bar for 1% rule.
- Cap rate 7.6% vs local median 0.9% in Fort Walton Beach — top-decile yield for the area; either an underpriced asset or a hidden risk that comps aren't pricing in. Stress-test before assuming the spread holds.
Location & tenants
- Location reads 80/100 on livability (#111 in FL, #1,628 nationally) — a professional / high-income tenant draw. Strengths: commute A+, housing A+, health & safety A+; Watch: amenities F.
- Okaloosa (other): math 60% / reading 60% proficiency, ranked #12 of 73 in FL (top 16%) — acceptable for families but not a draw, mixed tenant base, ~2y average lease.
- Zoned schools: Elliott Point Elementary School (math 38% / reading 51%, grade F, #1,288 of 2,144 statewide, top 62%, 597 students, 70% FRL); Fort Walton Beach High School (math 54% / reading 58%, grade C, #131 of 667 statewide, top 20%, 1,620 students, 42% FRL) — zoned schools average 56% FRL vs 36% district-wide (20 pts higher); higher-poverty schools than district average — tighter screening recommended.
- Market conditions: Rents rising (+1.3%/yr); 341 active listings in the ZIP; 19 comparable units currently listed for rent nearby; rentals lingering (median 44d on market — plan ~5-8 weeks vacancy on turnover, expect pricing pressure); 53% of comp listings sitting > 30 days — soft ceiling on asking rent; 1,268 units permitted in Okaloosa County in 2024 (175 in 5+ unit buildings).
Forward outlook
- Local home prices are declining (-3.0%/yr); year-one equity from $1k of loan paydown is wiped out by about $5k of value loss. Plan a longer hold.
- Okaloosa County population projected at +37% by 2050 — long-run rental-demand tailwind backs the buy-and-hold thesis.
Negotiation context
- Only 5 days on market — expect competitive offers; lowballing is unlikely to land.
- 9 sale attempts since 26y ago with the ask held roughly flat each time — persistent listings suggest the price (not the market) is what's stuck; bring a comps-based counter.
- Current owner paid $49k; list at $160k implies a 227% gain — meaningful room to come down on a strong offer.
Risks & watch-outs
- Watch-outs: built in 1954 — expect roof / HVAC / electrical / plumbing capex.
- Climate carrying-cost: severe wind risk, 99% chance of damaging wind over 30y; extreme-heat days projected 7→22/yr by 2055 (HVAC capex compounding) — expect insurance premiums to compound above CPI over the hold.
Questions for the listing agent
- Built in 1954 — when were the roof, HVAC, electrical panel, plumbing, and water heater last replaced?
- Is there a deadline driving the sale (1031 exchange, divorce, estate, relocation)? That informs how much negotiation room exists.
- What's the average days-on-market for RENTAL listings here right now (not sales)? A rising rental-DOM trend means longer vacancies and softer asking-rent achievability than the comps imply.
- What's the recent tenant-quality profile in this submarket — average credit score on applications, eviction rate, late-payment / NSF rate, and stable-employment percentage? A property-management company in the area should have these aggregated.
- How much new for-sale + rental construction is in the pipeline within 1–3 miles? Heavy new supply typically softens prices + rents 12–24 months out; constrained supply supports both.
Investment metrics
- 1% rule
- 0.99% ✗
- Cap rate
- 7.63%
- Cash-on-cash
- 4.76%
- DSCR
- 1.21
- GRM
- 8.4
CMA / ARV
- ARV (on-the-fly)
- $205,440
- Comps found
- 7
Show comp detail 7 sales within ~0.75 mi
| Address | Dist | Beds/Ba | Sqft | Sold | Price | $/sf | Match |
|---|---|---|---|---|---|---|---|
| 105 Magnolia Ave | 0.00mi | 3/1.0 (+1) | 960 (0%) | 0mo | $185,000 | $193 | 95 |
| 52 NE Laurie Dr | 0.70mi | 2/2.0 | 1,000 (+4%) | 5mo | $425,000 | $425 | 52 |
| 348 NE Gardner Dr | 0.56mi | 3/1.0 (+1) | 1,052 (+10%) | 3mo | $225,000 | $214 | 51 |
| 40 NE Laurie Dr | 0.61mi | 3/1.0 (+1) | 1,012 (+5%) | 12mo | $289,900 | $286 | 47 |
| 79 NE Laurie Dr | 0.71mi | 3/1.0 (+1) | 1,032 (+8%) | 10mo | $259,000 | $251 | 41 |
| 48 NE Laurie Dr | 0.68mi | 3/1.0 (+1) | 1,102 (+15%) | 9mo | $200,000 | $181 | 31 |
| 21 SE Birch St | 0.71mi | 3/2.0 (+1) | 1,092 (+14%) | 20mo | $137,610 | $126 | 18 |
Match score weights: distance 35% · size 25% · config 20% · recency 20%. Top-matched comps best support the ARV.
Projected returns pro-forma
-3.0% appreciation · 1.33% rent growth · sell at horizon
- IRR
- -10.7%
- Equity multiple
- 0.62×
- Total profit
- $-17,222
- Equity at exit
- $23,857
- IRR
- -3.9%
- Equity multiple
- 0.76×
- Total profit
- $-10,809
- Equity at exit
- $13,834
Cash invested: $44,800 (down + closing). Projections, not guarantees.
Landlord ↔ Tenant lean methodology
- Overall (STATE)
- 87 Strongly Landlord-Friendly
- State Florida
- 87 Strongly Landlord-Friendly · R+3
- County
- — inherits STATE
- City
- — inherits STATE
ZIP-level market 32548
- Home prices YoY
- -31.1%
- Rents YoY
- 1.3%
- Active inventory
- 341
- Price-to-rent
- 8.4×
Monthly cashflow live
- Estimated rent
- $1,589 high interval (Pro) →
- Mortgage (P&I)
- −$839
- Tax from tax record
- −$172 /mo · $2,063/yr
- Insurance
- −$67
- HOA
- −$0
- Vacancy / Maint / Mgmt
- −$334
- Net cashflow
- $178
Break-even live
UW: 25.0% down · 7.5% · 30yr · 1.5% tax · 5.0% vac · 8.0% maint · 8.0% mgmt
Financing live
Cash to close
- Down payment
- $40,000
- Closing costs
- $4,800
- Reserves months
- —
- Total cash needed
- —
Loan-product check · same deal, 3 products live
Conventional
25% down · 7.5% · 30yr
- Down + closing
- —
- Monthly P&I
- —
- Monthly cashflow
- —
- DSCR
- —
- Eligible?
- —
Personal DTI + credit; lowest rate.
DSCR
20% down · 8.5% · 30yr
- Down + closing
- —
- Monthly P&I
- —
- Monthly cashflow
- —
- DSCR
- —
- Eligible?
- —
No personal income docs; deal must DSCR.
Hard money
10% down · 12.0% · 12mo
- Down + closing
- —
- Monthly P&I
- —
- Monthly cashflow
- —
- DSCR
- —
- Eligible?
- —
Short-term bridge; refi at stabilization.
Rent comps 19 comps
| Address | Beds | Baths | Sqft | Rent | $/sqft | DOM | Units | Dist |
|---|---|---|---|---|---|---|---|---|
| 107 Magnolia Ave SE Fort Walton Beach, FL | 3.0 | 1.0 | 1106 | $1,700 | $1.54 | 13d | 1 | 0.02mi |
| 128 Elm Ave SE Fort Walton Beach, FL | 2.0 | 1.0 | 960 | $1,500 | $1.56 | 21d | 1 | 0.11mi |
| 208 Oak St SE Unit B Fort Walton Beach, FL | 2.0 | 1.5 | 1008 | $1,650 | $1.64 | 21d | 1 | 0.15mi |
| 36 Alder Ave SE #3 Fort Walton Beach, FL | 2.0 | 2.5 | 1061 | $1,800 | $1.70 | 43d | 1 | 0.18mi |
| 133 Alder Ave SE Fort Walton Beach, FL | 2.0 | 1.0 | 1031 | $1,500 | $1.45 | 43d | 1 | 0.18mi |
| 111 Chicago Ave SE Unit 1 Fort Walton Beach, FL | 1.0 | 1.0 | 550 | $1,025 | $1.86 | 21d | 1 | 0.19mi |
| 159 Scottwood Dr SE Fort Walton Beach, FL | 2.0 | 2.0 | 1104 | $1,400 | $1.27 | 43d | 1 | 0.22mi |
| 102 Chicago Ave SE Fort Walton Beach, FL | 1.0 | 1.0 | 600 | $1,200 | $2.00 | 43d | 1 | 0.24mi |
| 102 Chicago Ave SE Unit 102-1 Fort Walton Beach, FL | 1.0 | 1.0 | 650 | $1,150 | $1.77 | 13d | 1 | 0.24mi |
| 308 Miracle Strip Pkwy SE Unit 1 Fort Walton Beach, FL | 1.0 | 1.0 | 625 | $1,450 | $2.32 | 43d | 1 | 0.46mi |
| 22 Laurie Dr NE Fort Walton Beach, FL | 3.0 | 1.5 | 1064 | $1,800 | $1.69 | 21d | 1 | 0.47mi |
| 165 Brooks St SE Fort Walton Beach, FL | 2.0 | 1.0 | 900 | $1,850 | $2.06 | 13d | 1 | 0.54mi |
| 330 Bluefish Dr #103 Fort Walton Beach, FL | 2.0 | 2.0 | 1100 | $2,500 | $2.27 | 43d | 1 | 0.76mi |
| 101 Church Ave SE Unit 105 Fort Walton Beach, FL | 1.0 | 1.0 | 875 | $1,397 | $1.60 | 43d | 1 | 0.77mi |
| 101 Church Ave SE Unit 204 Fort Walton Beach, FL | 2.0 | 1.0 | 945 | $1,676 | $1.77 | 43d | 1 | 0.77mi |
| 103 Church Ave SE Unit B Fort Walton Beach, FL | 2.0 | 1.0 | 930 | $1,300 | $1.40 | 21d | 1 | 0.78mi |
| 115 Hughes St NE Unit D2 Fort Walton Beach, FL | 2.0 | 1.0 | 1066 | $1,900 | $1.78 | 21d | 1 | 0.94mi |
| 140 Opp Blvd NE Fort Walton Beach, FL | 2.0 | 1.5 | 896 | $1,750 | $1.95 | 43d | 1 | 1.00mi |
| 146 Alabama Ave NW Unit B Fort Walton Beach, FL | 1.0 | 1.0 | 750 | $1,250 | $1.67 | 43d | 1 | 1.50mi |
Listing history 18 events
-
2026-05-23$160,000 Active
-
2011-04-01soldstatus $49,000
-
2011-04-01soldstatus $49,000
-
2010-10-25$79,000
-
2010-10-25$79,000
-
2007-08-14$145,900
-
2005-07-18soldstatus $139,900
-
2005-07-15soldstatus $139,900
-
2005-07-15soldstatus $139,900
-
2005-06-11$139,900
-
2005-06-11$139,900
-
2004-05-05historical
-
2004-04-20$89,900
-
2004-04-20$89,900
-
2000-11-02soldstatus $59,000
-
2000-10-31soldstatus $59,000
-
2000-09-13$62,900
-
1977-01-01soldstatus $5,939
ⓘ Source: listings_history table (triggers on properties + properties_extension) + one-shot
backfill from property_details.listing_events for pre-trigger history.
Tax reassessment forecast FL · Resets to sale price
- Current annual tax
- $2,063 · $172/mo
- Projected year-2 tax
- $2,063 · $172/mo
- Expected delta
- $0/yr ($0/mo · 0.0%)
ⓘ Screening estimate from a state-policy table — verify with the county assessor before closing.
Climate risk First Street
- Flood 4/10 Moderate FEMA zone X (unshaded) · 22% chance over 30 yrs
- Wildfire 1/10 Low
- Heat 10/10 Extreme 7 d/yr ≥103°F today · 22 d/yr by 30 yrs out
- Wind 9/10 Extreme 99% chance of damaging wind over 30 yrs
- Air quality 2/10 Low 1 unhealthy d/yr today · 2 by 30 yrs out
Nearby sold comps map
Loading sold comps map…
Walkable amenities ~0.75 mi
Loading nearby amenities…
Taxation est. · year 1
- Rental income
- $19,070
- − Mortgage interest
- −$8,962
- − Property taxes
- −$2,063
- − Insurance
- −$800
- − Repairs & maintenance
- −$1,526
- − Management
- −$1,526
- − Depreciation
- −$4,655
- Taxable loss
- −$461
- Est. tax savings @ 24.0%
- +$111
- After-tax cash flow
- $2,244/yr
For passive investors: Depreciation is non-cash, so a rental often shows a tax loss while cash-flowing — sheltering income. Rental losses are passive: they offset passive income freely, and up to $25,000/yr can offset ordinary (W-2) income if you actively participate and your MAGI is under $100k (phasing out to $0 by $150k); unused losses carry forward. On sale, claimed depreciation is recaptured at up to 25%, and gains may owe capital-gains tax (a 1031 exchange can defer both). Figures are a year-1 estimate at your 24.0% rate — not tax advice; consult a CPA.
Schools (NCES district)
- District
- Okaloosa
- NCES district ID
- 1201380
- Math proficiency
- 60% ▼ -12.00%
- Reading proficiency
- 60% ▼ -4.00%
- Median HH income
- $55,601
- Composite
- 51.62/100
- National rank
- #1705
- State rank
- #12 of 73 in FL
Livability — Fort Walton Beach
- Score
- 80/100
- State rank
- #111
- US rank
- #1628
Category grades
Schools grade is shown separately in the Schools card above.
Census & demographics
- Census place
- Fort Walton Beach, FL
- County
- Okaloosa County · 194,352 people
- City population
- 59,301
- Metro
- Crestview-Fort Walton Beach-Destin, FL
- Population (ZIP)
- 23,774
- Household income
- $65,342
- Rent vs Own
- Severe rent burden
- 889.0
Population outlook (Okaloosa County) Hauer SSP2
- Today (2025)
- 235,133 people
- By 2030
- 253,483 · +7.8%
- By 2040
- 289,537 · +23.1%
- By 2050
- 322,954 · +37.3%
- By 2075
- 399,624 · +70.0%
- By 2100
- 425,311 · +80.9%
Race, ethnicity, and origin ACS 2023
- Neighborhood character
- Diverse neighborhood (Simpson 0.57)
- Race & ethnicity
- White 63% Hispanic / Latino 13% Black 12% Two or more races 9% Asian 6%
- Hispanic origin (detail)
- Mexican 4% Puerto Rican 2%
- Common ancestry
- Italian 4% Slovak 3% Romanian 2%
- Foreign-born
- 12% · Canada, Jamaica
- Languages at home
- 84% English-only · Spanish 9% Other Asian/Pacific 3% Other Indo-European 1%
Political lean MEDSL · Okaloosa
- 2024 margin
- Solid R (+42.4) · D 28.2% · R 70.7% · Other 1.1%
- 2008→2024 swing
- +2.5pp toward D · 2008: -44.9pp · 2024: -42.4pp
- All cycles
- 2024: R+42.4 2020: R+39.1 2016: R+47.8 2012: R+49.4 2008: R+44.9
Not yet ingested
- Civics
- —
Market trends
- HPI YoY
- ▼ -123.88%
- Current HPI
- 274.8418
- Rent YoY
- ▲ 1.33%
- Metro
- Crestview-Fort Walton Beach-Destin, FL
- State GDP YoY
- ▲ 3.28%
- F500 in state
- 36
Industry mix (Fortune 500 HQ in FL)
| Industry | F500 HQs | Revenue |
|---|---|---|
| Industrial Technology | 2 | $29B |
|
||
| Insurance | 2 | $17B |
|
||
| Retail | 1 | $60B |
|
||
| Technology Distribution | 1 | $58B |
|
||
| Homebuilding | 1 | $35B |
|
||
| Technology Manufacturing | 1 | $35B |
|
||
Price history
+2594.1% since first listed18 events — show timeline
- 2026-05-23 Listed $160,000 ECAR
- 2011-04-01 Sold (MLS) $49,000 ECAR
- 2011-04-01 Sold (MLS) $49,000 NAMLS
- 2010-10-25 Listed $79,000 ECAR
- 2010-10-25 Listed $79,000 NAMLS
- 2007-08-14 Listed $145,900 ECAR
- 2005-07-18 Sold (Public Records) $139,900 Public Records
- 2005-07-15 Sold (MLS) $139,900 ECAR
- 2005-07-15 Sold (MLS) $139,900 NAMLS
- 2005-06-11 Listed $139,900 ECAR
- 2005-06-11 Listed $139,900 NAMLS
- 2004-05-05 Listing Removed — NAMLS
- 2004-04-20 Listed $89,900 NAMLS
- 2004-04-20 Listed $89,900 ECAR
- 2000-11-02 Sold (Public Records) $59,000 Public Records
- 2000-10-31 Sold (MLS) $59,000 ECAR
- 2000-09-13 Listed $62,900 ECAR
- 1977-01-01 Sold (Public Records) $5,939 Public Records
Property tax history
+6.9%/yrLatest (2025): $2,063 · +13.0% YoY. Source: county tax records.
Cash-flow waterfall
monthlySold comps — $/sqft
last 12 mo · ≤1 miLoading sold comps…