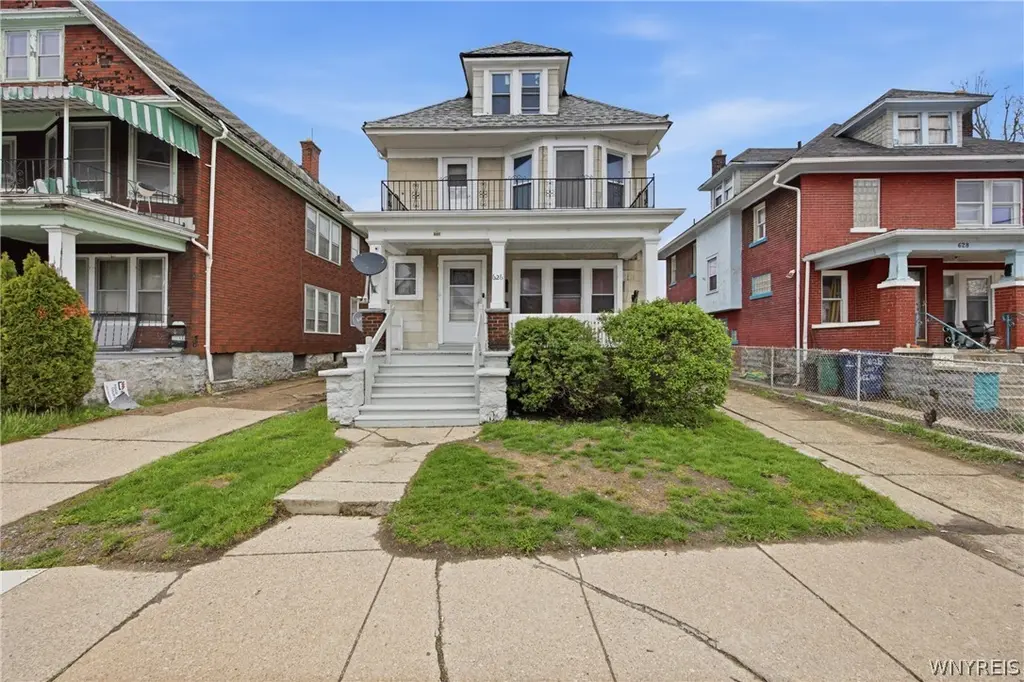
626 E Delavan Ave Unit N · Buffalo, NY
Flood risk 1/10 · Minimal
- FEMA flood zone
- X (unshaded)
- Chance of flooding over 30 yrs
- 0.0%
- Est. flood insurance / yr
- $473 – $860
Fire risk 1/10 · Minimal
- Est. fire insurance / yr
- $691 – $1,283
Heat risk 3/10 · Minor
- Hot days now (above 93°F)
- 7 days/yr
- Hot days in 30 yrs
- 15 days/yr
Wind risk 1/10 · Minimal
- Chance of severe wind over 30 yrs
- —
Air-quality risk 3/10 · Minor
- Unhealthy air days now
- 2 days/yr
- Unhealthy air days in 30 yrs
- 3 days/yr
Risk factors via First Street. Map © Google.
Why this score? — see what drove the B- grade
The composite is a weighted blend of 9 inputs, each scored 0–100. Each bar is that input's sub-score; the figure is the points it added to the 100-point composite (weight × sub-score).
- Cash flow +25.5/30.0
- ARV discount +11.7/15.0
- DSCR +8.4/10.0
- Appreciation +6.0/10.0
- 1% rule +5.4/10.0
- Livability +3.9/5.0
- Schools +3.3/10.0
- Rent growth +2.5/5.0
- Condition / age +2.5/5.0
$199,626
🖨 Deal sheet (PDF) 📄 Offer letter ✓ Due diligence
Listing remarks
WELCOME TO THIS WELL CARED FOR SOLID 2-UNIT READY FOR SERIOUS INVESTORS WANTING TO MOVE IN OR COLLECT INCOME! IT HAS ALL BEEN DONE; THE HARDWOOD FLOORS HAVE A GLOW; LARGE LRS & FORMAL DINING RMS; BOTH KITCHENS HAVE NEW CABINETS, COUNTERTOPS & BACKSPLASH; OPEN HIGH CEILINGS ALLOW BRIGHT LIGHT ENTRY; ALL 3 BR'S HAVE CLOSETS; BOTH SPACIOUS UNITS HAVE BEEN PAINTED INTERIOR; ONE BEDROOM HAS NEW CARPET; VARIOUS PARTS OF THE UPDATED BATHS; BOTH UNITS HAVE FRONT & REAR PAINTED HALLWAYS. NEW EXTERIOR WINDOWS, TRIM PAINTED WITH RAILINGS & PORCHES; NEW WINDOWS INSTALLED. FULL BASEMENT WITH LAUNDRY HOOKUPS FOR EACH UNIT; STORAGE ROOMS FOR EACH UNIT; SEPARATE UTILITIES; SOLID MEC
Key facts
- New carpet
- New cabinets
- New countertops
Tags
Property features AI
Finance
- Financial info: Owner pays trash collection and water; tenants pay all utilities; Operating expenses may include fuel, insurance, licenses, maintenance and rent (see remarks)
Exterior
- Parking: Attached garage with two spaces
- Utilities: Public water connected; Sewer connected; Circuit breaker electric
- Home design: Two-story property; Residential 2-unit zoning
- Construction: Vinyl siding; Copper plumbing; Asphalt shingle roof; Block foundation; Existing (previously built)
- Exterior features: Partial fencing; Near public transit; Rectangular residential lot; City street frontage
Interior
- Flooring: Hardwood; Laminate; Tile; Varies
- Bathrooms: Two full bathrooms
- Heating & cooling: Gas forced-air heating
- Interior features: Hardwood, laminate, tile and varied flooring throughout; Full basement
- Laundry & utility: Gas water heater
Neighborhood map
What this means for you Summary
Snapshot
- This is a 6-bed/2.0-bath townhouse listed at $200k.
Deal economics
- At list price, monthly cash flow is $465 ($6k/yr) — positive.
- The deal already cash-flows at list — no discount required.
- Meets the 1% rule at list price ($2k rent vs $200k).
- Recommended offer: $197k (1.5% below list) — sets the bar for market timing.
Location & tenants
- Location reads 77/100 on livability (#195 in NY, #3,011 nationally) — a middle-class / working-renter tenant base. Strengths: commute A+, housing A+, health & safety A+; Watch: crime F, employment D-.
- Buffalo City School District (urban): math 41% / reading 40% proficiency, ranked #535 of 590 in NY (top 91%) — families likely to look elsewhere, expect single-tenant / working-renter base with shorter leases; 75% free/reduced lunch — lower-income household profile, screen leases tightly.
- Market conditions: 172 active listings in the ZIP; 1 comparable units currently listed for rent nearby; lower-income renter base — watch delinquency; 1,244 units permitted in Erie County in 2024 (563 in 5+ unit buildings).
- At $2,076/mo this rent would consume 69% of the median local household income ($36k/yr) (locally 1804% of renters already pay >50% of income on rent) — very limited rent-growth headroom before tenants either downsize or default.
Forward outlook
- In year one you build about $5k of equity ($1k loan paydown + $4k appreciation (2.0% local appreciation)).
- At projected returns (2.0% appreciation + 3.0% rent growth), your $56k cash investment doubles in ~5 years — after that, you're playing with house money.
- By year 7, paydown + projected appreciation supports a ~$35k cash-out refi (75% LTV) — recoverable capital for the next deal without selling this one.
Negotiation context
- It's been on market 28 days — a 2% lower offer ($197k) is reasonable based on typical stale-listing flexibility.
Risks & watch-outs
- Watch-outs: built in 1920 — expect roof / HVAC / electrical / plumbing capex.
Questions for the listing agent
- Built in 1920 — when were the roof, HVAC, electrical panel, plumbing, and water heater last replaced?
- Is there a deadline driving the sale (1031 exchange, divorce, estate, relocation)? That informs how much negotiation room exists.
- Crime grade is F in this area — have there been break-ins, vandalism, or insurance claims at this property in the last 3 years? What carrier currently insures it and at what premium?
- What's the average days-on-market for RENTAL listings here right now (not sales)? A rising rental-DOM trend means longer vacancies and softer asking-rent achievability than the comps imply.
- What's the recent tenant-quality profile in this submarket — average credit score on applications, eviction rate, late-payment / NSF rate, and stable-employment percentage? A property-management company in the area should have these aggregated.
- How much new for-sale + rental construction is in the pipeline within 1–3 miles? Heavy new supply typically softens prices + rents 12–24 months out; constrained supply supports both.
Investment metrics
- 1% rule
- 1.04% ✓
- Cap rate
- 9.09%
- Cash-on-cash
- 9.98%
- DSCR
- 1.44
- GRM
- 8.0
CMA / ARV
- ARV (median comp)
- $220,000
- List price
- $199,626
- Delta
- -9.26%
- Verdict
- FAIR
- Comps
- 9 within 1.0 mi
Show comp detail 3 sales within ~0.75 mi
| Address | Dist | Beds/Ba | Sqft | Sold | Price | $/sf | Match |
|---|---|---|---|---|---|---|---|
| 417 Cambridge Ave | 0.63mi | 6/2.0 | 1,960 (-13%) | 1mo | $220,000 | $112 | 47 |
| 411 Cambridge Ave | 0.63mi | 6/2.0 | 1,960 (-13%) | 3mo | $235,000 | $120 | 46 |
| 226 Cambridge Ave #2 | 0.57mi | 6/2.0 | 2,476 (+9%) | 20mo | $130,000 | $53 | 41 |
Match score weights: distance 35% · size 25% · config 20% · recency 20%. Top-matched comps best support the ARV.
Projected returns pro-forma
2.05% appreciation · 3.0% rent growth · sell at horizon
- IRR
- 14.5%
- Equity multiple
- 1.78×
- Total profit
- $43,706
- Equity at exit
- $79,269
- IRR
- 17.0%
- Equity multiple
- 3.27×
- Total profit
- $126,749
- Equity at exit
- $114,558
Cash invested: $55,895 (down + closing). Projections, not guarantees.
Landlord ↔ Tenant lean methodology
- Overall (STATE)
- 15 Strongly Tenant-Friendly
- State New York
- 15 Strongly Tenant-Friendly · D+10
- County
- — inherits STATE
- City
- — inherits STATE
ZIP-level market 14211
- Home prices YoY
- 0.6%
- Active inventory
- 172
- Price-to-rent
- 8.0×
Monthly cashflow live
- Estimated rent
- $2,076 medium interval (Pro) →
- Mortgage (P&I)
- −$1,047
- Tax from tax record
- −$45 /mo · $545/yr
- Insurance
- −$83
- HOA
- −$0
- Vacancy / Maint / Mgmt
- −$436
- Net cashflow
- $465
Break-even live
Sensitivity live
| Price | -10% $578 | -5% $521 | +0% $465 | +5% $408 | +10% $352 |
|---|---|---|---|---|---|
| Rent | -10% $301 | -5% $383 | +0% $465 | +5% $547 | +10% $629 |
| Rate | -1.0pp $566 | -0.5pp $516 | base $465 | +0.5pp $413 | +1.0pp $361 |
UW: 25.0% down · 7.5% · 30yr · 1.5% tax · 5.0% vac · 8.0% maint · 8.0% mgmt
Financing live
Cash to close
- Down payment
- $49,906
- Closing costs
- $5,989
- Reserves months
- —
- Total cash needed
- —
Loan-product check · same deal, 3 products live
Conventional
25% down · 7.5% · 30yr
- Down + closing
- —
- Monthly P&I
- —
- Monthly cashflow
- —
- DSCR
- —
- Eligible?
- —
Personal DTI + credit; lowest rate.
DSCR
20% down · 8.5% · 30yr
- Down + closing
- —
- Monthly P&I
- —
- Monthly cashflow
- —
- DSCR
- —
- Eligible?
- —
No personal income docs; deal must DSCR.
Hard money
10% down · 12.0% · 12mo
- Down + closing
- —
- Monthly P&I
- —
- Monthly cashflow
- —
- DSCR
- —
- Eligible?
- —
Short-term bridge; refi at stabilization.
Rent comps 1 comps
| Address | Beds | Baths | Sqft | Rent | $/sqft | DOM | Units | Dist |
|---|---|---|---|---|---|---|---|---|
| 15 Hughes Ave Buffalo, NY | 7.0 | 2.0 | 1650 | $3,000 | $1.82 | 44d | 1 | 1.00mi |
Listing history 4 events
-
2026-06-02statusdays on market $199,626 Pending 28 DOM
-
2026-06-01days on market $199,626 Active Under Contract 27 DOM
-
2026-05-31days on market $199,626 Active Under Contract 26 DOM
-
2026-05-04$199,626 Active 950-char remark
ⓘ Source: listings_history table (triggers on properties + properties_extension) + one-shot
backfill from property_details.listing_events for pre-trigger history.
Tax reassessment forecast NY · Partial reset (capped growth)
- Current annual tax
- $545 · $45/mo
- Projected year-2 tax
- $1,959 · $163/mo
- Expected delta
- +$1,414/yr (+$118/mo · 259.6%)
ⓘ Screening estimate from a state-policy table — verify with the county assessor before closing.
Climate risk First Street
- Flood 1/10 Low FEMA zone X (unshaded) · 0% chance over 30 yrs
- Wildfire 1/10 Low
- Heat 3/10 Moderate 7 d/yr ≥93°F today · 15 d/yr by 30 yrs out
- Wind 1/10 Low
- Air quality 3/10 Moderate 2 unhealthy d/yr today · 3 by 30 yrs out
Nearby sold comps map
Loading sold comps map…
Walkable amenities ~0.75 mi
Loading nearby amenities…
Taxation est. · year 1
- Rental income
- $24,918
- − Mortgage interest
- −$11,182
- − Property taxes
- −$545
- − Insurance
- −$998
- − Repairs & maintenance
- −$1,993
- − Management
- −$1,993
- − Depreciation
- −$5,807
- Taxable income
- $2,398
- Est. tax owed @ 24.0%
- −$576
- After-tax cash flow
- $5,004/yr
For passive investors: Depreciation is non-cash, so a rental often shows a tax loss while cash-flowing — sheltering income. Rental losses are passive: they offset passive income freely, and up to $25,000/yr can offset ordinary (W-2) income if you actively participate and your MAGI is under $100k (phasing out to $0 by $150k); unused losses carry forward. On sale, claimed depreciation is recaptured at up to 25%, and gains may owe capital-gains tax (a 1031 exchange can defer both). Figures are a year-1 estimate at your 24.0% rate — not tax advice; consult a CPA.
Schools (NCES district)
- District
- Buffalo City School District
- NCES district ID
- 3605850
- Math proficiency
- 41% ▲ 11.00%
- Reading proficiency
- 40% ▲ 7.00%
- Median HH income
- $31,665
- Composite
- 33.17/100
- National rank
- #5544
- State rank
- #535 of 590 in NY
Livability — Buffalo
- Score
- 77/100
- State rank
- #195
- US rank
- #3011
Category grades
Schools grade is shown separately in the Schools card above.
Census & demographics
- Census place
- Buffalo, NY
- County
- Erie County · 714,559 people
- City population
- 440,021
- Metro
- Buffalo-Cheektowaga, NY
- Population (ZIP)
- 24,663
- Household income
- $36,300
- Rent vs Own
- Severe rent burden
- 1804.0
Population outlook (Erie County) Hauer SSP2
- Today (2025)
- 933,037 people
- By 2030
- 935,181 · +0.2%
- By 2040
- 928,531 · -0.5%
- By 2050
- 905,725 · -2.9%
- By 2075
- 834,037 · -10.6%
- By 2100
- 708,033 · -24.1%
Race, ethnicity, and origin ACS 2023
- Neighborhood character
- Diverse neighborhood (Simpson 0.60)
- Race & ethnicity
- Black 59% Asian 20% Hispanic / Latino 9% White 9% Two or more races 5%
- Hispanic origin (detail)
- Puerto Rican 6%
- Common ancestry
- Romanian 4%
- Foreign-born
- 17% · Canada, Philippines, Vietnam
- Languages at home
- 74% English-only · Other Indo-European 14% Spanish 6% Other Asian/Pacific 1%
Political lean MEDSL · Erie
- 2024 margin
- Lean D (+9.7) · D 54.8% · R 45.2%
- 2008→2024 swing
- -7.9pp toward R · 2008: 17.5pp · 2024: 9.7pp
- All cycles
- 2024: D+9.7 2020: D+14.7 2016: D+4.8 2012: D+15.6 2008: D+17.5
Not yet ingested
- Civics
- —
Market trends
- HPI YoY
- ▲ 2.05%
- Current HPI
- 357.6438
- Rent YoY
- —
- Metro
- Buffalo-Cheektowaga, NY
- State GDP YoY
- ▲ 2.60%
- F500 in state
- 92
Industry mix (Fortune 500 HQ in NY)
| Industry | F500 HQs | Revenue |
|---|---|---|
| Financial Services | 10 | $950B |
|
||
| Consumer Goods | 9 | $162B |
|
||
| Insurance | 4 | $225B |
|
||
| Telecommunications | 2 | $144B |
|
||
| Pharmaceuticals | 2 | $112B |
|
||
| Media / Entertainment | 2 | $69B |
|
||
Price history
3 events — show timeline
- 2026-06-02 Pending — WNYREIS
- 2026-05-25 Contingent — WNYREIS
- 2026-05-04 Listed $199,626 WNYREIS
Property tax history
+12.0%/yrLatest (2025): $545 · +76.8% YoY. Source: county tax records.
Cash-flow waterfall
monthlySold comps — $/sqft
last 12 mo · ≤1 miLoading sold comps…