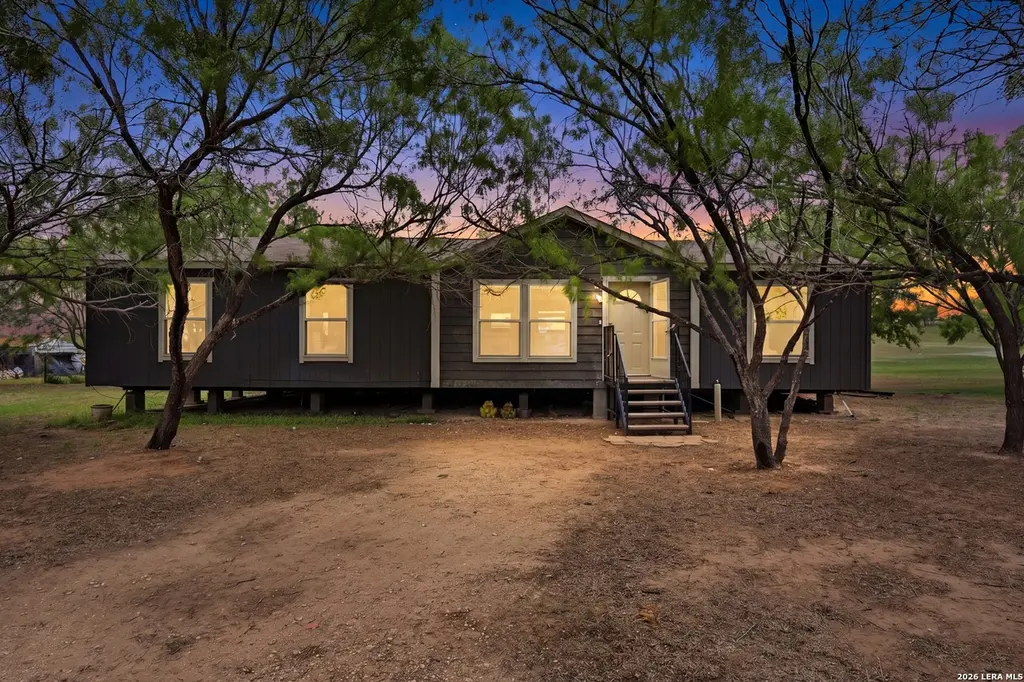
119 Avery Dr · Somerset, TX
Flood risk 1/10 · Minimal
- FEMA flood zone
- X (unshaded)
- Chance of flooding over 30 yrs
- 0.0%
- Est. flood insurance / yr
- $507 – $1,088
Fire risk 6/10 · Moderate
- Est. fire insurance / yr
- $1,222 – $2,270
Heat risk 8/10 · Major
- Hot days now (above 109°F)
- 7 days/yr
- Hot days in 30 yrs
- 21 days/yr
Wind risk 8/10 · Major
- Chance of severe wind over 30 yrs
- 80.0%
Air-quality risk 1/10 · Minimal
- Unhealthy air days now
- 0 days/yr
- Unhealthy air days in 30 yrs
- 0 days/yr
Risk factors via First Street. Map © Google.
Why this score? — see what drove the C+ grade
The composite is a weighted blend of 9 inputs, each scored 0–100. Each bar is that input's sub-score; the figure is the points it added to the 100-point composite (weight × sub-score).
- Cash flow +20.0/30.0
- ARV discount +15.0/15.0
- Appreciation +8.3/10.0
- DSCR +6.4/10.0
- 1% rule +4.3/10.0
- Livability +3.3/5.0
- Rent growth +2.5/5.0
- Condition / age +2.5/5.0
- Schools +2.3/10.0
$185,000
🖨 Deal sheet 📄 Offer letter ✓ Due diligence
Listing remarks MLS
Experience country living in this spacious 4 bedroom home in Somerset set on .69 acres, offering plenty of room to spread out and enjoy a more relaxed setting. This Texas property with land provides a peaceful atmosphere while still allowing for functional everyday living. The open floor plan connects the living, dining, and kitchen areas, creating a layout that supports easy flow and flexible use of space. The kitchen features stainless steel appliances, a kitchen island, and wood cabinetry, providing a practical setup for daily use and gatherings. The primary bedroom includes a bathroom with a separate bath and shower, offering basic functionality. A dedicated laundry room adds convenience to the layout.
Key facts
- Open floor plan
- Kitchen island
- Spacious home
Tags
Neighborhood map
What this means for you Summary
Snapshot
- This is a 4-bed/2.0-bath manufactured listed at $185k.
Deal economics
- At list price, monthly cash flow is $228 ($3k/yr) — positive.
- The deal already cash-flows at list — no discount required.
- To meet the 1% rule (rent ≥ 1% of price), the offer needs to be $171k (7.4% below list).
- Recommended offer: $171k (7.4% below list) — sets the bar for 1% rule.
- Cap rate 7.8% vs local median 5.9% in Somerset — top-decile yield for the area; either an underpriced asset or a hidden risk that comps aren't pricing in. Stress-test before assuming the spread holds.
Location & tenants
- Location reads 66/100 on livability (#639 in TX) — a middle-class / working-renter tenant base. Strengths: cost of living A+, housing A+, crime A; Watch: amenities F, commute F, health & safety F.
- Lytle ISD (rural): math 24% / reading 27% proficiency, ranked #690 of 826 in TX (top 84%) — low school quality limits family demand, transient renter base, plan for 1-2y turnover; 63% free/reduced lunch — lower-income household profile, screen leases tightly.
- Market conditions: 45 active listings in the ZIP; 224 units permitted in Atascosa County in 2024 (0 in 5+ unit buildings).
Forward outlook
- In year one you build about $13k of equity ($1k loan paydown + $12k appreciation (6.6% local appreciation)).
- Atascosa County population projected at +41% by 2050 — long-run rental-demand tailwind backs the buy-and-hold thesis.
- At projected returns (6.6% appreciation + 3.0% rent growth), your $52k cash investment doubles in ~3 years — after that, you're playing with house money.
- By year 3, paydown + projected appreciation supports a ~$33k cash-out refi (75% LTV) — recoverable capital for the next deal without selling this one.
Negotiation context
- It's been on market 59 days — a 3% lower offer ($179k) is reasonable based on typical stale-listing flexibility.
- 4 sale attempts since 2y ago with the ask held roughly flat each time — persistent listings suggest the price (not the market) is what's stuck; bring a comps-based counter.
- Current owner paid $46k; list at $185k implies a 307% gain — meaningful room to come down on a strong offer.
Risks & watch-outs
- Climate carrying-cost: severe wind risk, 80% chance of damaging wind over 30y; major wildfire risk; extreme-heat days projected 7→21/yr by 2055 (HVAC capex compounding) — expect insurance premiums to compound above CPI over the hold.
Questions for the listing agent
- It's been on market 59 days. Have you received any prior offers? Is the seller open to a 7% concession, seller financing, or rate buy-down credit?
- Is there a deadline driving the sale (1031 exchange, divorce, estate, relocation)? That informs how much negotiation room exists.
- What's the average days-on-market for RENTAL listings here right now (not sales)? A rising rental-DOM trend means longer vacancies and softer asking-rent achievability than the comps imply.
- What's the recent tenant-quality profile in this submarket — average credit score on applications, eviction rate, late-payment / NSF rate, and stable-employment percentage? A property-management company in the area should have these aggregated.
- How much new for-sale + rental construction is in the pipeline within 1–3 miles? Heavy new supply typically softens prices + rents 12–24 months out; constrained supply supports both.
Investment metrics
- 1% rule
- 0.93% ✗
- Cap rate
- 7.77%
- Cash-on-cash
- 5.29%
- DSCR
- 1.24
- GRM
- 9.0
CMA / ARV
- ARV (median comp)
- $289,375
- List price
- $185,000
- Delta
- -36.07%
- Verdict
- UNDERPRICED
- Comps
- 13 within 2.0 mi
Show comp detail 1 sale within ~0.75 mi
| Address | Dist | Beds/Ba | Sqft | Sold | Price | $/sf | Match |
|---|---|---|---|---|---|---|---|
| 385 Forest Oaks | 0.41mi | 3/2.0 (-1) | 1,717 (+3%) | 2mo | $385,000 | $224 | 69 |
Match score weights: distance 35% · size 25% · config 20% · recency 20%. Top-matched comps best support the ARV.
Projected returns pro-forma
6.59% appreciation · 3.0% rent growth · sell at horizon
- IRR
- 21.0%
- Equity multiple
- 2.44×
- Total profit
- $74,383
- Equity at exit
- $123,202
- IRR
- 19.8%
- Equity multiple
- 4.97×
- Total profit
- $205,784
- Equity at exit
- $229,637
Cash invested: $51,800 (down + closing). Projections, not guarantees.
Landlord ↔ Tenant lean methodology
- Overall (STATE)
- 87 Strongly Landlord-Friendly
- State Texas
- 87 Strongly Landlord-Friendly · R+5
- County
- — inherits STATE
- City
- — inherits STATE
ZIP-level market 78069
- Home prices YoY
- 2.6%
- Active inventory
- 45
- Price-to-rent
- 9.0×
Monthly cashflow live
- Estimated rent
- $1,714 medium interval (Pro) →
- Mortgage (P&I)
- −$970
- Tax from tax record
- −$78 /mo · $939/yr
- Insurance
- −$77
- HOA
- −$0
- Vacancy / Maint / Mgmt
- −$360
- Net cashflow
- $228
Break-even live
UW: 25.0% down · 7.5% · 30yr · 1.5% tax · 5.0% vac · 8.0% maint · 8.0% mgmt
Financing live
Cash to close
- Down payment
- $46,250
- Closing costs
- $5,550
- Reserves months
- —
- Total cash needed
- —
Loan-product check · same deal, 3 products live
Conventional
25% down · 7.5% · 30yr
- Down + closing
- —
- Monthly P&I
- —
- Monthly cashflow
- —
- DSCR
- —
- Eligible?
- —
Personal DTI + credit; lowest rate.
DSCR
20% down · 8.5% · 30yr
- Down + closing
- —
- Monthly P&I
- —
- Monthly cashflow
- —
- DSCR
- —
- Eligible?
- —
No personal income docs; deal must DSCR.
Hard money
10% down · 12.0% · 12mo
- Down + closing
- —
- Monthly P&I
- —
- Monthly cashflow
- —
- DSCR
- —
- Eligible?
- —
Short-term bridge; refi at stabilization.
Listing history 24 events
-
2026-06-18days on market $185,000 Active 59 DOM
-
2026-06-17days on market $185,000 Active 58 DOM
-
2026-06-16days on market $185,000 Active 57 DOM
-
2026-06-15days on market $185,000 Active 56 DOM
-
2026-06-15days on market $185,000 Active 55 DOM
-
2026-06-13days on market $185,000 Active 54 DOM
-
2026-06-12days on market $185,000 Active 53 DOM
-
2026-06-10days on market $185,000 Active 50 DOM
-
2026-06-08days on market $185,000 Active 49 DOM
-
2026-06-08days on market $185,000 Active 48 DOM
-
2026-06-05days on market $185,000 Active 46 DOM
-
2026-06-03days on market $185,000 Active 44 DOM
-
2026-06-02days on market $185,000 Active 43 DOM
-
2026-06-01days on market $185,000 Active 42 DOM
-
2026-05-31days on market $185,000 Active 41 DOM
-
2026-04-20$185,000 New 715-char remark
Show marketing remark (715 chars)
Experience country living in this spacious 4 bedroom home in Somerset set on .69 acres, offering plenty of room to spread out and enjoy a more relaxed setting. This Texas property with land provides a peaceful atmosphere while still allowing for functional everyday living. The open floor plan connects the living, dining, and kitchen areas, creating a layout that supports easy flow and flexible use of space. The kitchen features stainless steel appliances, a kitchen island, and wood cabinetry, providing a practical setup for daily use and gatherings. The primary bedroom includes a bathroom with a separate bath and shower, offering basic functionality. A dedicated laundry room adds convenience to the layout.
-
2025-02-15historical
-
2024-08-28status Back on Market
-
2024-08-13historical Active Option
-
2024-07-13$195,000 New
-
2024-07-13historical
-
2024-06-08price $200,000
-
2024-05-17$210,000 New
-
2019-05-07soldstatus $45,500
ⓘ Source: listings_history table (triggers on properties + properties_extension) + one-shot
backfill from property_details.listing_events for pre-trigger history.
Tax reassessment forecast TX · Resets to sale price
- Current annual tax
- $939 · $78/mo
- Projected year-2 tax
- $3,386 · $282/mo
- Expected delta
- +$2,447/yr (+$204/mo · 260.7%)
ⓘ Screening estimate from a state-policy table — verify with the county assessor before closing.
Climate risk First Street
- Flood 1/10 Low FEMA zone X (unshaded) · 0% chance over 30 yrs
- Wildfire 6/10 Major
- Heat 8/10 Severe 7 d/yr ≥109°F today · 21 d/yr by 30 yrs out
- Wind 8/10 Severe 80% chance of damaging wind over 30 yrs
- Air quality 1/10 Low 0 unhealthy d/yr today · 0 by 30 yrs out
Nearby sold comps map
Loading sold comps map…
Walkable amenities ~0.75 mi
Loading nearby amenities…
Taxation est. · year 1
- Rental income
- $20,565
- − Mortgage interest
- −$10,363
- − Property taxes
- −$939
- − Insurance
- −$925
- − Repairs & maintenance
- −$1,645
- − Management
- −$1,645
- − Depreciation
- −$5,382
- Taxable loss
- −$334
- Est. tax savings @ 24.0%
- +$80
- After-tax cash flow
- $2,821/yr
For passive investors: Depreciation is non-cash, so a rental often shows a tax loss while cash-flowing — sheltering income. Rental losses are passive: they offset passive income freely, and up to $25,000/yr can offset ordinary (W-2) income if you actively participate and your MAGI is under $100k (phasing out to $0 by $150k); unused losses carry forward. On sale, claimed depreciation is recaptured at up to 25%, and gains may owe capital-gains tax (a 1031 exchange can defer both). Figures are a year-1 estimate at your 24.0% rate — not tax advice; consult a CPA.
Schools (NCES district)
- District
- Lytle ISD
- NCES district ID
- 4828650
- Math proficiency
- 24% ▼ -7.00%
- Reading proficiency
- 27% ▼ -3.00%
- Median HH income
- $54,478
- Composite
- 22.9/100
- National rank
- #8004
- State rank
- #690 of 826 in TX
Livability — Somerset
- Score
- 66/100
- State rank
- #639
- US rank
- #12187
Category grades
Schools grade is shown separately in the Schools card above.
Census & demographics
- Population (ZIP)
- 6,904
Population outlook (Atascosa County) Hauer SSP2
- Today (2025)
- 57,233 people
- By 2030
- 61,729 · +7.9%
- By 2040
- 71,122 · +24.3%
- By 2050
- 80,906 · +41.4%
- By 2075
- 106,134 · +85.4%
- By 2100
- 122,415 · +113.9%
Race, ethnicity, and origin ACS 2023
- Neighborhood character
- Predominantly Hispanic (85%)
- Race & ethnicity
- Hispanic / Latino 85% Two or more races 17% White 15% Native American 2%
- Hispanic origin (detail)
- Mexican 76%
- Common ancestry
- Lithuanian 1% Slovak 1% Romanian 1%
- Foreign-born
- 11% · Canada
- Languages at home
- 40% English-only · Spanish 59% Tagalog/Filipino 1%
Political lean MEDSL · Atascosa
- 2024 margin
- Solid R (+43.3) · D 27.9% · R 71.3%
- 2008→2024 swing
- -32.8pp toward R · 2008: -10.5pp · 2024: -43.3pp
- All cycles
- 2024: R+43.3 2020: R+34.0 2016: R+29.1 2012: R+18.3 2008: R+10.5
Not yet ingested
- Civics
- —
Market trends
- HPI YoY
- ▲ 6.59%
- Current HPI
- 260.4467
- Rent YoY
- —
- Metro
- —
- State GDP YoY
- ▲ 3.95%
- F500 in state
- 110
Industry mix (Fortune 500 HQ in TX)
| Industry | F500 HQs | Revenue |
|---|---|---|
| Energy | 16 | $1,198B |
|
||
| Technology | 5 | $198B |
|
||
| Engineering / Construction | 4 | $72B |
|
||
| Energy Services | 3 | $60B |
|
||
| Utilities | 3 | $41B |
|
||
| Healthcare | 2 | $330B |
|
||
Price history
+306.6% since first listed9 events — show timeline
- 2026-04-20 Listed $185,000 LERA
- 2025-02-15 Listing Removed — LERA
- 2024-08-28 Relisted — LERA
- 2024-08-13 Contingent — LERA
- 2024-07-13 Listing Removed — LERA
- 2024-07-13 Listed $195,000 LERA
- 2024-06-08 Price Changed $200,000 LERA
- 2024-05-17 Listed $210,000 LERA
- 2019-05-07 Sold (Public Records) $45,500 Public Records
Property tax history
+0.1%/yrLatest (2025): $939 · +11.9% YoY. Source: county tax records.
Cash-flow waterfall
monthlySold comps — $/sqft
last 12 mo · ≤1 miLoading sold comps…