 5-Plex
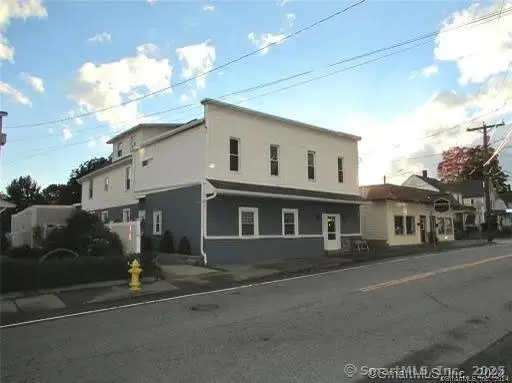
243 N Elm St · Torrington, CT
Flood risk 1/10 · Minimal
- FEMA flood zone
- X
- Chance of flooding over 30 yrs
- 0.0%
- Est. flood insurance / yr
- $473 – $860
Fire risk 3/10 · Minor
- Est. fire insurance / yr
- $829 – $1,539
Heat risk 4/10 · Minor
- Hot days now (above 93°F)
- 8 days/yr
- Hot days in 30 yrs
- 18 days/yr
Wind risk 5/10 · Moderate
- Chance of severe wind over 30 yrs
- 26.0%
Air-quality risk 2/10 · Minimal
- Unhealthy air days now
- 1 days/yr
- Unhealthy air days in 30 yrs
- 1 days/yr
Risk factors via First Street. Map © Google.
Why this score? — see what drove the D+ grade
The composite is a weighted blend of 9 inputs, each scored 0–100. Each bar is that input's sub-score; the figure is the points it added to the 100-point composite (weight × sub-score).
- Cash flow +18.9/30.0
- ARV discount +7.5/15.0
- DSCR +6.0/10.0
- 1% rule +4.3/10.0
- Rent growth +4.0/5.0
- Livability +3.8/5.0
- Schools +2.7/10.0
- Condition / age +2.5/5.0
- Appreciation +0.0/10.0
$975,000
🖨 Deal sheet 📄 Offer letter ✓ Due diligence
Multi-family units
County records classify this as Multi-Family (5+ Unit). Listing-text estimate: 5 units. confirmed
5+ unit building — per-unit beds/baths from public records are typically unavailable; the breakdown below (if shown) is an estimate from the listing text.
Listing remarks MLS
ATTENTION INVESTORS! Turnkey 5-unit income-producing property in the desirable north end of town with a 7.25% cap rate! This fully occupied AND FULLY UPDATED multi-family includes one spacious 2-bedroom unit, three well-designed 3-bedroom units, and one 4 bedroom unit all with functional layouts. Recent upgrades include a new heating system and water heaters (2021), a newer roof, updated heating systems, and many replaced windows, ensuring minimal maintenance. The basement features newly added laundry and storage areas for tenant convenience. Additionally, the property comes with a SEPERATLY DEEDED LOT, currently serving as a large parking area, offering extra value and future potential. Don't miss this opportunity! All utilities are separate!
Key facts
- Replaced windows
- Newer roof
- Newly added laundry
Tags
Neighborhood map
What this means for you Summary
Snapshot
- This is a 1×2bd/1ba + 3×3bd/1ba + 1×4bd/1ba units multifamily listed at $975k.
Deal economics
- At list price, monthly cash flow is $1k ($12k/yr) — positive. Per door: $201/mo.
- The deal already cash-flows at list — no discount required.
- To meet the 1% rule (rent ≥ 1% of price), the offer needs to be $903k (7.4% below list).
- Recommended offer: $887k (9.0% below list) — sets the bar for market timing.
- Cap rate 7.5% vs local median 3.9% in Torrington — top-decile yield for the area; either an underpriced asset or a hidden risk that comps aren't pricing in. Stress-test before assuming the spread holds.
Location & tenants
- Location reads 76/100 on livability (#53 in CT, #3,449 nationally) — a middle-class / working-renter tenant base. Strengths: crime A+, cost of living A+, housing A+; Watch: schools D, commute F.
- Torrington School District (town): math 22% / reading 39% proficiency, ranked #125 of 153 in CT (top 82%) — families likely to look elsewhere, expect single-tenant / working-renter base with shorter leases.
- Market conditions: Rents rising fast (+5.9%/yr); 188 active listings in the ZIP; 154 units permitted in Northwest Hills Planning Region in 2024 (6 in 5+ unit buildings).
- At $9,031/mo this rent would consume 153% of the median local household income ($71k/yr) (locally 1401% of renters already pay >50% of income on rent) — very limited rent-growth headroom before tenants either downsize or default.
Forward outlook
- Local home prices are declining (-3.0%/yr); year-one equity from $7k of loan paydown is wiped out by about $29k of value loss. Plan a longer hold.
Negotiation context
- It's been on market 101 days — a 9% lower offer ($887k) is reasonable based on typical stale-listing flexibility.
- 8 sale attempts since 19y ago with the ask held roughly flat each time — persistent listings suggest the price (not the market) is what's stuck; bring a comps-based counter.
- Current owner paid $550k; list at $975k implies a 77% gain — meaningful room to come down on a strong offer.
Risks & watch-outs
- Watch-outs: built in 1900 — expect roof / HVAC / electrical / plumbing capex.
- Climate carrying-cost: moderate wind risk, 26% chance of damaging wind over 30y — expect insurance premiums to compound above CPI over the hold.
Questions for the listing agent
- It's been on market 101 days. Have you received any prior offers? Is the seller open to a 9% concession, seller financing, or rate buy-down credit?
- Can we see the unit-by-unit rent roll, current vacancy, and any below-market leases? What's the average tenancy length?
- What capital expenditures (roof, boiler, parking lot, exteriors) have been made in the last 5 years, and what's planned in the next 2?
- Built in 1900 — when were the roof, HVAC, electrical panel, plumbing, and water heater last replaced?
- Why hasn't it sold? Are there any deal-killer items the seller is aware of (foundation, flood, title, zoning, code violations)?
- Is there a deadline driving the sale (1031 exchange, divorce, estate, relocation)? That informs how much negotiation room exists.
- Schools are D-rated, which usually means shorter tenancies and higher turnover. Who's the typical renter profile here, and what's been the actual vacancy rate?
- The area grade is low — what's the realistic commute time and amenity access for the typical tenant pool here? Any planned neighborhood developments (good or bad) we should know about?
- What's the average days-on-market for RENTAL listings here right now (not sales)? A rising rental-DOM trend means longer vacancies and softer asking-rent achievability than the comps imply.
- What's the recent tenant-quality profile in this submarket — average credit score on applications, eviction rate, late-payment / NSF rate, and stable-employment percentage? A property-management company in the area should have these aggregated.
- How much new apartment / multifamily construction is in the pipeline within 1–3 miles? Heavy new supply (>2% of stock underway) typically softens rents 12–24 months out; light construction supports rent growth.
Investment metrics
- 1% rule
- 0.93% ✗
- Cap rate
- 7.53%
- Cash-on-cash
- 4.42%
- DSCR
- 1.20
- GRM
- 9.0
CMA / ARV
- ARV (median comp)
- $497,312
- List price
- $975,000
- Delta
- 96.05%
- Verdict
- OVERPRICED
- Comps
- 12 within 1.0 mi
Projected returns pro-forma
-3.0% appreciation · 5.89% rent growth · sell at horizon
- IRR
- -6.5%
- Equity multiple
- 0.75×
- Total profit
- $-67,124
- Equity at exit
- $145,376
- IRR
- 6.2%
- Equity multiple
- 1.52×
- Total profit
- $140,756
- Equity at exit
- $84,300
Cash invested: $273,000 (down + closing). Projections, not guarantees.
Landlord ↔ Tenant lean methodology
- Overall (STATE)
- 27 Tenant-Leaning
- State Connecticut
- 27 Tenant-Leaning · D+7
- County
- — inherits STATE
- City
- — inherits STATE
ZIP-level market 06790
- Rents YoY
- 5.9%
- Active inventory
- 188
- Price-to-rent
- 47.9×
Monthly cashflow live
- Estimated rent
- $9,031 high interval (Pro) →
- Mortgage (P&I)
- −$5,113
- Tax from tax record
- −$609 /mo · $7,308/yr
- Insurance
- −$406
- HOA
- −$0
- Vacancy / Maint / Mgmt
- −$1,897
- Net cashflow
- $1,006
Break-even live
5-unit breakdown (identical units grouped — click to expand)
| Units | Beds | Baths | Est. rent |
|---|---|---|---|
| 1× unit | 2 | 1 | $1,696 |
| 3× units | 3 | 1 | $5,373 |
| #2 | 3 | 1 | $1,791 |
| #3 | 3 | 1 | $1,791 |
| #4 | 3 | 1 | $1,791 |
| 1× unit | 4 | 1 | $1,962 |
| Total (5 units) | $9,031 | ||
UW: 25.0% down · 7.5% · 30yr · 1.5% tax · 5.0% vac · 8.0% maint · 8.0% mgmt
Financing live
Cash to close
- Down payment
- $243,750
- Closing costs
- $29,250
- Reserves months
- —
- Total cash needed
- —
Loan-product check · same deal, 3 products live
Conventional
25% down · 7.5% · 30yr
- Down + closing
- —
- Monthly P&I
- —
- Monthly cashflow
- —
- DSCR
- —
- Eligible?
- —
Personal DTI + credit; lowest rate.
DSCR
20% down · 8.5% · 30yr
- Down + closing
- —
- Monthly P&I
- —
- Monthly cashflow
- —
- DSCR
- —
- Eligible?
- —
No personal income docs; deal must DSCR.
Hard money
10% down · 12.0% · 12mo
- Down + closing
- —
- Monthly P&I
- —
- Monthly cashflow
- —
- DSCR
- —
- Eligible?
- —
Short-term bridge; refi at stabilization.
Listing history 38 events
-
2026-06-19days on market $975,000 Active 101 DOM
-
2026-06-18days on market $975,000 Active 100 DOM
-
2026-06-17days on market $975,000 Active 99 DOM
-
2026-06-16days on market $975,000 Active 98 DOM
-
2026-06-15days on market $975,000 Active 97 DOM
-
2026-06-14days on market $975,000 Active 95 DOM
-
2026-06-13days on market $975,000 Active 94 DOM
-
2026-06-10days on market $975,000 Active 92 DOM
-
2026-06-09days on market $975,000 Active 91 DOM
-
2026-06-08days on market $975,000 Active 90 DOM
-
2026-06-07days on market $975,000 Active 89 DOM
-
2026-06-05days on market $975,000 Active 86 DOM
-
2026-06-03days on market $975,000 Active 85 DOM
-
2026-06-02days on market $975,000 Active 84 DOM
-
2026-06-01days on market $975,000 Active 83 DOM
-
2026-05-31days on market $975,000 Active 82 DOM
-
2026-05-30days on market $975,000 Active 81 DOM
-
2026-04-07price $975,000 753-char remark
Show marketing remark (753 chars)
ATTENTION INVESTORS! Turnkey 5-unit income-producing property in the desirable north end of town with a 7.25% cap rate! This fully occupied AND FULLY UPDATED multi-family includes one spacious 2-bedroom unit, three well-designed 3-bedroom units, and one 4 bedroom unit all with functional layouts. Recent upgrades include a new heating system and water heaters (2021), a newer roof, updated heating systems, and many replaced windows, ensuring minimal maintenance. The basement features newly added laundry and storage areas for tenant convenience. Additionally, the property comes with a SEPERATLY DEEDED LOT, currently serving as a large parking area, offering extra value and future potential. Don't miss this opportunity! All utilities are separate!
-
2026-03-10$995,000 Active 753-char remark
Show marketing remark (753 chars)
ATTENTION INVESTORS! Turnkey 5-unit income-producing property in the desirable north end of town with a 7.25% cap rate! This fully occupied AND FULLY UPDATED multi-family includes one spacious 2-bedroom unit, three well-designed 3-bedroom units, and one 4 bedroom unit all with functional layouts. Recent upgrades include a new heating system and water heaters (2021), a newer roof, updated heating systems, and many replaced windows, ensuring minimal maintenance. The basement features newly added laundry and storage areas for tenant convenience. Additionally, the property comes with a SEPERATLY DEEDED LOT, currently serving as a large parking area, offering extra value and future potential. Don't miss this opportunity! All utilities are separate!
-
2025-10-17historical
-
2025-04-16$1,150,000 Active
-
2024-05-28soldstatus $550,000 Closed
-
2024-04-02status Under Contract
-
2024-03-28status Active
-
2024-02-04status Under Contract
-
2024-01-20$550,000 Active
-
2017-05-15soldstatus $266,000
-
2017-05-11soldstatus $266,000
-
2016-11-14$295,000
-
2012-12-31historical
-
2012-02-17$329,900
-
2011-08-01historical
-
2010-11-12$350,000
-
2007-07-16soldstatus $205,000
-
2007-07-12soldstatus $95,000
-
2007-04-10$99,900
-
1990-07-31soldstatus $243,000
-
1988-09-16soldstatus $132,000
ⓘ Source: listings_history table (triggers on properties + properties_extension) + one-shot
backfill from property_details.listing_events for pre-trigger history.
Tax reassessment forecast CT · Partial reset (capped growth)
- Current annual tax
- $7,308 · $609/mo
- Projected year-2 tax
- $14,086 · $1,174/mo
- Expected delta
- +$6,778/yr (+$565/mo · 92.8%)
ⓘ Screening estimate from a state-policy table — verify with the county assessor before closing.
Climate risk First Street
- Flood 1/10 Low FEMA zone X · 0% chance over 30 yrs
- Wildfire 3/10 Moderate
- Heat 4/10 Moderate 8 d/yr ≥93°F today · 18 d/yr by 30 yrs out
- Wind 5/10 Major 26% chance of damaging wind over 30 yrs
- Air quality 2/10 Low 1 unhealthy d/yr today · 1 by 30 yrs out
Nearby sold comps map
Loading sold comps map…
Walkable amenities ~0.75 mi
Loading nearby amenities…
Taxation est. · year 1
- Rental income
- $108,372
- − Mortgage interest
- −$54,615
- − Property taxes
- −$7,308
- − Insurance
- −$4,875
- − Repairs & maintenance
- −$8,670
- − Management
- −$8,670
- − Depreciation
- −$28,364
- Taxable loss
- −$4,129
- Est. tax savings @ 24.0%
- +$991
- After-tax cash flow
- $13,066/yr
For passive investors: Depreciation is non-cash, so a rental often shows a tax loss while cash-flowing — sheltering income. Rental losses are passive: they offset passive income freely, and up to $25,000/yr can offset ordinary (W-2) income if you actively participate and your MAGI is under $100k (phasing out to $0 by $150k); unused losses carry forward. On sale, claimed depreciation is recaptured at up to 25%, and gains may owe capital-gains tax (a 1031 exchange can defer both). Figures are a year-1 estimate at your 24.0% rate — not tax advice; consult a CPA.
Schools (NCES district)
- District
- Torrington School District
- NCES district ID
- 0904590
- Math proficiency
- 22% ▼ -8.00%
- Reading proficiency
- 39% ▼ -6.00%
- Median HH income
- $53,647
- Composite
- 26.9/100
- National rank
- #7087
- State rank
- #125 of 153 in CT
Livability — Torrington
- Score
- 76/100
- State rank
- #53
- US rank
- #3449
Category grades
Schools grade is shown separately in the Schools card above.
Census & demographics
- Census place
- Torrington, CT
- County
- Litchfield County · 81,203 people
- City population
- 35,566
- Metro
- Torrington, CT
- Population (ZIP)
- 35,566
- Household income
- $70,912
- Rent vs Own
- Severe rent burden
- 1401.0
Population outlook (Northwest Hills County) Hauer SSP2
- By 2040
- 118,998
Race, ethnicity, and origin ACS 2023
- Neighborhood character
- Predominantly White (73%)
- Race & ethnicity
- White 73% Hispanic / Latino 14% Two or more races 8% Black 6% Asian 3%
- Hispanic origin (detail)
- Puerto Rican 5% Dominican 2%
- Common ancestry
- Romanian 8% Lithuanian 5% Slovak 2%
- Foreign-born
- 12% · Canada, South Korea, Jamaica
- Languages at home
- 86% English-only · Spanish 8% Other Indo-European 2% Russian/Polish/Slavic 1%
Political lean MEDSL · Northwest Hills
- 2024 margin
- Toss-up / Even · D 48.6% · R 49.9% · Other 1.6%
- All cycles
- 2024: R+1.3
Not yet ingested
- Civics
- —
Market trends
- HPI YoY
- ▼ -122.78%
- Current HPI
- 208.4818
- Rent YoY
- ▲ 5.89%
- Metro
- Torrington, CT
- State GDP YoY
- ▲ 1.06%
- F500 in state
- 38
Industry mix (Fortune 500 HQ in CT)
| Industry | F500 HQs | Revenue |
|---|---|---|
| Industrial Machinery | 4 | $38B |
|
||
| Insurance | 3 | $71B |
|
||
| Financial Services | 2 | $25B |
|
||
| Transportation / Logistics | 2 | $18B |
|
||
| Healthcare | 1 | $247B |
|
||
| Telecommunications | 1 | $55B |
|
||
Price history
+638.6% since first listed21 events — show timeline
- 2026-04-07 Price Changed $975,000 Smart MLS
- 2026-03-10 Listed $995,000 Smart MLS
- 2025-10-17 Listing Removed — Smart MLS
- 2025-04-16 Listed $1,150,000 Smart MLS
- 2024-05-28 Sold (MLS) $550,000 Smart MLS
- 2024-04-02 Pending — Smart MLS
- 2024-03-28 Relisted — Smart MLS
- 2024-02-04 Pending — Smart MLS
- 2024-01-20 Listed $550,000 Smart MLS
- 2017-05-15 Sold (Public Records) $266,000 Public Records
- 2017-05-11 Sold (MLS) $266,000 Smart MLS
- 2016-11-14 Listed $295,000 Smart MLS
- 2012-12-31 Listing Removed — Smart MLS
- 2012-02-17 Listed $329,900 Smart MLS
- 2011-08-01 Listing Removed — Smart MLS
- 2010-11-12 Listed $350,000 Smart MLS
- 2007-07-16 Sold (Public Records) $205,000 Public Records
- 2007-07-12 Sold (MLS) $95,000 Smart MLS
- 2007-04-10 Listed $99,900 Smart MLS
- 1990-07-31 Sold (Public Records) $243,000 Public Records
- 1988-09-16 Sold (Public Records) $132,000 Public Records
Property tax history
+1.5%/yrLatest (2023): $7,308 · +1.7% YoY. Source: county tax records.
Cash-flow waterfall
monthlySold comps — $/sqft
last 12 mo · ≤1 miLoading sold comps…