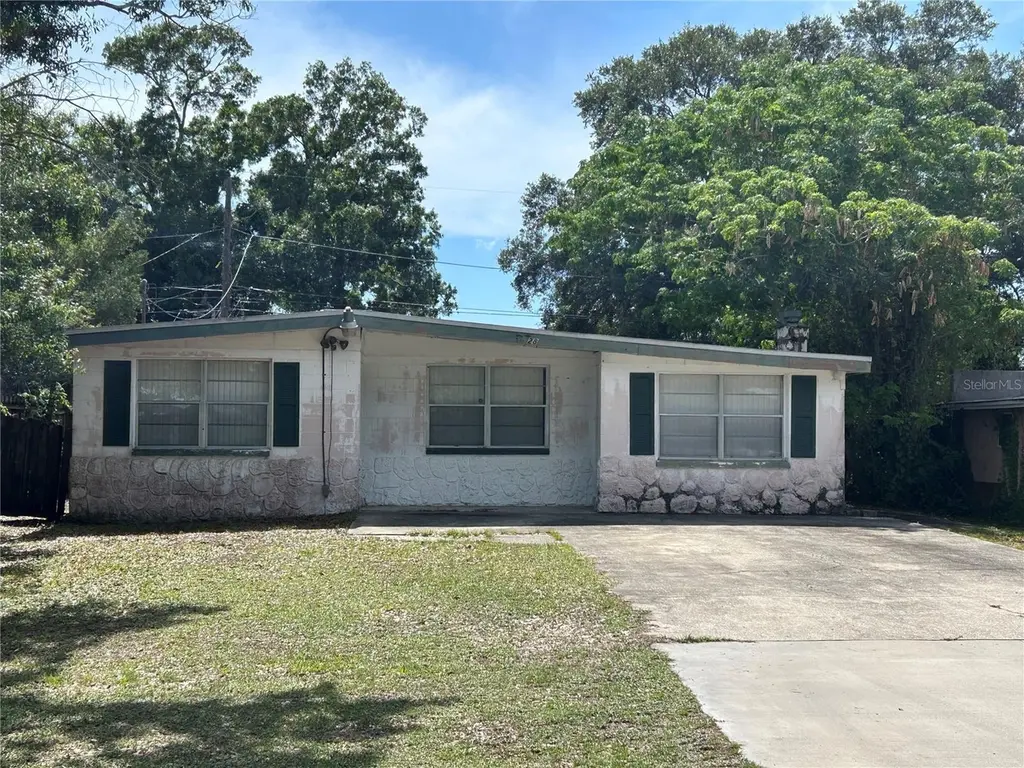
6328 30th Way N · Lealman, FL
Flood risk 1/10 · Minimal
- FEMA flood zone
- X (unshaded)
- Chance of flooding over 30 yrs
- 0.0%
- Est. flood insurance / yr
- $507 – $1,088
Fire risk 1/10 · Minimal
- Est. fire insurance / yr
- $947 – $1,759
Heat risk 10/10 · Severe
- Hot days now (above 106°F)
- 7 days/yr
- Hot days in 30 yrs
- 26 days/yr
Wind risk 10/10 · Severe
- Chance of severe wind over 30 yrs
- 99.0%
Air-quality risk 4/10 · Minor
- Unhealthy air days now
- 4 days/yr
- Unhealthy air days in 30 yrs
- 4 days/yr
Risk factors via First Street. Map © Google.
Why this score? — see what drove the B- grade
The composite is a weighted blend of 9 inputs, each scored 0–100. Each bar is that input's sub-score; the figure is the points it added to the 100-point composite (weight × sub-score).
- Cash flow +23.9/30.0
- ARV discount +15.0/15.0
- DSCR +7.7/10.0
- 1% rule +5.7/10.0
- Schools +4.3/10.0
- Livability +4.0/5.0
- Condition / age +2.5/5.0
- Rent growth +1.9/5.0
- Appreciation +0.0/10.0
$280,000
🖨 Deal sheet 📄 Offer letter ✓ Due diligence
Listing remarks
This property presents a wonderful renovation opportunity, featuring spacious living areas and an in-ground swimming pool. With the right expertise, it can be transformed into a dream residence. Ideally situated in the center of Saint Petersburg, the location provides easy access to highways and is conveniently located near shopping malls and restaurants.
Key facts
- Near restaurants
- Near shopping malls
- 4,992 sq ft lot
Tags
Property features AI
Finance
- Other: Zoned R-4
Exterior
- Utilities: Public water; Public sewer; Public utilities
- Home design: Single family residence; One story; Faces east; Entry level: One
- Construction: Block construction; Shingle roof; Slab foundation; Built on a 50x100 lot (approx. 0.11 acres)
- Exterior features: Private in-ground pool; Paved road access
Interior
- Kitchen: Range
- Bedrooms: 4 bedrooms
- Flooring: Tile
- Bathrooms: 1 full bathroom
- Heating & cooling: Central heating; Central air conditioning
- Interior features: Ceiling fans
- Laundry & utility: Laundry inside
Neighborhood map
What this means for you Summary
Snapshot
- This is a 4-bed/1.0-bath single-family listed at $280k.
Deal economics
- At list price, monthly cash flow is $543 ($7k/yr) — positive.
- The deal already cash-flows at list — no discount required.
- Meets the 1% rule at list price ($3k rent vs $280k).
- Recommended offer: $276k (1.5% below list) — sets the bar for market timing.
- Cap rate 8.6% vs local median 4.7% in Lealman — top-decile yield for the area; either an underpriced asset or a hidden risk that comps aren't pricing in. Stress-test before assuming the spread holds.
Location & tenants
- Location reads 81/100 on livability (#83 in FL, #1,394 nationally) — a professional / high-income tenant draw. Strengths: commute A+, cost of living A+, housing A+; Watch: crime D+, schools F, employment F.
- Pinellas (suburban): math 51% / reading 51% proficiency, ranked #31 of 73 in FL (top 42%) — acceptable for families but not a draw, mixed tenant base, ~2y average lease.
- Market conditions: Rents soft (-2.2%/yr); 383 active listings in the ZIP; 17 comparable units currently listed for rent nearby; rentals at typical pace (median 15d on market — plan ~3-4 weeks tenant-placement turnaround); 2,676 units permitted in Pinellas County in 2024 (1,422 in 5+ unit buildings).
- At $2,984/mo this rent would consume 53% of the median local household income ($67k/yr) (locally 1000% of renters already pay >50% of income on rent) — very limited rent-growth headroom before tenants either downsize or default.
Forward outlook
- Local home prices are declining (-3.0%/yr); year-one equity from $2k of loan paydown is wiped out by about $8k of value loss. Plan a longer hold.
- Pinellas County population projected at +14% by 2050 — modest demand growth; plan on rents tracking national, not racing it.
Negotiation context
- It's been on market 27 days — a 2% lower offer ($276k) is reasonable based on typical stale-listing flexibility.
- 2 sale attempts since 17y ago with the ask held roughly flat each time — persistent listings suggest the price (not the market) is what's stuck; bring a comps-based counter.
- Current owner paid $66k; list at $280k implies a 326% gain — meaningful room to come down on a strong offer.
Risks & watch-outs
- Climate carrying-cost: severe wind risk, 99% chance of damaging wind over 30y; extreme-heat days projected 7→26/yr by 2055 (HVAC capex compounding) — expect insurance premiums to compound above CPI over the hold.
Questions for the listing agent
- Built in 1973 — when were the roof, HVAC, electrical panel, plumbing, and water heater last replaced?
- Is there a deadline driving the sale (1031 exchange, divorce, estate, relocation)? That informs how much negotiation room exists.
- Schools are F-rated, which usually means shorter tenancies and higher turnover. Who's the typical renter profile here, and what's been the actual vacancy rate?
- Crime grade is D in this area — have there been break-ins, vandalism, or insurance claims at this property in the last 3 years? What carrier currently insures it and at what premium?
- What's the average days-on-market for RENTAL listings here right now (not sales)? A rising rental-DOM trend means longer vacancies and softer asking-rent achievability than the comps imply.
- What's the recent tenant-quality profile in this submarket — average credit score on applications, eviction rate, late-payment / NSF rate, and stable-employment percentage? A property-management company in the area should have these aggregated.
- How much new for-sale + rental construction is in the pipeline within 1–3 miles? Heavy new supply typically softens prices + rents 12–24 months out; constrained supply supports both.
Investment metrics
- 1% rule
- 1.07% ✓
- Cap rate
- 8.62%
- Cash-on-cash
- 8.31%
- DSCR
- 1.37
- GRM
- 7.8
CMA / ARV
- ARV (on-the-fly)
- $446,368
- Comps found
- 12
Show comp detail 12 sales within ~0.75 mi
| Address | Dist | Beds/Ba | Sqft | Sold | Price | $/sf | Match |
|---|---|---|---|---|---|---|---|
| 6642 27th St N | 0.37mi | 3/2.5 (-1) | 1,482 (-2%) | 1mo | $220,029 | $148 | 68 |
| 6475 29th Way N | 0.17mi | 3/2.0 (-1) | 1,580 (+5%) | 13mo | $528,000 | $334 | 65 |
| 6533 26th St N | 0.45mi | 4/2.0 | 1,406 (-7%) | 3mo | $385,000 | $274 | 61 |
| 2650 60th Ave N | 0.42mi | 3/2.0 (-1) | 1,408 (-7%) | 10mo | $430,000 | $305 | 52 |
| 6506 29th St N | 0.19mi | 3/2.0 (-1) | 1,611 (+7%) | 23mo | $535,000 | $332 | 51 |
| 5838 31st St N | 0.29mi | 4/2.0 | 1,644 (+9%) | 20mo | $248,000 | $151 | 51 |
| 6612 27th Way N | 0.31mi | 3/2.0 (-1) | 1,368 (-9%) | 15mo | $405,000 | $296 | 48 |
| 3450 Beechwood Ter N | 0.59mi | 4/2.0 | 1,340 (-11%) | 8mo | $395,000 | $295 | 44 |
| 2547 57th Pl N | 0.59mi | 3/2.0 (-1) | 1,443 (-4%) | 16mo | $494,900 | $343 | 42 |
| 3881 67th Ave N | 0.73mi | 3/1.5 (-1) | 1,450 (-4%) | 22mo | $370,000 | $255 | 35 |
| 5620 37th St N | 0.67mi | 3/2.0 (-1) | 1,300 (-14%) | 19mo | $428,000 | $329 | 21 |
| 6400 23rd Ln N | 0.66mi | 3/2.0 (-1) | 1,700 (+13%) | 23mo | $439,000 | $258 | 19 |
Match score weights: distance 35% · size 25% · config 20% · recency 20%. Top-matched comps best support the ARV.
Projected returns pro-forma
-3.0% appreciation · 0.0% rent growth · sell at horizon
- IRR
- -7.0%
- Equity multiple
- 0.75×
- Total profit
- $-19,559
- Equity at exit
- $41,749
- IRR
- -1.4%
- Equity multiple
- 0.92×
- Total profit
- $-6,412
- Equity at exit
- $24,209
Cash invested: $78,400 (down + closing). Projections, not guarantees.
Landlord ↔ Tenant lean methodology
- Overall (STATE)
- 87 Strongly Landlord-Friendly
- State Florida
- 87 Strongly Landlord-Friendly · R+3
- County
- — inherits STATE
- City
- — inherits STATE
ZIP-level market 33702
- Rents YoY
- -2.2%
- Active inventory
- 383
- Price-to-rent
- 7.8×
Monthly cashflow live
- Estimated rent
- $2,984 high interval (Pro) →
- Mortgage (P&I)
- −$1,468
- Tax from tax record
- −$230 /mo · $2,755/yr
- Insurance
- −$117
- HOA
- −$0
- Vacancy / Maint / Mgmt
- −$627
- Net cashflow
- $543
Break-even live
UW: 25.0% down · 7.5% · 30yr · 1.5% tax · 5.0% vac · 8.0% maint · 8.0% mgmt
Financing live
Cash to close
- Down payment
- $70,000
- Closing costs
- $8,400
- Reserves months
- —
- Total cash needed
- —
Loan-product check · same deal, 3 products live
Conventional
25% down · 7.5% · 30yr
- Down + closing
- —
- Monthly P&I
- —
- Monthly cashflow
- —
- DSCR
- —
- Eligible?
- —
Personal DTI + credit; lowest rate.
DSCR
20% down · 8.5% · 30yr
- Down + closing
- —
- Monthly P&I
- —
- Monthly cashflow
- —
- DSCR
- —
- Eligible?
- —
No personal income docs; deal must DSCR.
Hard money
10% down · 12.0% · 12mo
- Down + closing
- —
- Monthly P&I
- —
- Monthly cashflow
- —
- DSCR
- —
- Eligible?
- —
Short-term bridge; refi at stabilization.
Rent comps 17 comps
| Address | Beds | Baths | Sqft | Rent | $/sqft | DOM | Units | Dist |
|---|---|---|---|---|---|---|---|---|
| 6379 29th St N Saint Petersburg, FL | 3.0 | 2.0 | 1323 | $2,869 | $2.17 | 24d | 1 | 0.17mi |
| 3132 56th Ave N Saint Petersburg, FL | 3.0 | 2.0 | 1063 | $2,850 | $2.68 | 24d | 1 | 0.44mi |
| 2612 68th Ave N Saint Petersburg, FL | 5.0 | 2.0 | 1438 | $3,000 | $2.09 | 24d | 1 | 0.49mi |
| 5246 Neil Dr Saint Petersburg, FL | 3.0 | 3.0 | 1713 | $3,450 | $2.01 | 21d | 1 | 0.61mi |
| 3725 57th Ave N Saint Petersburg, FL | 3.0 | 2.0 | 1800 | $3,200 | $1.78 | 4d | 1 | 0.67mi |
| 4057 71st Ter N Pinellas Park, FL | 3.0 | 2.5 | 1420 | $2,650 | $1.87 | 4d | 1 | 1.03mi |
| 1770 63rd Ave N Saint Petersburg, FL | 3.0 | 2.0 | 1782 | $3,300 | $1.85 | 7d | 1 | 1.08mi |
| 6630 17th Ln N Saint Petersburg, FL | 3.0 | 1.0 | 1324 | $2,489 | $1.88 | 14d | 1 | 1.08mi |
| 1770 73rd Ave N Saint Petersburg, FL | 4.0 | 2.0 | 1484 | $4,500 | $3.03 | 4d | 1 | 1.25mi |
| 6900 16th St N Saint Petersburg, FL | 3.0 | 1.0 | 1150 | $2,095 | $1.82 | 4d | 1 | 1.26mi |
| 5924 15th Way N Saint Petersburg, FL | 3.0 | 2.0 | 1104 | $3,200 | $2.90 | 4d | 1 | 1.28mi |
| 7111 16th St N Saint Petersburg, FL | 3.0 | 1.0 | 1130 | $2,695 | $2.38 | 4d | 1 | 1.34mi |
| 4627 67th Ave N Pinellas Park, FL | 3.0 | 2.5 | 1610 | $2,500 | $1.55 | 24d | 1 | 1.35mi |
| 3110 Grand Ave Pinellas Park, FL | 1.0–3.0 | 1.0–2.0 | 1104 | $3,038 | $2.75 | 1d | 34 | 1.35mi |
| 4631 69th Pl N Pinellas Park, FL | 3.0 | 2.5 | 1420 | $2,595 | $1.83 | 24d | 1 | 1.39mi |
| 1416 55th Ave N St Petersburg, FL | 3.0 | 2.0 | 1300 | $4,600 | $3.54 | 24d | 1 | 1.42mi |
| 6898 47th Ln N Pinellas Park, FL | 3.0 | 2.5 | 1500 | $2,525 | $1.68 | 24d | 1 | 1.49mi |
Listing history 16 events
-
2026-06-18days on market $280,000 Active 27 DOM
-
2026-06-17days on market $280,000 Active 26 DOM
-
2026-06-16days on market $280,000 Active 25 DOM
-
2026-06-15days on market $280,000 Active 24 DOM
-
2026-06-13days on market $280,000 Active 22 DOM
-
2026-06-09days on market $280,000 Active 18 DOM
-
2026-06-08days on market $280,000 Active 17 DOM
-
2026-06-07days on market $280,000 Active 16 DOM
-
2026-06-04days on market $280,000 Active 13 DOM
-
2026-06-03days on market $280,000 Active 12 DOM
-
2026-06-02days on market $280,000 Active 11 DOM
-
2026-06-01days on market $280,000 Active 10 DOM
-
2026-05-31days on market $280,000 Active 9 DOM
-
2026-05-22$280,000 Active
-
2009-12-08$65,000
-
1998-06-11soldstatus $65,800
ⓘ Source: listings_history table (triggers on properties + properties_extension) + one-shot
backfill from property_details.listing_events for pre-trigger history.
Tax reassessment forecast FL · Resets to sale price
- Current annual tax
- $2,755 · $230/mo
- Projected year-2 tax
- $2,755 · $230/mo
- Expected delta
- $0/yr ($0/mo · 0.0%)
ⓘ Screening estimate from a state-policy table — verify with the county assessor before closing.
Climate risk First Street
- Flood 1/10 Low FEMA zone X (unshaded) · 0% chance over 30 yrs
- Wildfire 1/10 Low
- Heat 10/10 Extreme 7 d/yr ≥106°F today · 26 d/yr by 30 yrs out
- Wind 10/10 Extreme 99% chance of damaging wind over 30 yrs
- Air quality 4/10 Moderate 4 unhealthy d/yr today · 4 by 30 yrs out
Nearby sold comps map
Loading sold comps map…
Walkable amenities ~0.75 mi
Loading nearby amenities…
Taxation est. · year 1
- Rental income
- $35,812
- − Mortgage interest
- −$15,684
- − Property taxes
- −$2,755
- − Insurance
- −$1,400
- − Repairs & maintenance
- −$2,865
- − Management
- −$2,865
- − Depreciation
- −$8,145
- Taxable income
- $2,098
- Est. tax owed @ 24.0%
- −$503
- After-tax cash flow
- $6,013/yr
For passive investors: Depreciation is non-cash, so a rental often shows a tax loss while cash-flowing — sheltering income. Rental losses are passive: they offset passive income freely, and up to $25,000/yr can offset ordinary (W-2) income if you actively participate and your MAGI is under $100k (phasing out to $0 by $150k); unused losses carry forward. On sale, claimed depreciation is recaptured at up to 25%, and gains may owe capital-gains tax (a 1031 exchange can defer both). Figures are a year-1 estimate at your 24.0% rate — not tax advice; consult a CPA.
Schools (NCES district)
- District
- Pinellas
- NCES district ID
- 1201560
- Math proficiency
- 51% ▼ -5.00%
- Reading proficiency
- 51% ▼ -3.00%
- Median HH income
- $46,270
- Composite
- 43.27/100
- National rank
- #3046
- State rank
- #31 of 73 in FL
Livability — Lealman
- Score
- 81/100
- State rank
- #83
- US rank
- #1394
Category grades
Schools grade is shown separately in the Schools card above.
Census & demographics
- Census place
- Lealman, FL
- County
- Pinellas County · 939,478 people
- City population
- 20,103
- Metro
- Tampa-St. Petersburg-Clearwater, FL
- Population (ZIP)
- 31,294
- Household income
- $67,463
- Rent vs Own
- Severe rent burden
- 1000.0
Population outlook (Pinellas County) Hauer SSP2
- Today (2025)
- 1,027,532 people
- By 2030
- 1,063,586 · +3.5%
- By 2040
- 1,125,020 · +9.5%
- By 2050
- 1,168,637 · +13.7%
- By 2075
- 1,265,188 · +23.1%
- By 2100
- 1,260,357 · +22.7%
Race, ethnicity, and origin ACS 2023
- Neighborhood character
- Predominantly White (73%)
- Race & ethnicity
- White 73% Hispanic / Latino 12% Two or more races 10% Black 6% Asian 4%
- Hispanic origin (detail)
- Mexican 2% Puerto Rican 3% Cuban 2%
- Common ancestry
- Lithuanian 4% Romanian 3% Slovak 2%
- Foreign-born
- 12% · Canada, Vietnam, Jamaica
- Languages at home
- 83% English-only · Spanish 8% Russian/Polish/Slavic 3% Other Indo-European 1%
Political lean MEDSL · Pinellas
- 2024 margin
- Lean R (+5.2) · D 46.9% · R 52.1%
- 2008→2024 swing
- -13.5pp toward R · 2008: 8.3pp · 2024: -5.2pp
- All cycles
- 2024: R+5.2 2020: D+0.2 2016: R+1.1 2012: D+5.6 2008: D+8.3
Not yet ingested
- Civics
- —
Market trends
- HPI YoY
- ▼ -516.17%
- Current HPI
- 347.1781
- Rent YoY
- ▼ -2.22%
- Metro
- Tampa-St. Petersburg-Clearwater, FL
- State GDP YoY
- ▲ 3.28%
- F500 in state
- 36
Industry mix (Fortune 500 HQ in FL)
| Industry | F500 HQs | Revenue |
|---|---|---|
| Industrial Technology | 2 | $29B |
|
||
| Insurance | 2 | $17B |
|
||
| Retail | 1 | $60B |
|
||
| Technology Distribution | 1 | $58B |
|
||
| Homebuilding | 1 | $35B |
|
||
| Technology Manufacturing | 1 | $35B |
|
||
Price history
+325.5% since first listed3 events — show timeline
- 2026-05-22 Listed $280,000 Stellar MLS as Distributed by MLS Grid
- 2009-12-08 Listed $65,000 Stellar MLS as Distributed by MLS Grid
- 1998-06-11 Sold (Public Records) $65,800 Public Records
Property tax history
+6.4%/yrLatest (2025): $2,755 · +4.9% YoY. Source: county tax records.
Cash-flow waterfall
monthlySold comps — $/sqft
last 12 mo · ≤1 miLoading sold comps…