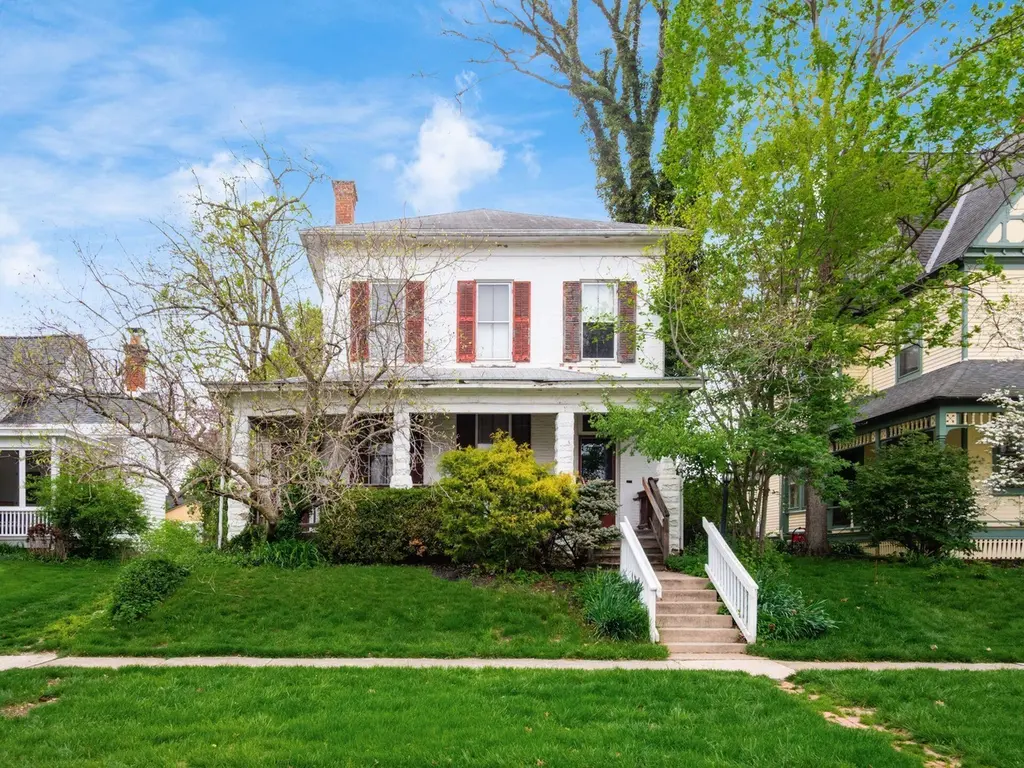
263 N Washington St · Delaware, OH
Flood risk 1/10 · Minimal
- FEMA flood zone
- X (unshaded)
- Chance of flooding over 30 yrs
- 0.0%
- Est. flood insurance / yr
- $507 – $1,088
Fire risk 1/10 · Minimal
- Est. fire insurance / yr
- $713 – $1,323
Heat risk 3/10 · Minor
- Hot days now (above 99°F)
- 7 days/yr
- Hot days in 30 yrs
- 18 days/yr
Wind risk 2/10 · Minimal
- Chance of severe wind over 30 yrs
- 0.0%
Air-quality risk 2/10 · Minimal
- Unhealthy air days now
- 1 days/yr
- Unhealthy air days in 30 yrs
- 2 days/yr
Risk factors via First Street. Map © Google.
Why this score? — see what drove the B grade
The composite is a weighted blend of 9 inputs, each scored 0–100. Each bar is that input's sub-score; the figure is the points it added to the 100-point composite (weight × sub-score).
- Cash flow +30.0/30.0
- 1% rule +10.0/10.0
- DSCR +10.0/10.0
- ARV discount +7.5/15.0
- Schools +4.7/10.0
- Livability +4.0/5.0
- Rent growth +2.9/5.0
- Condition / age +2.5/5.0
- Appreciation +0.0/10.0
$150,000
🖨 Deal sheet (PDF) 📄 Offer letter ✓ Due diligence
Listing remarks MLS
ONLINE AUCTION, the RESERVE (Minimum Bid) is $150,000. The auction ends at 7:00 PM, Tuesday, May 20th, 2026. BUYERS MUST SIGN ACKNOWLEDGEMENT OF TERMS to bid. Step back in time and appreciate all the unique features this 4 BR, 2 BA, 2,229 sq ft brick home built in 1860 has to offer. What a tremendous opportunity to own a piece of history, in a lovely setting, walking distance to all the downtown Delaware restaurants and shops. Situated on a quiet, tree lined street, in the Historic NW neighborhood of Delaware, this beauty is ready for its next owner to update and enjoy all the wonderful craftsmanship and charming architectural details. A sweeping curved staircase and 11 ft ceilings greets you upon entering. After, you will find hardwood floors, exquisitely crafted fireplaces, built-in shelving, and an ornate, carved floor-to-ceiling Victorian ''pier'' mirror. A light filled enclosed side porch would make an incredible room for plants, a library, or home office. A spacious front porch, large backyard, and detached garage complete this gem. Bring your ideas and schedule a showing today! Agents see agt to agt remarks
Key facts
- 11 ft ceilings
- Tree lined street
- Hardwood floors
Tags
Neighborhood map
What this means for you Summary
Snapshot
- This is a 4-bed/2.0-bath single-family listed at $150k.
Deal economics
- At list price, monthly cash flow is $679 ($8k/yr) — positive.
- The deal already cash-flows at list — no discount required.
- Meets the 1% rule at list price ($2k rent vs $150k).
- Recommended offer: $146k (3.0% below list) — sets the bar for market timing.
- Cap rate 11.7% vs local median 2.6% in Delaware — top-decile yield for the area; either an underpriced asset or a hidden risk that comps aren't pricing in. Stress-test before assuming the spread holds.
Location & tenants
- Location reads 80/100 on livability (#116 in OH, #1,717 nationally) — a professional / high-income tenant draw. Strengths: cost of living A+, housing A+, crime A; Watch: amenities C-, commute F.
- Delaware City (suburban): math 47% / reading 63% proficiency, ranked #355 of 656 in OH (top 54%) — acceptable for families but not a draw, mixed tenant base, ~2y average lease.
- Zoned schools: David Smith Elementary School (math 57% / reading 68%, grade B, #580 of 1,584 statewide, top 37%, 370 students, 25% FRL); John C Dempsey Middle School (math 50% / reading 61%, grade B-, #321 of 654 statewide, top 51%, 1,247 students, 30% FRL); Rutherford B Hayes High School (math 36% / reading 67%, grade D+, #371 of 781 statewide, top 48%, 1,700 students, 25% FRL) — zoned schools at 26% FRL track the district average.
- Market conditions: Rents rising (+1.4%/yr); 502 active listings in the ZIP; 4 comparable units currently listed for rent nearby; rentals at typical pace (median 25d on market — plan ~3-4 weeks tenant-placement turnaround); solid renter incomes; 2,233 units permitted in Delaware County in 2024 (304 in 5+ unit buildings).
Forward outlook
- Local home prices are declining (-3.0%/yr); year-one equity from $1k of loan paydown is wiped out by about $4k of value loss. Plan a longer hold.
- Delaware County population projected at +37% by 2050 — long-run rental-demand tailwind backs the buy-and-hold thesis.
- At projected returns (-3.0% appreciation + 1.4% rent growth), your $42k cash investment doubles in ~8 years — after that, you're playing with house money.
Negotiation context
- It's been on market 32 days — a 3% lower offer ($146k) is reasonable based on typical stale-listing flexibility.
- 5 sale attempts since 29y ago with the ask held roughly flat each time — persistent listings suggest the price (not the market) is what's stuck; bring a comps-based counter.
Risks & watch-outs
- Watch-outs: property tax is 3.5% of price; built in 1860 — expect roof / HVAC / electrical / plumbing capex.
Questions for the listing agent
- It's been on market 32 days. Have you received any prior offers? Is the seller open to a 3% concession, seller financing, or rate buy-down credit?
- Built in 1860 — when were the roof, HVAC, electrical panel, plumbing, and water heater last replaced?
- Property tax is high relative to price — has the assessment been appealed recently, and will the sale trigger a re-assessment?
- Is there a deadline driving the sale (1031 exchange, divorce, estate, relocation)? That informs how much negotiation room exists.
- Schools are A-rated — typically a magnet for longer-tenancy family renters. What's the average tenant stay here, and is there a school-zone premium baked into asking?
- What's the average days-on-market for RENTAL listings here right now (not sales)? A rising rental-DOM trend means longer vacancies and softer asking-rent achievability than the comps imply.
- What's the recent tenant-quality profile in this submarket — average credit score on applications, eviction rate, late-payment / NSF rate, and stable-employment percentage? A property-management company in the area should have these aggregated.
- How much new for-sale + rental construction is in the pipeline within 1–3 miles? Heavy new supply typically softens prices + rents 12–24 months out; constrained supply supports both.
Investment metrics
- 1% rule
- 1.66% ✓
- Cap rate
- 11.73%
- Cash-on-cash
- 19.41%
- DSCR
- 1.86
- GRM
- 5.0
CMA / ARV
- ARV (median comp)
- $482,522
- List price
- $150,000
- Delta
- -68.91%
- Verdict
- UNDERPRICED
- Comps
- 20 within 1.0 mi
Show comp detail 12 sales within ~0.75 mi
| Address | Dist | Beds/Ba | Sqft | Sold | Price | $/sf | Match |
|---|---|---|---|---|---|---|---|
| 263 N Washington St | 0.00mi | 4/2.0 | 2,229 (0%) | 0mo | $283,800 | $127 | 100 |
| 71 W Central Ave | 0.39mi | 4/2.0 | 2,213 (-1%) | 2mo | $379,900 | $172 | 79 |
| 373 N Union St | 0.35mi | 4/2.5 | 2,198 (-1%) | 1mo | $365,000 | $166 | 79 |
| 250 N Union St | 0.31mi | 4/2.0 | 2,028 (-9%) | 5mo | $380,000 | $187 | 66 |
| 377 N Washington St | 0.23mi | 3/2.0 (-1) | 2,379 (+7%) | 11mo | $330,000 | $139 | 64 |
| 394 N Washington St | 0.27mi | 3/2.5 (-1) | 2,036 (-9%) | 12mo | $480,000 | $236 | 56 |
| 325 W William St | 0.75mi | 4/2.0 | 2,262 (+2%) | 8mo | $247,500 | $109 | 56 |
| 52 Hayes Dr | 0.57mi | 4/3.0 | 2,312 (+4%) | 12mo | $360,000 | $156 | 53 |
| 103 Oak Hill Ave | 0.73mi | 4/2.5 | 1,997 (-10%) | 0mo | $400,000 | $200 | 46 |
| 281 W Heffner St | 0.44mi | 3/2.5 (-1) | 1,912 (-14%) | 8mo | $340,000 | $178 | 42 |
| 34 Prospect St | 0.66mi | 3/2.0 (-1) | 1,900 (-15%) | 2mo | $495,000 | $261 | 38 |
| 22 Elizabeth St | 0.56mi | 4/1.0 | 1,914 (-14%) | 12mo | $313,000 | $164 | 36 |
Match score weights: distance 35% · size 25% · config 20% · recency 20%. Top-matched comps best support the ARV.
Projected returns pro-forma
-3.0% appreciation · 1.42% rent growth · sell at horizon
- IRR
- 9.4%
- Equity multiple
- 1.36×
- Total profit
- $15,255
- Equity at exit
- $22,365
- IRR
- 17.1%
- Equity multiple
- 2.29×
- Total profit
- $54,265
- Equity at exit
- $12,969
Cash invested: $42,000 (down + closing). Projections, not guarantees.
Landlord ↔ Tenant lean methodology
- Overall (STATE)
- 73 Landlord-Friendly
- State Ohio
- 73 Landlord-Friendly · R+6
- County
- — inherits STATE
- City
- — inherits STATE
ZIP-level market 43015
- Rents YoY
- 1.4%
- Active inventory
- 502
- Price-to-rent
- 5.0×
Monthly cashflow live
- Estimated rent
- $2,497 medium interval (Pro) →
- Mortgage (P&I)
- −$787
- Tax from tax record
- −$444 /mo · $5,324/yr
- Insurance
- −$62
- HOA
- −$0
- Vacancy / Maint / Mgmt
- −$524
- Net cashflow
- $679
Break-even live
Sensitivity live
| Price | -10% $764 | -5% $722 | +0% $679 | +5% $637 | +10% $595 |
|---|---|---|---|---|---|
| Rent | -10% $482 | -5% $581 | +0% $679 | +5% $778 | +10% $877 |
| Rate | -1.0pp $755 | -0.5pp $718 | base $679 | +0.5pp $641 | +1.0pp $601 |
UW: 25.0% down · 7.5% · 30yr · 1.5% tax · 5.0% vac · 8.0% maint · 8.0% mgmt
Financing live
Cash to close
- Down payment
- $37,500
- Closing costs
- $4,500
- Reserves months
- —
- Total cash needed
- —
Loan-product check · same deal, 3 products live
Conventional
25% down · 7.5% · 30yr
- Down + closing
- —
- Monthly P&I
- —
- Monthly cashflow
- —
- DSCR
- —
- Eligible?
- —
Personal DTI + credit; lowest rate.
DSCR
20% down · 8.5% · 30yr
- Down + closing
- —
- Monthly P&I
- —
- Monthly cashflow
- —
- DSCR
- —
- Eligible?
- —
No personal income docs; deal must DSCR.
Hard money
10% down · 12.0% · 12mo
- Down + closing
- —
- Monthly P&I
- —
- Monthly cashflow
- —
- DSCR
- —
- Eligible?
- —
Short-term bridge; refi at stabilization.
Rent comps 4 comps
| Address | Beds | Baths | Sqft | Rent | $/sqft | DOM | Units | Dist |
|---|---|---|---|---|---|---|---|---|
| 102 N Washington St Delaware, OH | 4.0 | 2.5 | 2372 | $2,500 | $1.05 | 45d | 1 | 0.33mi |
| 102 N Washington St Delaware, OH | 4.0 | 2.5 | 2372 | $2,300 | $0.97 | 5d | 1 | 0.33mi |
| 440 Taylor Ave Delaware, OH | 4.0 | 3.5 | 2574 | $2,800 | $1.09 | 5d | 1 | 1.15mi |
| 38 Sunbeam Ct Delaware, OH | 3.0 | 2.5 | 2155 | $2,850 | $1.32 | 25d | 1 | 1.42mi |
Listing history 12 events
-
2026-04-20$150,000 Active 1132-char remark
Show marketing remark (1132 chars)
ONLINE AUCTION, the RESERVE (Minimum Bid) is $150,000. The auction ends at 7:00 PM, Tuesday, May 20th, 2026. BUYERS MUST SIGN ACKNOWLEDGEMENT OF TERMS to bid. Step back in time and appreciate all the unique features this 4 BR, 2 BA, 2,229 sq ft brick home built in 1860 has to offer. What a tremendous opportunity to own a piece of history, in a lovely setting, walking distance to all the downtown Delaware restaurants and shops. Situated on a quiet, tree lined street, in the Historic NW neighborhood of Delaware, this beauty is ready for its next owner to update and enjoy all the wonderful craftsmanship and charming architectural details. A sweeping curved staircase and 11 ft ceilings greets you upon entering. After, you will find hardwood floors, exquisitely crafted fireplaces, built-in shelving, and an ornate, carved floor-to-ceiling Victorian ''pier'' mirror. A light filled enclosed side porch would make an incredible room for plants, a library, or home office. A spacious front porch, large backyard, and detached garage complete this gem. Bring your ideas and schedule a showing today! Agents see agt to agt remarks
-
2004-04-19soldstatus $195,000
-
2004-04-16soldstatus $195,000 270-char remark
Show marketing remark (270 chars)
WOW!! Awesome period brick in NW Delaware with wood floors, working transom windows, extraordinary pier mirror, sunny plant room, built ins, floating staircase, crown molding, stained glass, ceramic tile, some new drywall, park like backyard, etc. .. .Move in condition!
-
2003-10-11$199,900 270-char remark
Show marketing remark (270 chars)
WOW!! Awesome period brick in NW Delaware with wood floors, working transom windows, extraordinary pier mirror, sunny plant room, built ins, floating staircase, crown molding, stained glass, ceramic tile, some new drywall, park like backyard, etc. .. .Move in condition!
-
2003-09-30historical
-
2003-03-27$209,950
-
1999-10-18soldstatus $172,000
-
1999-10-15soldstatus $172,000
-
1999-07-23historical
-
1999-03-31$179,900
-
1997-10-22historical
-
1997-07-12$182,500
ⓘ Source: listings_history table (triggers on properties + properties_extension) + one-shot
backfill from property_details.listing_events for pre-trigger history.
Tax reassessment forecast OH · Partial reset (capped growth)
- Current annual tax
- $5,324 · $444/mo
- Projected year-2 tax
- $5,324 · $444/mo
- Expected delta
- $0/yr ($0/mo · 0.0%)
ⓘ Screening estimate from a state-policy table — verify with the county assessor before closing.
Climate risk First Street
- Flood 1/10 Low FEMA zone X (unshaded) · 0% chance over 30 yrs
- Wildfire 1/10 Low
- Heat 3/10 Moderate 7 d/yr ≥99°F today · 18 d/yr by 30 yrs out
- Wind 2/10 Low 0% chance of damaging wind over 30 yrs
- Air quality 2/10 Low 1 unhealthy d/yr today · 2 by 30 yrs out
Nearby sold comps map
Loading sold comps map…
Walkable amenities ~0.75 mi
Loading nearby amenities…
Taxation est. · year 1
- Rental income
- $29,958
- − Mortgage interest
- −$8,402
- − Property taxes
- −$5,324
- − Insurance
- −$750
- − Repairs & maintenance
- −$2,397
- − Management
- −$2,397
- − Depreciation
- −$4,364
- Taxable income
- $6,325
- Est. tax owed @ 24.0%
- −$1,518
- After-tax cash flow
- $6,635/yr
For passive investors: Depreciation is non-cash, so a rental often shows a tax loss while cash-flowing — sheltering income. Rental losses are passive: they offset passive income freely, and up to $25,000/yr can offset ordinary (W-2) income if you actively participate and your MAGI is under $100k (phasing out to $0 by $150k); unused losses carry forward. On sale, claimed depreciation is recaptured at up to 25%, and gains may owe capital-gains tax (a 1031 exchange can defer both). Figures are a year-1 estimate at your 24.0% rate — not tax advice; consult a CPA.
Schools (NCES district)
- District
- Delaware City
- NCES district ID
- 3904387
- Math proficiency
- 47% ▼ -24.00%
- Reading proficiency
- 63% ▼ -7.00%
- Median HH income
- $55,434
- Composite
- 47.39/100
- National rank
- #2288
- State rank
- #355 of 656 in OH
Livability — Delaware
- Score
- 80/100
- State rank
- #116
- US rank
- #1717
Category grades
Schools grade is shown separately in the Schools card above.
Census & demographics
- Census place
- Delaware, OH
- County
- Delaware County · 203,207 people
- City population
- 61,401
- Metro
- Columbus, OH
- Population (ZIP)
- 61,401
- Household income
- $105,322
- Rent vs Own
- Severe rent burden
- 965.0
Population outlook (Delaware County) Hauer SSP2
- Today (2025)
- 230,854 people
- By 2030
- 249,294 · +8.0%
- By 2040
- 284,223 · +23.1%
- By 2050
- 315,314 · +36.6%
- By 2075
- 379,462 · +64.4%
- By 2100
- 403,158 · +74.6%
Race, ethnicity, and origin ACS 2023
- Neighborhood character
- Predominantly White (82%)
- Race & ethnicity
- White 82% Two or more races 7% Hispanic / Latino 5% Asian 5% Black 4%
- Common ancestry
- Italian 3% Slovak 3% Romanian 2%
- Foreign-born
- 5% · Canada, China, Vietnam
- Languages at home
- 93% English-only · Spanish 2% Other Asian/Pacific 1% Other Indo-European 1%
Political lean MEDSL · Delaware
- 2024 margin
- Lean R (+6.6) · D 46.2% · R 52.8%
- 2008→2024 swing
- +13.0pp toward D · 2008: -19.6pp · 2024: -6.6pp
- All cycles
- 2024: R+6.6 2020: R+6.8 2016: R+16.1 2012: R+23.7 2008: R+19.6
Not yet ingested
- Civics
- —
Market trends
- HPI YoY
- ▼ -398.47%
- Current HPI
- 233.0634
- Rent YoY
- ▲ 1.42%
- Metro
- Columbus, OH
- State GDP YoY
- ▲ 1.98%
- F500 in state
- 48
Industry mix (Fortune 500 HQ in OH)
| Industry | F500 HQs | Revenue |
|---|---|---|
| Insurance | 3 | $145B |
|
||
| Industrial Machinery | 3 | $49B |
|
||
| Financial Services | 3 | $24B |
|
||
| Consumer Goods | 2 | $93B |
|
||
| Aerospace / Defense | 2 | $47B |
|
||
| Utilities | 2 | $33B |
|
||
Price history
-17.8% since first listed12 events — show timeline
- 2026-04-20 Listed $150,000 CBRMLS
- 2004-04-19 Sold (Public Records) $195,000 Public Records
- 2004-04-16 Sold (MLS) $195,000 CBRMLS
- 2003-10-11 Listed $199,900 CBRMLS
- 2003-09-30 Listing Removed — CBRMLS
- 2003-03-27 Listed $209,950 CBRMLS
- 1999-10-18 Sold (Public Records) $172,000 Public Records
- 1999-10-15 Sold (MLS) $172,000 CBRMLS
- 1999-07-23 Listing Removed — CBRMLS
- 1999-03-31 Listed $179,900 CBRMLS
- 1997-10-22 Listing Removed — CBRMLS
- 1997-07-12 Listed $182,500 CBRMLS
Property tax history
+3.2%/yrLatest (2025): $5,324 · +5.4% YoY. Source: county tax records.
Cash-flow waterfall
monthlySold comps — $/sqft
last 12 mo · ≤1 miLoading sold comps…