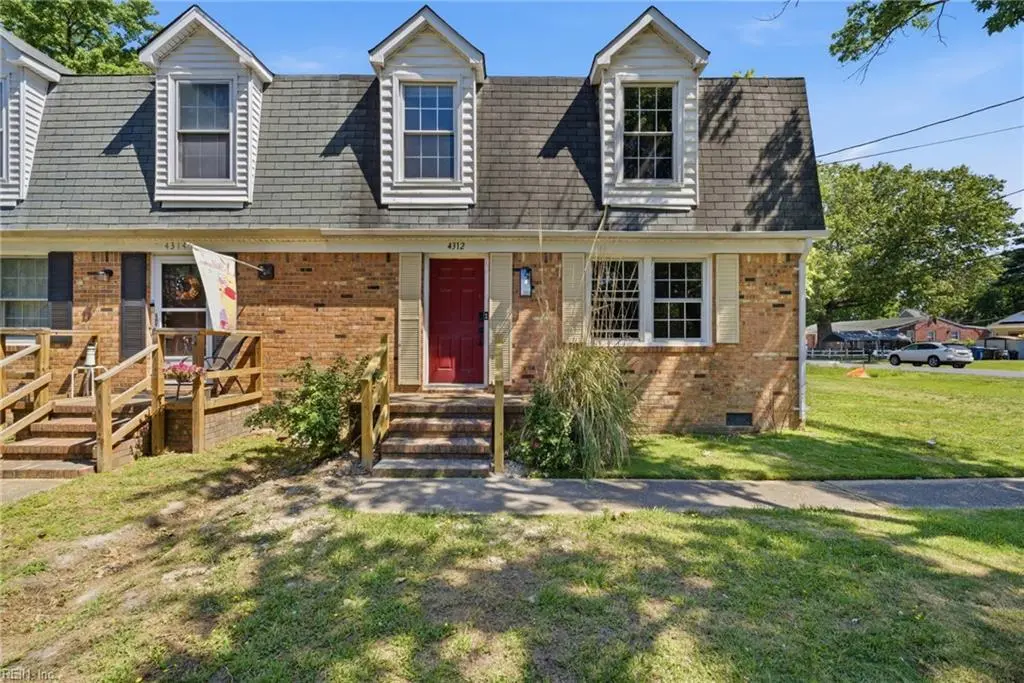
4312 Dutch St · Virginia Beach, VA
Flood risk 4/10 · Minor
- FEMA flood zone
- X (unshaded)
- Chance of flooding over 30 yrs
- 0.13%
- Est. flood insurance / yr
- $507 – $1,088
Fire risk 1/10 · Minimal
- Est. fire insurance / yr
- $666 – $1,236
Heat risk 9/10 · Severe
- Hot days now (above 105°F)
- 7 days/yr
- Hot days in 30 yrs
- 17 days/yr
Wind risk 8/10 · Major
- Chance of severe wind over 30 yrs
- 99.0%
Air-quality risk 3/10 · Minor
- Unhealthy air days now
- 2 days/yr
- Unhealthy air days in 30 yrs
- 4 days/yr
Risk factors via First Street. Map © Google.
Why this score? — see what drove the D- grade
The composite is a weighted blend of 9 inputs, each scored 0–100. Each bar is that input's sub-score; the figure is the points it added to the 100-point composite (weight × sub-score).
- Cash flow +10.1/30.0
- Schools +6.4/10.0
- ARV discount +6.3/15.0
- Livability +4.2/5.0
- Rent growth +3.7/5.0
- DSCR +2.9/10.0
- Condition / age +2.5/5.0
- 1% rule +2.3/10.0
- Appreciation +0.0/10.0
$285,000
🖨 Deal sheet 📄 Offer letter ✓ Due diligence
Listing remarks
Beautifully renovated end-unit townhome with fresh modern finishes throughout! This spacious home features updated flooring, fresh paint, stylish lighting, and a bright open-concept living and dining area great for everyday living or entertaining. The kitchen offers granite countertops, freshly painted cabinetry, and stainless steel appliances. Upstairs you’ll find generously sized bedrooms with updated flooring and ample natural light. Enjoy the privacy of the fenced backyard patio area plus the added bonus of an end-unit lot. Conveniently located near shopping, dining, military bases, and interstate access. Move-in ready and easy to show!
Key facts
- End-unit lot
- Updated flooring
- 2 parking spots
Tags
Property features AI
Finance
- HOA & community: No HOA (no association; fees listed as 0)
Exterior
- Parking: 2 parking spaces
- Utilities: City/County water; City/County sewer; Electric water heater; Electric power
- Home design: Attached townhouse; 2 stories; Crawl-space foundation; Simple ownership
- Construction: Asphalt shingle roof
- Exterior features: Brick siding; Approximately 0.098 acres
Interior
- Kitchen: Dishwasher; Electric range
- Bedrooms: No bedroom and full bathroom on first floor; Six total rooms
- Flooring: Carpet; Ceramic; Vinyl
- Bathrooms: 1 full bathroom; 1 half bathroom
- Heating & cooling: Heat pump with auxiliary; Central air conditioning
- Interior features: Carpet, ceramic, and vinyl flooring
Neighborhood map
What this means for you Summary
Snapshot
- This is a 3-bed/1.5-bath townhouse listed at $285k.
Deal economics
- At list price, monthly cash flow is $-165 ($-2k/yr) — negative.
- To cash-flow at today's rent, offer at most $256k (10.2% below list).
- To meet the 1% rule (rent ≥ 1% of price), the offer needs to be $209k (26.7% below list).
- Recommended offer: $209k (26.7% below list) — sets the bar for 1% rule.
- Cap rate 5.6% vs local median 3.5% in Virginia Beach — top-decile yield for the area; either an underpriced asset or a hidden risk that comps aren't pricing in. Stress-test before assuming the spread holds.
Location & tenants
- Location reads 83/100 on livability (#38 in VA, #880 nationally) — a professional / high-income tenant draw. Strengths: amenities A+, employment A+, housing A+; Watch: cost of living C-, commute F.
- Va Beach City Public School District (urban): math 69% / reading 78% proficiency, ranked #10 of 131 in VA (top 8%) — strong family-tenant draw, lease renewals of 3-5y typical.
- Zoned schools: Thalia Elementary (math 57% / reading 72%, grade B, #416 of 1,108 statewide, top 41%, 593 students, 70% FRL); Princess Anne High (math 76% / reading 89%, grade A, #36 of 319 statewide, top 12%, 1,717 students, 33% FRL) — zoned schools average 51% FRL vs 28% district-wide (23 pts higher); higher-poverty schools than district average — tighter screening recommended.
- Market conditions: Rents rising fast (+4.9%/yr); 226 active listings in the ZIP; 27 comparable units currently listed for rent nearby; rentals at typical pace (median 17d on market — plan ~3-4 weeks tenant-placement turnaround); solid renter incomes; 666 units permitted in Virginia Beach city in 2024 (347 in 5+ unit buildings).
- This rent runs 32% of the median local income ($79k/yr) — at the standard rent-burdened threshold; future hikes will face affordability resistance.
Forward outlook
- Local home prices are declining (-3.0%/yr); year-one equity from $2k of loan paydown is wiped out by about $9k of value loss. Plan a longer hold.
- Virginia Beach County population projected at +6% by 2050 — modest demand growth; plan on rents tracking national, not racing it.
Negotiation context
- Only 6 days on market — expect competitive offers; lowballing is unlikely to land.
- 2 sale attempts since 8y ago with the ask held roughly flat each time — persistent listings suggest the price (not the market) is what's stuck; bring a comps-based counter.
- Current owner paid $166k; list at $285k implies a 72% gain — meaningful room to come down on a strong offer.
Risks & watch-outs
- Climate carrying-cost: severe wind risk, 99% chance of damaging wind over 30y; extreme-heat days projected 7→17/yr by 2055 (HVAC capex compounding) — expect insurance premiums to compound above CPI over the hold.
Questions for the listing agent
- What do current leases actually rent for vs. the listed asking? Can we see a recent rent roll and the last 12 months of T-12 income?
- Is there a deadline driving the sale (1031 exchange, divorce, estate, relocation)? That informs how much negotiation room exists.
- Schools are A-rated — typically a magnet for longer-tenancy family renters. What's the average tenant stay here, and is there a school-zone premium baked into asking?
- The area grade is low — what's the realistic commute time and amenity access for the typical tenant pool here? Any planned neighborhood developments (good or bad) we should know about?
- What's the average days-on-market for RENTAL listings here right now (not sales)? A rising rental-DOM trend means longer vacancies and softer asking-rent achievability than the comps imply.
- What's the recent tenant-quality profile in this submarket — average credit score on applications, eviction rate, late-payment / NSF rate, and stable-employment percentage? A property-management company in the area should have these aggregated.
- How much new for-sale + rental construction is in the pipeline within 1–3 miles? Heavy new supply typically softens prices + rents 12–24 months out; constrained supply supports both.
Investment metrics
- 1% rule
- 0.73% ✗
- Cap rate
- 5.60%
- Cash-on-cash
- -2.48%
- DSCR
- 0.89
- GRM
- 11.4
CMA / ARV
- ARV (on-the-fly)
- $277,500
- Comps found
- 12
Show comp detail 12 sales within ~0.75 mi
| Address | Dist | Beds/Ba | Sqft | Sold | Price | $/sf | Match |
|---|---|---|---|---|---|---|---|
| 105 Seaside Ln | 0.39mi | 2/2.5 (-1) | 1,254 (+0%) | 1mo | $278,000 | $222 | 72 |
| 134 Castilian Dr | 0.40mi | 2/2.5 (-1) | 1,254 (+0%) | 1mo | $278,000 | $222 | 71 |
| 126 Castilian Dr | 0.45mi | 2/2.5 (-1) | 1,254 (+0%) | 1mo | $251,000 | $200 | 69 |
| 137 S Budding Ave | 0.28mi | 2/2.5 (-1) | 1,166 (-7%) | 0mo | $285,000 | $244 | 66 |
| 125 Castilian Dr | 0.46mi | 2/2.5 (-1) | 1,254 (+0%) | 3mo | $275,000 | $219 | 66 |
| 4509 Genoa Cir | 0.56mi | 2/2.5 (-1) | 1,254 (+0%) | 1mo | $275,000 | $219 | 63 |
| 4558 Genoa Cir | 0.57mi | 2/2.5 (-1) | 1,254 (+0%) | 2mo | $265,000 | $211 | 62 |
| 4548 Genoa Cir | 0.55mi | 2/2.5 (-1) | 1,254 (+0%) | 4mo | $259,000 | $207 | 62 |
| 4508 Indies Ct | 0.65mi | 2/2.5 (-1) | 1,254 (+0%) | 2mo | $275,000 | $219 | 59 |
| 3910 Inverness Rd | 0.75mi | 3/1.5 | 1,178 (-6%) | 1mo | $270,500 | $230 | 55 |
| 4545 Commerce St #1706 | 0.75mi | 2/2.0 (-1) | 1,191 (-5%) | 3mo | $447,000 | $375 | 47 |
| 128 Thalia Trace Dr | 0.73mi | 2/1.5 (-1) | 1,138 (-9%) | 2mo | $269,900 | $237 | 44 |
Match score weights: distance 35% · size 25% · config 20% · recency 20%. Top-matched comps best support the ARV.
Projected returns pro-forma
-3.0% appreciation · 4.92% rent growth · sell at horizon
- IRR
- -18.5%
- Equity multiple
- 0.34×
- Total profit
- $-52,618
- Equity at exit
- $42,494
- IRR
- -7.8%
- Equity multiple
- 0.47×
- Total profit
- $-42,032
- Equity at exit
- $24,642
Cash invested: $79,800 (down + closing). Projections, not guarantees.
Landlord ↔ Tenant lean methodology
- Overall (STATE)
- 55 Moderately Landlord-Leaning
- State Virginia
- 55 Moderately Landlord-Leaning · D+2
- County
- — inherits STATE
- City
- — inherits STATE
ZIP-level market 23452
- Rents YoY
- 4.9%
- Active inventory
- 226
- Price-to-rent
- 11.4×
Monthly cashflow live
- Estimated rent
- $2,088 high interval (Pro) →
- Mortgage (P&I)
- −$1,495
- Tax from tax record
- −$201 /mo · $2,411/yr
- Insurance
- −$119
- HOA
- −$0
- Vacancy / Maint / Mgmt
- −$439
- Net cashflow
- $-165
Break-even live
UW: 25.0% down · 7.5% · 30yr · 1.5% tax · 5.0% vac · 8.0% maint · 8.0% mgmt
Financing live
Cash to close
- Down payment
- $71,250
- Closing costs
- $8,550
- Reserves months
- —
- Total cash needed
- —
Loan-product check · same deal, 3 products live
Conventional
25% down · 7.5% · 30yr
- Down + closing
- —
- Monthly P&I
- —
- Monthly cashflow
- —
- DSCR
- —
- Eligible?
- —
Personal DTI + credit; lowest rate.
DSCR
20% down · 8.5% · 30yr
- Down + closing
- —
- Monthly P&I
- —
- Monthly cashflow
- —
- DSCR
- —
- Eligible?
- —
No personal income docs; deal must DSCR.
Hard money
10% down · 12.0% · 12mo
- Down + closing
- —
- Monthly P&I
- —
- Monthly cashflow
- —
- DSCR
- —
- Eligible?
- —
Short-term bridge; refi at stabilization.
Rent comps 27 comps
| Address | Beds | Baths | Sqft | Rent | $/sqft | DOM | Units | Dist |
|---|---|---|---|---|---|---|---|---|
| 104 S Palm Ave Virginia Beach, VA | 3.0 | 2.5 | 1700 | $2,900 | $1.71 | 23d | 1 | 0.17mi |
| 205 Silverbrook Ln Virginia Beach, VA | 2.0 | 2.0 | 995 | $1,750 | $1.76 | 17d | 1 | 0.20mi |
| 4251 Thalia Station Cir Virginia Beach, VA | 2.0 | 2.0 | 957 | $1,650 | $1.72 | 23d | 1 | 0.20mi |
| 205 Silverbrook Ln Unit 00 405204 Virginia Beach, VA | 2.0 | 2.0 | 995 | $1,800 | $1.81 | 19d | 1 | 0.25mi |
| 149 S Budding Ave Virginia Beach, VA | 1.0–3.0 | 1.0–2.0 | 1100 | $2,169 | $1.97 | 1d | 30 | 0.34mi |
| 4226 Beasley Ct Virginia Beach, VA | 2.0 | 1.5 | 884 | $1,595 | $1.80 | 23d | 1 | 0.35mi |
| 4226 Beasley Ct Virginia Beach, VA | 2.0 | 1.5 | 884 | $1,595 | $1.80 | 14d | 1 | 0.35mi |
| 3996 Roebling Ln Virginia Beach, VA | 3.0 | 2.5 | 1560 | $2,050 | $1.31 | 23d | 1 | 0.41mi |
| 3963 Wyckoff Dr Virginia Beach, VA | 3.0 | 2.5 | 1536 | $2,395 | $1.56 | 23d | 1 | 0.43mi |
| 111 Castilian Dr Virginia Beach, VA | 2.0 | 2.5 | 1254 | $1,900 | $1.52 | 7d | 1 | 0.46mi |
| 111 Castilian Dr Virginia Beach, VA | 2.0 | 2.5 | 1254 | $1,900 | $1.52 | 12d | 1 | 0.46mi |
| 100 Runaway Bay Dr Virginia Beach, VA | 1.0–2.0 | 1.0–2.0 | 807 | $1,985 | $2.46 | 1d | 44 | 0.54mi |
| 4556 Columbus St Virginia Beach, VA | 2.0 | 1.0–2.0 | 763 | $2,626 | $3.44 | 3d | 14 | 0.68mi |
| 307 Ferdinand Cir Virginia Beach, VA | 2.0 | 2.5 | 1254 | $1,775 | $1.42 | 23d | 1 | 0.73mi |
| 315 Ferdinand Cir Virginia Beach, VA | 2.0 | 2.5 | 1254 | $1,950 | $1.56 | 23d | 1 | 0.73mi |
| 3910 Inverness Rd Virginia Beach, VA | 3.0 | 1.5 | 1200 | $2,250 | $1.88 | 14d | 1 | 0.73mi |
| 224 Thalia Trace Dr Virginia Beach, VA | 3.0 | 1.5 | 1248 | $1,800 | $1.44 | 1d | 1 | 0.80mi |
| 278 Thalia Trace Dr Virginia Beach, VA | 3.0 | 1.5 | 1178 | $1,900 | $1.61 | 17d | 1 | 0.81mi |
| 3825 Annie Ln Virginia Beach, VA | 3.0 | 1.5 | 1460 | $2,100 | $1.44 | 12d | 1 | 0.92mi |
| 4409 Articles Ln Virginia Beach, VA | 3.0 | 1.5 | 1332 | $2,650 | $1.99 | 2d | 1 | 1.01mi |
| 4133 Shoreline Cir Virginia Beach, VA | 1.0–2.0 | 1.0–2.0 | 964 | $2,000 | $2.07 | 10d | 1 | 1.29mi |
| 4733 Adler Ave Virginia Beach, VA | 3.0 | 1.0 | 1150 | $1,995 | $1.73 | 21d | 1 | 1.29mi |
| 3600 Malibu Palms Dr Virginia Beach, VA | 1.0–3.0 | 1.0–1.5 | 1025 | $2,103 | $2.05 | 2d | 19 | 1.33mi |
| 4884 Travertine Ave Unit 00 208203O Virginia Beach, VA | 3.0 | 2.0 | 1254 | $2,100 | $1.67 | 23d | 1 | 1.38mi |
| 4884 Travertine Ave Unit 00 216304M Virginia Beach, VA | 3.0 | 2.0 | 1254 | $2,250 | $1.79 | 17d | 1 | 1.38mi |
| 4805 Carnelian Way Virginia Beach, VA | 2.0 | 2.5 | 1749 | $2,395 | $1.37 | 23d | 1 | 1.41mi |
| 226 Larimar Ave Unit 47C Virginia Beach, VA | 2.0 | 2.5 | 1480 | $2,395 | $1.62 | 7d | 1 | 1.48mi |
Listing history 19 events
-
2026-06-18status $285,000 Active 6 DOM
-
2026-06-18days on market $285,000 Active Under Contract 6 DOM
-
2026-06-17days on market $285,000 Active Under Contract 5 DOM
-
2026-06-16statusdays on market $285,000 Active Under Contract 4 DOM
-
2026-06-15days on market $285,000 Active 3 DOM
-
2026-06-13statusdays on market $285,000 Active 1 DOM
-
2026-06-08days on market $285,000 Active Under Contract 17 DOM
-
2026-06-07days on market $285,000 Active Under Contract 16 DOM
-
2026-06-03days on market $285,000 Active Under Contract 12 DOM
-
2026-06-02days on market $285,000 Active Under Contract 11 DOM
-
2026-06-01days on market $285,000 Active Under Contract 10 DOM
-
2026-05-31days on market $285,000 Active Under Contract 9 DOM
-
2026-05-24historical Active Under Contract
-
2026-05-22$285,000 Active
-
2019-03-11soldstatus $165,900
-
2019-02-11status Under Contract
-
2018-12-31$165,000 Active
-
2007-08-01soldstatus $155,000
-
1990-06-22soldstatus $10,000
ⓘ Source: listings_history table (triggers on properties + properties_extension) + one-shot
backfill from property_details.listing_events for pre-trigger history.
Tax reassessment forecast VA · Resets to sale price
- Current annual tax
- $2,411 · $201/mo
- Projected year-2 tax
- $2,411 · $201/mo
- Expected delta
- $0/yr ($0/mo · 0.0%)
ⓘ Screening estimate from a state-policy table — verify with the county assessor before closing.
Climate risk First Street
- Flood 4/10 Moderate FEMA zone X (unshaded) · 13% chance over 30 yrs
- Wildfire 1/10 Low
- Heat 9/10 Extreme 7 d/yr ≥105°F today · 17 d/yr by 30 yrs out
- Wind 8/10 Severe 99% chance of damaging wind over 30 yrs
- Air quality 3/10 Moderate 2 unhealthy d/yr today · 4 by 30 yrs out
Nearby sold comps map
Loading sold comps map…
Walkable amenities ~0.75 mi
Loading nearby amenities…
Taxation est. · year 1
- Rental income
- $25,058
- − Mortgage interest
- −$15,964
- − Property taxes
- −$2,411
- − Insurance
- −$1,425
- − Repairs & maintenance
- −$2,005
- − Management
- −$2,005
- − Depreciation
- −$8,291
- Taxable loss
- −$7,043
- Est. tax savings @ 24.0%
- +$1,690
- After-tax cash flow
- $-285/yr
For passive investors: Depreciation is non-cash, so a rental often shows a tax loss while cash-flowing — sheltering income. Rental losses are passive: they offset passive income freely, and up to $25,000/yr can offset ordinary (W-2) income if you actively participate and your MAGI is under $100k (phasing out to $0 by $150k); unused losses carry forward. On sale, claimed depreciation is recaptured at up to 25%, and gains may owe capital-gains tax (a 1031 exchange can defer both). Figures are a year-1 estimate at your 24.0% rate — not tax advice; consult a CPA.
Schools (NCES district)
- District
- Va Beach City Public School District
- NCES district ID
- 5103840
- Math proficiency
- 69% ▼ -19.00%
- Reading proficiency
- 78% ▼ -7.00%
- Median HH income
- $66,452
- Composite
- 63.81/100
- National rank
- #594
- State rank
- #10 of 131 in VA
Livability — Virginia Beach
- Score
- 83/100
- State rank
- #38
- US rank
- #880
Category grades
Schools grade is shown separately in the Schools card above.
Census & demographics
- Census place
- Virginia Beach, VA
- County
- Virginia Beach City · 448,227 people
- City population
- 448,227
- Metro
- Virginia Beach-Norfolk-Newport News, VA-NC
- Population (ZIP)
- 58,455
- Household income
- $79,085
- Rent vs Own
- Severe rent burden
- 2293.0
Population outlook (Virginia Beach County) Hauer SSP2
- Today (2025)
- 480,401 people
- By 2030
- 491,221 · +2.3%
- By 2040
- 504,882 · +5.1%
- By 2050
- 508,847 · +5.9%
- By 2075
- 504,831 · +5.1%
- By 2100
- 465,867 · -3.0%
Race, ethnicity, and origin ACS 2023
- Neighborhood character
- Diverse neighborhood (Simpson 0.59)
- Race & ethnicity
- White 60% Black 20% Two or more races 10% Hispanic / Latino 9% Asian 5%
- Hispanic origin (detail)
- Mexican 2% Puerto Rican 3%
- Common ancestry
- Romanian 2% Italian 2% Lithuanian 2%
- Foreign-born
- 8% · Canada, Jamaica
- Languages at home
- 88% English-only · Spanish 6% Tagalog/Filipino 2% Other Asian/Pacific 1%
Political lean MEDSL · Virginia Beach
- 2024 margin
- Toss-up / Even · D 50.7% · R 48.0% · Other 1.3%
- 2008→2024 swing
- +3.4pp toward D · 2008: -0.7pp · 2024: 2.6pp
- All cycles
- 2024: D+2.6 2020: D+5.4 2016: R+4.5 2012: R+2.5 2008: R+0.7
Not yet ingested
- Civics
- —
Market trends
- HPI YoY
- ▼ -363.80%
- Current HPI
- 328.5435
- Rent YoY
- ▲ 4.92%
- Metro
- Virginia Beach-Norfolk-Newport News, VA-NC
- State GDP YoY
- ▲ 2.40%
- F500 in state
- 50
Industry mix (Fortune 500 HQ in VA)
| Industry | F500 HQs | Revenue |
|---|---|---|
| Aerospace / Defense | 4 | $236B |
|
||
| Technology / Defense | 3 | $32B |
|
||
| Financial Services | 2 | $176B |
|
||
| Utilities | 2 | $27B |
|
||
| Insurance | 2 | $25B |
|
||
| Technology | 2 | $15B |
|
||
Price history
+2750.0% since first listed7 events — show timeline
- 2026-05-24 Contingent — REINMLS
- 2026-05-22 Listed $285,000 REINMLS
- 2019-03-11 Sold (Public Records) $165,900 Public Records
- 2019-02-11 Pending — REINMLS
- 2018-12-31 Listed $165,000 REINMLS
- 2007-08-01 Sold (Public Records) $155,000 Public Records
- 1990-06-22 Sold (Public Records) $10,000 Public Records
Property tax history
+4.2%/yrLatest (2025): $2,411 · +19.3% YoY. Source: county tax records.
Cash-flow waterfall
monthlySold comps — $/sqft
last 12 mo · ≤1 miLoading sold comps…