814 Bradshire St · Agua Dulce, TX
Flood risk 1/10 · Minimal
- FEMA flood zone
- X
- Chance of flooding over 30 yrs
- 0.0%
- Est. flood insurance / yr
- $507 – $1,088
Fire risk 3/10 · Minor
- Est. fire insurance / yr
- $1,222 – $2,270
Heat risk 6/10 · Moderate
- Hot days now (above 100°F)
- 7 days/yr
- Hot days in 30 yrs
- 25 days/yr
Wind risk 1/10 · Minimal
- Chance of severe wind over 30 yrs
- —
Air-quality risk 3/10 · Minor
- Unhealthy air days now
- 2 days/yr
- Unhealthy air days in 30 yrs
- 2 days/yr
Risk factors via First Street. Map © Google.
Why this score? — see what drove the B- grade
The composite is a weighted blend of 9 inputs, each scored 0–100. Each bar is that input's sub-score; the figure is the points it added to the 100-point composite (weight × sub-score).
- Cash flow +30.0/30.0
- DSCR +10.0/10.0
- 1% rule +8.7/10.0
- ARV discount +7.5/15.0
- Condition / age +4.0/5.0
- Rent growth +3.2/5.0
- Livability +2.9/5.0
- Schools +1.5/10.0
- Appreciation +0.0/10.0
$129,950
🖨 Deal sheet 📄 Offer letter ✓ Due diligence
Listing remarks MLS
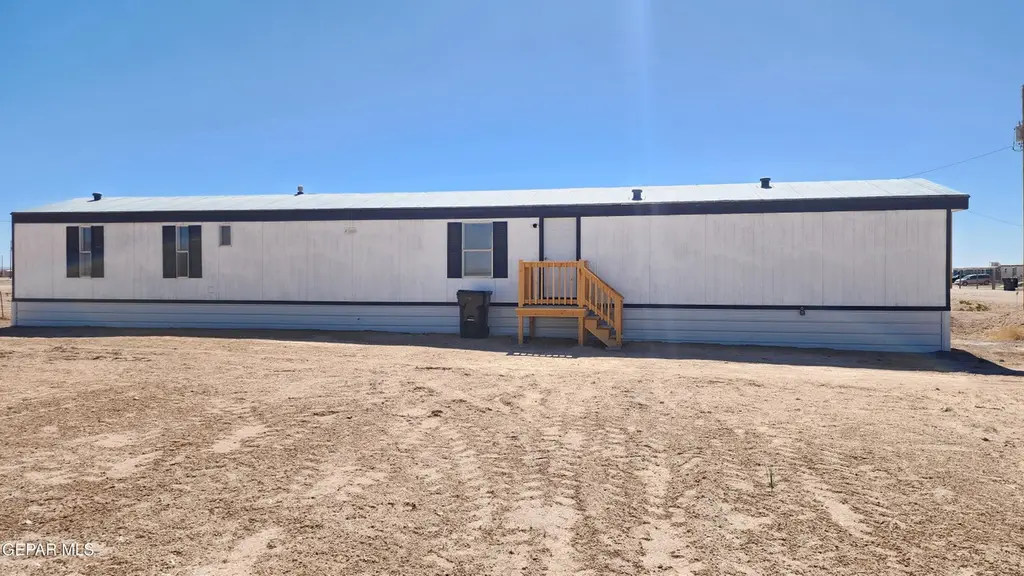
Beautifully remodeled manufactured home that is truly a must-see! Situated on approximately ¼ acre in a quiet area, this property offers plenty of space and flexibility for your lifestyle. The large lot provides room for RV parking, a shed, or other possibilities to fit your needs. Enjoy the amazing nighttime views and peaceful surroundings while still having the comfort of a nicely updated home. With this incredible price, homeownership could be closer than you think. Stop renting and start owning today! Schedule your private showing and come see everything this property has to offer. Has Fridge, stove and Dishwasher
Key facts
- Rv parking
- Large lot
- Nighttime views
Tags
Neighborhood map
What this means for you Summary
Snapshot
- This is a 3-bed/2.0-bath manufactured listed at $130k. Condition is rated good.
Deal economics
- At list price, monthly cash flow is $505 ($6k/yr) — positive.
- The deal already cash-flows at list — no discount required.
- Meets the 1% rule at list price ($2k rent vs $130k).
- Recommended offer: $118k (9.0% below list) — sets the bar for market timing.
Location & tenants
- Location reads 58/100 on livability (#1,202 in TX) — a working-class tenant base; expect higher turnover. Strengths: cost of living A+, housing A+, crime B; Watch: schools F, amenities F, commute F.
- Clint ISD (suburban): math 14% / reading 22% proficiency, ranked #792 of 826 in TX (top 96%) — low school quality limits family demand, transient renter base, plan for 1-2y turnover.
- Market conditions: Rents rising (+2.9%/yr); 2088 active listings in the ZIP; solid renter incomes; 2,196 units permitted in El Paso County in 2024 (143 in 5+ unit buildings).
Forward outlook
- Local home prices are declining (-3.0%/yr); year-one equity from $898 of loan paydown is wiped out by about $4k of value loss. Plan a longer hold.
- El Paso County population projected at +10% by 2050 — modest demand growth; plan on rents tracking national, not racing it.
- At projected returns (-3.0% appreciation + 2.9% rent growth), your $36k cash investment doubles in ~8 years — after that, you're playing with house money.
Negotiation context
- It's been on market 104 days — a 9% lower offer ($118k) is reasonable based on typical stale-listing flexibility.
Risks & watch-outs
- Climate carrying-cost: extreme-heat days projected 7→25/yr by 2055 (HVAC capex compounding) — expect insurance premiums to compound above CPI over the hold.
Questions for the listing agent
- It's been on market 104 days. Have you received any prior offers? Is the seller open to a 9% concession, seller financing, or rate buy-down credit?
- Why hasn't it sold? Are there any deal-killer items the seller is aware of (foundation, flood, title, zoning, code violations)?
- Is there a deadline driving the sale (1031 exchange, divorce, estate, relocation)? That informs how much negotiation room exists.
- Schools are F-rated, which usually means shorter tenancies and higher turnover. Who's the typical renter profile here, and what's been the actual vacancy rate?
- What's the average days-on-market for RENTAL listings here right now (not sales)? A rising rental-DOM trend means longer vacancies and softer asking-rent achievability than the comps imply.
- What's the recent tenant-quality profile in this submarket — average credit score on applications, eviction rate, late-payment / NSF rate, and stable-employment percentage? A property-management company in the area should have these aggregated.
- How much new for-sale + rental construction is in the pipeline within 1–3 miles? Heavy new supply typically softens prices + rents 12–24 months out; constrained supply supports both.
Investment metrics
- 1% rule
- 1.37% ✓
- Cap rate
- 10.96%
- Cash-on-cash
- 16.65%
- DSCR
- 1.74
- GRM
- 6.1
CMA / ARV
No comps found within radius.
Projected returns pro-forma
-3.0% appreciation · 2.93% rent growth · sell at horizon
- IRR
- 7.7%
- Equity multiple
- 1.30×
- Total profit
- $11,006
- Equity at exit
- $19,376
- IRR
- 17.0%
- Equity multiple
- 2.39×
- Total profit
- $50,593
- Equity at exit
- $11,236
Cash invested: $36,386 (down + closing). Projections, not guarantees.
Landlord ↔ Tenant lean methodology
- Overall (STATE)
- 87 Strongly Landlord-Friendly
- State Texas
- 87 Strongly Landlord-Friendly · R+5
- County
- — inherits STATE
- City
- — inherits STATE
ZIP-level market 79928
- Home prices YoY
- -16.9%
- Rents YoY
- 2.9%
- Active inventory
- 2088
- Price-to-rent
- 6.1×
Monthly cashflow live
- Estimated rent
- $1,776 medium interval (Pro) →
- Mortgage (P&I)
- −$681
- Tax est. 1.5%
- −$162 /mo · $1,949/yr
- Insurance
- −$54
- HOA
- −$0
- Vacancy / Maint / Mgmt
- −$373
- Net cashflow
- $505
Break-even live
UW: 25.0% down · 7.5% · 30yr · 1.5% tax · 5.0% vac · 8.0% maint · 8.0% mgmt
Financing live
Cash to close
- Down payment
- $32,488
- Closing costs
- $3,898
- Reserves months
- —
- Total cash needed
- —
Loan-product check · same deal, 3 products live
Conventional
25% down · 7.5% · 30yr
- Down + closing
- —
- Monthly P&I
- —
- Monthly cashflow
- —
- DSCR
- —
- Eligible?
- —
Personal DTI + credit; lowest rate.
DSCR
20% down · 8.5% · 30yr
- Down + closing
- —
- Monthly P&I
- —
- Monthly cashflow
- —
- DSCR
- —
- Eligible?
- —
No personal income docs; deal must DSCR.
Hard money
10% down · 12.0% · 12mo
- Down + closing
- —
- Monthly P&I
- —
- Monthly cashflow
- —
- DSCR
- —
- Eligible?
- —
Short-term bridge; refi at stabilization.
Listing history 15 events
-
2026-06-18days on market $129,950 Active 104 DOM
-
2026-06-17days on market $129,950 Active 103 DOM
-
2026-06-16days on market $129,950 Active 102 DOM
-
2026-06-15days on market $129,950 Active 101 DOM
-
2026-06-13days on market $129,950 Active 99 DOM
-
2026-06-10days on market $129,950 Active 96 DOM
-
2026-06-09days on market $129,950 Active 95 DOM
-
2026-06-08days on market $129,950 Active 94 DOM
-
2026-06-07days on market $129,950 Active 93 DOM
-
2026-06-03days on market $129,950 Active 89 DOM
-
2026-06-03days on market $129,950 Active 88 DOM
-
2026-06-01days on market $129,950 Active 87 DOM
-
2026-05-31days on market $129,950 Active 86 DOM
-
2026-04-25price $129,950 633-char remark
Show marketing remark (633 chars)
Beautifully remodeled manufactured home that is truly a must-see! Situated on approximately ¼ acre in a quiet area, this property offers plenty of space and flexibility for your lifestyle. The large lot provides room for RV parking, a shed, or other possibilities to fit your needs. Enjoy the amazing nighttime views and peaceful surroundings while still having the comfort of a nicely updated home. With this incredible price, homeownership could be closer than you think. Stop renting and start owning today! Schedule your private showing and come see everything this property has to offer. Has Fridge, stove and Dishwasher
-
2026-03-06$135,000 Active 633-char remark
Show marketing remark (633 chars)
Beautifully remodeled manufactured home that is truly a must-see! Situated on approximately ¼ acre in a quiet area, this property offers plenty of space and flexibility for your lifestyle. The large lot provides room for RV parking, a shed, or other possibilities to fit your needs. Enjoy the amazing nighttime views and peaceful surroundings while still having the comfort of a nicely updated home. With this incredible price, homeownership could be closer than you think. Stop renting and start owning today! Schedule your private showing and come see everything this property has to offer. Has Fridge, stove and Dishwasher
ⓘ Source: listings_history table (triggers on properties + properties_extension) + one-shot
backfill from property_details.listing_events for pre-trigger history.
Climate risk First Street
- Flood 1/10 Low FEMA zone X · 0% chance over 30 yrs
- Wildfire 3/10 Moderate
- Heat 6/10 Major 7 d/yr ≥100°F today · 25 d/yr by 30 yrs out
- Wind 1/10 Low
- Air quality 3/10 Moderate 2 unhealthy d/yr today · 2 by 30 yrs out
Nearby sold comps map
Loading sold comps map…
Walkable amenities ~0.75 mi
Loading nearby amenities…
Taxation est. · year 1
- Rental income
- $21,312
- − Mortgage interest
- −$7,279
- − Property taxes
- −$1,949
- − Insurance
- −$650
- − Repairs & maintenance
- −$1,705
- − Management
- −$1,705
- − Depreciation
- −$3,780
- Taxable income
- $4,243
- Est. tax owed @ 24.0%
- −$1,018
- After-tax cash flow
- $5,041/yr
For passive investors: Depreciation is non-cash, so a rental often shows a tax loss while cash-flowing — sheltering income. Rental losses are passive: they offset passive income freely, and up to $25,000/yr can offset ordinary (W-2) income if you actively participate and your MAGI is under $100k (phasing out to $0 by $150k); unused losses carry forward. On sale, claimed depreciation is recaptured at up to 25%, and gains may owe capital-gains tax (a 1031 exchange can defer both). Figures are a year-1 estimate at your 24.0% rate — not tax advice; consult a CPA.
Condition & rehab AI · 12 photos
This beautifully remodeled manufactured home is move-in ready with modern updates and a spacious lot, making it an excellent investment opportunity.
Value-add opportunities
- Both Painting exterior — Enhances curb appeal and value
- Both Landscaping — Improves curb appeal and rental value
- Both Add a small shed — Provides storage and enhances property value
Renovation cost estimate screening
Value-add ROI direction
- Both Painting exterior — Enhances curb appeal and value ↑
- Both Landscaping — Improves curb appeal and rental value ↑
- Both Add a small shed — Provides storage and enhances property value ↑
ⓘ Cost ranges are severity-bucket heuristics (US national rule-of-thumb). Get contractor quotes + a written scope before underwriting a rehab budget.
Schools (NCES district)
- District
- Clint ISD
- NCES district ID
- 4814430
- Math proficiency
- 14% ▼ -32.00%
- Reading proficiency
- 22% ▼ -15.00%
- Median HH income
- $37,490
- Composite
- 15.03/100
- National rank
- #9356
- State rank
- #792 of 826 in TX
Livability — Agua Dulce
- Score
- 58/100
- State rank
- #1202
- US rank
- #21027
Category grades
Schools grade is shown separately in the Schools card above.
Census & demographics
- County
- El Paso County · 761,266 people
- Metro
- El Paso, TX
- Population (ZIP)
- 86,599
- Household income
- $76,643
- Rent vs Own
- Severe rent burden
- 838.0
Population outlook (El Paso County) Hauer SSP2
- Today (2025)
- 897,899 people
- By 2030
- 922,694 · +2.8%
- By 2040
- 960,492 · +7.0%
- By 2050
- 982,919 · +9.5%
- By 2075
- 997,266 · +11.1%
- By 2100
- 900,630 · +0.3%
Race, ethnicity, and origin ACS 2023
- Neighborhood character
- Predominantly Hispanic (89%)
- Race & ethnicity
- Hispanic / Latino 89% Two or more races 39% White 7% Black 2% Native American 2%
- Hispanic origin (detail)
- Mexican 84%
- Foreign-born
- 23% · Canada
- Languages at home
- 25% English-only · Spanish 74% Other Asian/Pacific 1%
Political lean MEDSL · El Paso
- 2024 margin
- D (+15.1) · D 57.0% · R 41.8% · Other 1.2%
- 2008→2024 swing
- -17.4pp toward R · 2008: 32.5pp · 2024: 15.1pp
- All cycles
- 2024: D+15.1 2020: D+35.1 2016: D+43.2 2012: D+32.6 2008: D+32.5
Not yet ingested
- Civics
- —
Market trends
- HPI YoY
- ▼ -40.72%
- Current HPI
- 200.6454
- Rent YoY
- ▲ 2.93%
- Metro
- El Paso, TX
- State GDP YoY
- ▲ 3.95%
- F500 in state
- 110
Industry mix (Fortune 500 HQ in TX)
| Industry | F500 HQs | Revenue |
|---|---|---|
| Energy | 16 | $1,198B |
|
||
| Technology | 5 | $198B |
|
||
| Engineering / Construction | 4 | $72B |
|
||
| Energy Services | 3 | $60B |
|
||
| Utilities | 3 | $41B |
|
||
| Healthcare | 2 | $330B |
|
||
Price history
-3.7% since first listed2 events — show timeline
- 2026-04-25 Price Changed $129,950 GEPARMLS
- 2026-03-06 Listed $135,000 GEPARMLS
Cash-flow waterfall
monthlySold comps — $/sqft
last 12 mo · ≤1 miLoading sold comps…