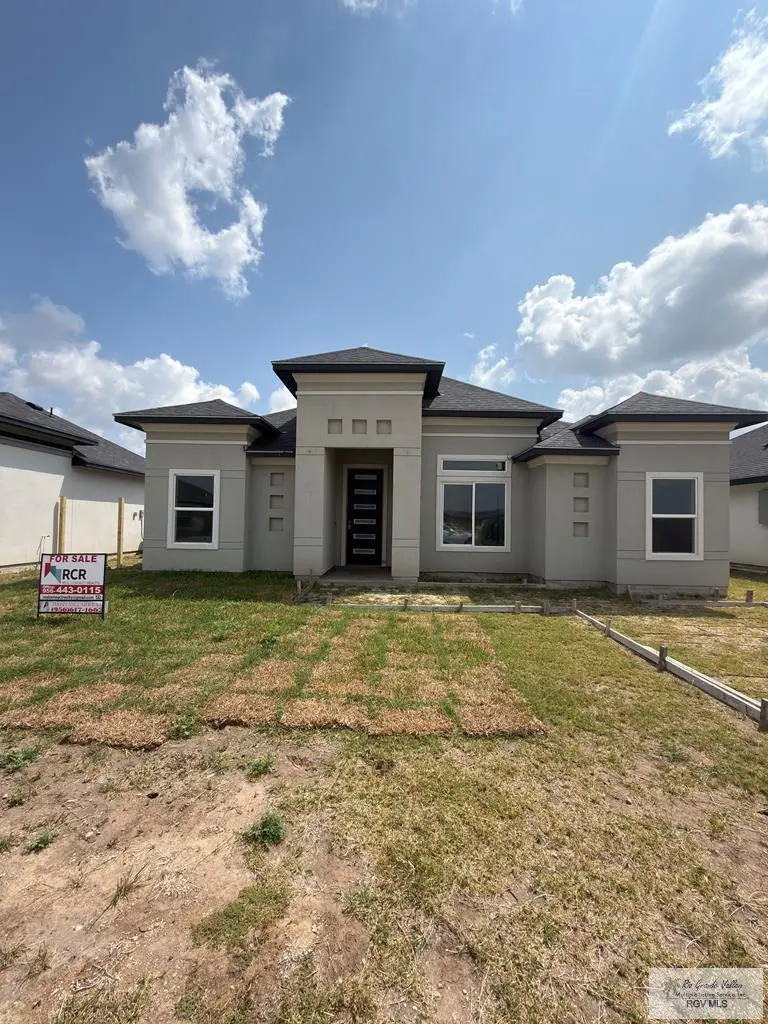
1353 Daytona Beach Ct · Brownsville, TX
Flood risk No data
- FEMA flood zone
- —
- Chance of flooding over 30 yrs
- —
- Est. flood insurance / yr
- —
Fire risk No data
- Est. fire insurance / yr
- —
Heat risk No data
- Hot days now (above threshold)
- —
- Hot days in 30 yrs
- —
Wind risk No data
- Chance of severe wind over 30 yrs
- —
Air-quality risk No data
- Unhealthy air days now
- —
- Unhealthy air days in 30 yrs
- —
Risk factors via First Street. Map © Google.
Why this score? — see what drove the D+ grade
The composite is a weighted blend of 9 inputs, each scored 0–100. Each bar is that input's sub-score; the figure is the points it added to the 100-point composite (weight × sub-score).
- Cash flow +12.4/30.0
- ARV discount +11.0/15.0
- Rent growth +4.5/5.0
- Livability +4.0/5.0
- Condition / age +4.0/5.0
- 1% rule +3.9/10.0
- DSCR +3.7/10.0
- Schools +2.2/10.0
- Appreciation +0.0/10.0
$236,900
🖨 Deal sheet (PDF) 📄 Offer letter ✓ Due diligence
Listing remarks
This beautiful four-bedroom new home features high ceilings and an open floor plan with split bedrooms for added privacy. It includes an indoor laundry area, granite countertops, and plenty of kitchen cabinets. The bathrooms are equipped with glass shower doors, and the closets offer built-in organizers. This stunning home is ready for you to move in!
Key facts
- 5,000 sq ft lot
- Built 2024
Neighborhood map
What this means for you Summary
Snapshot
- This is a 4-bed/2.0-bath single-family listed at $237k. Condition is rated good.
Deal economics
- At list price, monthly cash flow is $-39 ($-467/yr) — negative.
- To cash-flow at today's rent, offer at most $230k (2.9% below list).
- To meet the 1% rule (rent ≥ 1% of price), the offer needs to be $211k (10.7% below list).
- Recommended offer: $211k (10.7% below list) — sets the bar for 1% rule.
- Cap rate 6.1% vs local median 5.0% in Brownsville — meaningfully above typical; check what's discounted (condition, days-on-market, listing class) to confirm the premium yield is real.
Location & tenants
- Location reads 79/100 on livability (#62 in TX, #2,311 nationally) — a middle-class / working-renter tenant base. Strengths: commute A+, cost of living A+, housing A+; Watch: amenities D, crime D-, employment F.
- Brownsville ISD (urban): math 20% / reading 34% proficiency, ranked #710 of 826 in TX (top 86%) — low school quality limits family demand, transient renter base, plan for 1-2y turnover; 83% free/reduced lunch — lower-income household profile, screen leases tightly.
- Zoned schools: Brite El (math 27% / reading 27%, grade F, #2,791 of 4,322 statewide, top 68%, 545 students, 95% FRL); Lucio Middle (math 12% / reading 28%, grade F, #1,428 of 1,662 statewide, top 87%, 698 students, 96% FRL); Lopez Early College H S (math 20% / reading 39%, grade F, #1,112 of 1,632 statewide, top 70%, 1,831 students, 95% FRL).
- Market conditions: Rents rising fast (+8.2%/yr); 366 active listings in the ZIP; 5 comparable units currently listed for rent nearby; rentals lingering (median 46d on market — plan ~5-8 weeks vacancy on turnover, expect pricing pressure); 60% of comp listings sitting > 30 days — soft ceiling on asking rent; lower-income renter base — watch delinquency; 2,326 units permitted in Cameron County in 2024 (503 in 5+ unit buildings).
- At $2,115/mo this rent would consume 57% of the median local household income ($45k/yr) (locally 2682% of renters already pay >50% of income on rent) — very limited rent-growth headroom before tenants either downsize or default.
Forward outlook
- Local home prices are declining (-3.0%/yr); year-one equity from $2k of loan paydown is wiped out by about $7k of value loss. Plan a longer hold.
- Cameron County population projected at +3% by 2050 — modest demand growth; plan on rents tracking national, not racing it.
Negotiation context
- Only 0 days on market — expect competitive offers; lowballing is unlikely to land.
Questions for the listing agent
- What do current leases actually rent for vs. the listed asking? Can we see a recent rent roll and the last 12 months of T-12 income?
- Is there a deadline driving the sale (1031 exchange, divorce, estate, relocation)? That informs how much negotiation room exists.
- Crime grade is D in this area — have there been break-ins, vandalism, or insurance claims at this property in the last 3 years? What carrier currently insures it and at what premium?
- The area grade is low — what's the realistic commute time and amenity access for the typical tenant pool here? Any planned neighborhood developments (good or bad) we should know about?
- What's the average days-on-market for RENTAL listings here right now (not sales)? A rising rental-DOM trend means longer vacancies and softer asking-rent achievability than the comps imply.
- What's the recent tenant-quality profile in this submarket — average credit score on applications, eviction rate, late-payment / NSF rate, and stable-employment percentage? A property-management company in the area should have these aggregated.
- How much new for-sale + rental construction is in the pipeline within 1–3 miles? Heavy new supply typically softens prices + rents 12–24 months out; constrained supply supports both.
Investment metrics
- 1% rule
- 0.89% ✗
- Cap rate
- 6.10%
- Cash-on-cash
- -0.70%
- DSCR
- 0.97
- GRM
- 9.3
CMA / ARV
- ARV (on-the-fly)
- $256,827
- Comps found
- 2
Show comp detail 2 sales within ~0.75 mi
| Address | Dist | Beds/Ba | Sqft | Sold | Price | $/sf | Match |
|---|---|---|---|---|---|---|---|
| 660 Tamarindo Ln | 0.70mi | 4/2.0 | 1,425 (-2%) | 10mo | $250,000 | $175 | 56 |
| 730 Tamarindo St | 0.70mi | 3/2.0 (-1) | 1,400 (-4%) | 8mo | $248,000 | $177 | 50 |
Match score weights: distance 35% · size 25% · config 20% · recency 20%. Top-matched comps best support the ARV.
Projected returns pro-forma
-3.0% appreciation · 8.0% rent growth · sell at horizon
- IRR
- -11.7%
- Equity multiple
- 0.55×
- Total profit
- $-29,616
- Equity at exit
- $35,323
- IRR
- 3.7%
- Equity multiple
- 1.33×
- Total profit
- $22,192
- Equity at exit
- $20,483
Cash invested: $66,332 (down + closing). Projections, not guarantees.
Landlord ↔ Tenant lean methodology
- Overall (STATE)
- 87 Strongly Landlord-Friendly
- State Texas
- 87 Strongly Landlord-Friendly · R+5
- County
- — inherits STATE
- City
- — inherits STATE
ZIP-level market 78521
- Home prices YoY
- -26.0%
- Rents YoY
- 8.2%
- Active inventory
- 366
- Price-to-rent
- 9.3×
Monthly cashflow live
- Estimated rent
- $2,115 high interval (Pro) →
- Mortgage (P&I)
- −$1,242
- Tax from tax record
- −$369 /mo · $4,422/yr
- Insurance
- −$99
- HOA
- −$0
- Vacancy / Maint / Mgmt
- −$444
- Net cashflow
- $-39
Break-even live
Sensitivity live
| Price | -10% $95 | -5% $28 | +0% $-39 | +5% $-106 | +10% $-173 |
|---|---|---|---|---|---|
| Rent | -10% $-206 | -5% $-122 | +0% $-39 | +5% $45 | +10% $128 |
| Rate | -1.0pp $80 | -0.5pp $21 | base $-39 | +0.5pp $-100 | +1.0pp $-163 |
UW: 25.0% down · 7.5% · 30yr · 1.5% tax · 5.0% vac · 8.0% maint · 8.0% mgmt
Financing live
Cash to close
- Down payment
- $59,225
- Closing costs
- $7,107
- Reserves months
- —
- Total cash needed
- —
Loan-product check · same deal, 3 products live
Conventional
25% down · 7.5% · 30yr
- Down + closing
- —
- Monthly P&I
- —
- Monthly cashflow
- —
- DSCR
- —
- Eligible?
- —
Personal DTI + credit; lowest rate.
DSCR
20% down · 8.5% · 30yr
- Down + closing
- —
- Monthly P&I
- —
- Monthly cashflow
- —
- DSCR
- —
- Eligible?
- —
No personal income docs; deal must DSCR.
Hard money
10% down · 12.0% · 12mo
- Down + closing
- —
- Monthly P&I
- —
- Monthly cashflow
- —
- DSCR
- —
- Eligible?
- —
Short-term bridge; refi at stabilization.
Rent comps 5 comps
| Address | Beds | Baths | Sqft | Rent | $/sqft | DOM | Units | Dist |
|---|---|---|---|---|---|---|---|---|
| 1340 Daytona Beach Ct Unit B Brownsville, TX | 3.0 | 2.0 | 1480 | $2,200 | $1.49 | 45d | 1 | 0.05mi |
| 365 Mango Ln Brownsville, TX | 3.0 | 2.0 | 1012 | $1,400 | $1.38 | 15d | 1 | 0.99mi |
| 250 Kiwi Brownsville, TX | 3.0 | 2.0 | 1033 | $1,400 | $1.36 | 23d | 1 | 1.20mi |
| 35 Little Grove St Brownsville, TX | 3.0 | 3.0 | 1800 | $2,500 | $1.39 | 45d | 1 | 1.26mi |
| 7771 Villa Pancho Dr Unit 1A Brownsville, TX | 3.0 | 2.0 | 1400 | $1,500 | $1.07 | 45d | 1 | 1.31mi |
Listing history 2 events
-
2026-06-09remarks 353-char remark
-
2026-06-09$236,900 Pending
ⓘ Source: listings_history table (triggers on properties + properties_extension) + one-shot
backfill from property_details.listing_events for pre-trigger history.
Tax reassessment forecast TX · Resets to sale price
- Current annual tax
- $4,422 · $369/mo
- Projected year-2 tax
- $4,422 · $369/mo
- Expected delta
- $0/yr ($0/mo · 0.0%)
ⓘ Screening estimate from a state-policy table — verify with the county assessor before closing.
Nearby sold comps map
Loading sold comps map…
Walkable amenities ~0.75 mi
Loading nearby amenities…
Taxation est. · year 1
- Rental income
- $25,376
- − Mortgage interest
- −$13,270
- − Property taxes
- −$4,422
- − Insurance
- −$1,184
- − Repairs & maintenance
- −$2,030
- − Management
- −$2,030
- − Depreciation
- −$6,892
- Taxable loss
- −$4,452
- Est. tax savings @ 24.0%
- +$1,069
- After-tax cash flow
- $601/yr
For passive investors: Depreciation is non-cash, so a rental often shows a tax loss while cash-flowing — sheltering income. Rental losses are passive: they offset passive income freely, and up to $25,000/yr can offset ordinary (W-2) income if you actively participate and your MAGI is under $100k (phasing out to $0 by $150k); unused losses carry forward. On sale, claimed depreciation is recaptured at up to 25%, and gains may owe capital-gains tax (a 1031 exchange can defer both). Figures are a year-1 estimate at your 24.0% rate — not tax advice; consult a CPA.
Condition & rehab AI · 6 photos
This beautiful four-bedroom new home is move-in ready with good condition and minimal maintenance needs. It offers high ceilings, an open floor plan, and modern amenities, making it an attractive option for both buyers and renters.
Value-add opportunities
- Both Painting the exterior and interior — Fresh paint enhances curb appeal and interior aesthetics.
- Both Landscaping improvements — Enhanced landscaping can increase both resale and rental value.
- Both Adding smart home features — Modern technology can attract buyers and renters.
- Both Upgrading appliances — Modern appliances can improve functionality and attract more buyers and renters.
Renovation cost estimate screening
Value-add ROI direction
- Both Painting the exterior and interior — Fresh paint enhances curb appeal and interior aesthetics. ↑
- Both Landscaping improvements — Enhanced landscaping can increase both resale and rental value. ↑
- Both Adding smart home features — Modern technology can attract buyers and renters. ↑
- Both Upgrading appliances — Modern appliances can improve functionality and attract more buyers and renters. ↑
ⓘ Cost ranges are severity-bucket heuristics (US national rule-of-thumb). Get contractor quotes + a written scope before underwriting a rehab budget.
Schools (NCES district)
- District
- Brownsville ISD
- NCES district ID
- 4811680
- Math proficiency
- 20% ▼ -36.00%
- Reading proficiency
- 34% ▼ -13.00%
- Median HH income
- $30,490
- Composite
- 21.8/100
- National rank
- #8249
- State rank
- #710 of 826 in TX
Livability — Brownsville
- Score
- 79/100
- State rank
- #62
- US rank
- #2311
Category grades
Schools grade is shown separately in the Schools card above.
Census & demographics
- County
- Cameron County · 310,734 people
- City population
- 212,132
- Metro
- Brownsville-Harlingen, TX
- Population (ZIP)
- 87,380
- Household income
- $44,509
- Rent vs Own
- Severe rent burden
- 2682.0
Population outlook (Cameron County) Hauer SSP2
- Today (2025)
- 441,603 people
- By 2030
- 448,113 · +1.5%
- By 2040
- 456,385 · +3.3%
- By 2050
- 456,294 · +3.3%
- By 2075
- 423,851 · -4.0%
- By 2100
- 342,787 · -22.4%
Race, ethnicity, and origin ACS 2023
- Neighborhood character
- Predominantly Hispanic (97%)
- Race & ethnicity
- Hispanic / Latino 97% Two or more races 45% White 3%
- Hispanic origin (detail)
- Mexican 91%
- Foreign-born
- 30% · Canada
- Languages at home
- 12% English-only · Spanish 88%
Political lean MEDSL · Cameron
- 2024 margin
- Lean R (+5.8) · D 46.7% · R 52.5%
- 2008→2024 swing
- -34.6pp toward R · 2008: 28.8pp · 2024: -5.8pp
- All cycles
- 2024: R+5.8 2020: D+13.2 2016: D+32.5 2012: D+32.4 2008: D+28.8
Not yet ingested
- Civics
- —
Market trends
- HPI YoY
- ▼ -81.45%
- Current HPI
- 232.1072
- Rent YoY
- ▲ 8.19%
- Metro
- Brownsville-Harlingen, TX
- State GDP YoY
- ▲ 3.95%
- F500 in state
- 110
Industry mix (Fortune 500 HQ in TX)
| Industry | F500 HQs | Revenue |
|---|---|---|
| Energy | 16 | $1,198B |
|
||
| Technology | 5 | $198B |
|
||
| Engineering / Construction | 4 | $72B |
|
||
| Energy Services | 3 | $60B |
|
||
| Utilities | 3 | $41B |
|
||
| Healthcare | 2 | $330B |
|
||
Price history
2 events — show timeline
- 2026-03-23 Delisted — RGVMLS
- 2026-03-10 Listed $236,900 RGVMLS
Property tax history
+385.7%/yrLatest (2025): $4,422 · +385.7% YoY. Source: county tax records.
Cash-flow waterfall
monthlySold comps — $/sqft
last 12 mo · ≤1 miLoading sold comps…