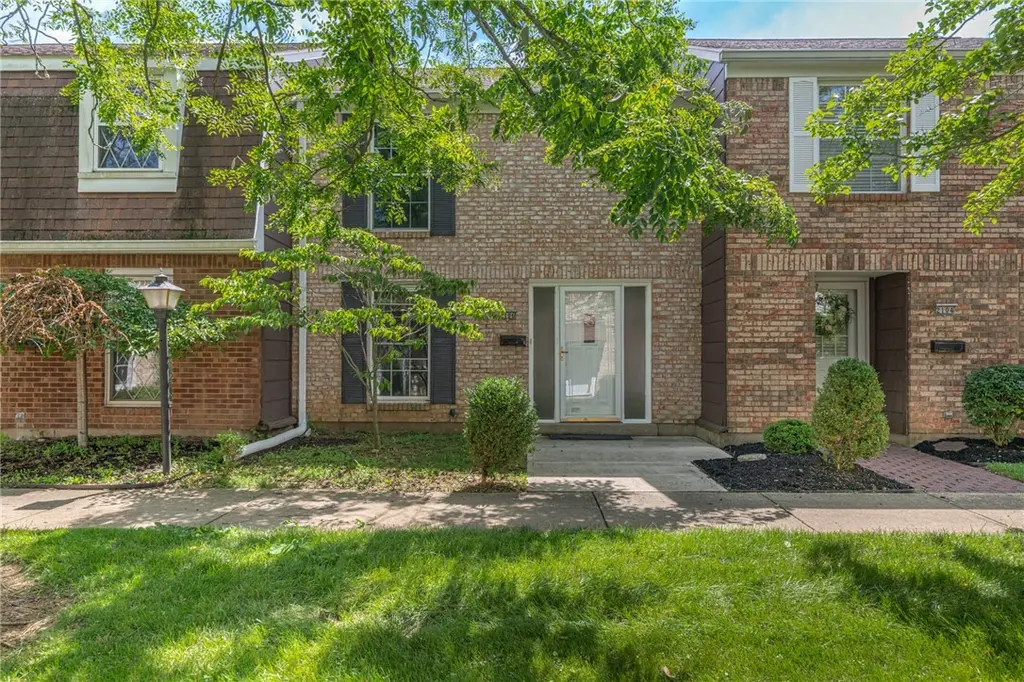
2106 Wellington Ct · Fairborn, OH
Flood risk 1/10 · Minimal
- FEMA flood zone
- X (unshaded)
- Chance of flooding over 30 yrs
- 0.0%
- Est. flood insurance / yr
- $507 – $1,088
Fire risk 1/10 · Minimal
- Est. fire insurance / yr
- $713 – $1,323
Heat risk 4/10 · Minor
- Hot days now (above 102°F)
- 7 days/yr
- Hot days in 30 yrs
- 18 days/yr
Wind risk 2/10 · Minimal
- Chance of severe wind over 30 yrs
- —
Air-quality risk 4/10 · Minor
- Unhealthy air days now
- 4 days/yr
- Unhealthy air days in 30 yrs
- 5 days/yr
Risk factors via First Street. Map © Google.
Why this score? — see what drove the D grade
The composite is a weighted blend of 9 inputs, each scored 0–100. Each bar is that input's sub-score; the figure is the points it added to the 100-point composite (weight × sub-score).
- Cash flow +12.5/30.0
- ARV discount +7.5/15.0
- 1% rule +6.2/10.0
- Rent growth +3.9/5.0
- DSCR +3.7/10.0
- Schools +3.6/10.0
- Livability +3.6/5.0
- Condition / age +2.5/5.0
- Appreciation +0.0/10.0
$125,000
🖨 Deal sheet (PDF) 📄 Offer letter ✓ Due diligence
Listing remarks
Charming 2-story Williamsburg style townhouse offering care-free living in a peaceful setting. Great floorplan with 1,280 sq ft of comfortable living space, 2 bdrms, 2.5 baths, covered 2-car carport, fence yard and handy shed for storage. Features include a spacious primary suite with private shower bath and dressing area, a large second bedroom, and a full hall bath upstairs, plus a convenient half bath on the main level for guests. Enjoy the bright first floor living space with living rm/dining rm combo and kitchen with large eat in breakfast area. This home is largely original and ready for your personal touches, offering a great opportunity to update and build equity. Perfect for homeow
Key facts
- Fenced yard
- Private clubhouse
- Convenient half bath
Tags
Property features AI
Finance
- Other: Property listed for sale
- HOA & community: Homeowners association (Rona Village of Fairborn); Association fee $315 monthly; HOA amenities include clubhouse, grounds and structure maintenance, playground, pool(s), and snow removal
Exterior
- Parking: 2-car garage; Carport
- Utilities: Public water; Storm sewer; Sewer available; Water available
- Home design: 2-story home; Entry level: 1
- Construction: Brick construction; Slab foundation
- Exterior features: Fenced yard; Patio; Storage; Shed(s)
Interior
- Kitchen: Refrigerator; Range; Dishwasher; Disposal
- Bedrooms: Bedroom on second level
- Bathrooms: 2 full bathrooms; 1 half bathroom; 1 main-level bathroom
- Heating & cooling: Forced air heating (electric); Central air conditioning
- Interior features: Total of 8 rooms; Entry/foyer; Breakfast nook; Dining room; Living room; Utility room
- Laundry & utility: Washer; Dryer; Water softener; Electric water heater; Utility room
Neighborhood map
What this means for you Summary
Snapshot
- This is a 2-bed/2.5-bath condo listed at $125k.
Deal economics
- At list price, monthly cash flow is $-17 ($-207/yr) — negative.
- To cash-flow at today's rent, offer at most $122k (2.4% below list).
- Meets the 1% rule at list price ($1k rent vs $125k).
- Recommended offer: $122k (2.4% below list) — sets the bar for cash-flow.
- Cap rate 6.1% vs local median 3.8% in Fairborn — top-decile yield for the area; either an underpriced asset or a hidden risk that comps aren't pricing in. Stress-test before assuming the spread holds.
Location & tenants
- Location reads 72/100 on livability (#374 in OH) — a middle-class / working-renter tenant base. Strengths: cost of living A+, housing A+; Watch: health & safety C-, employment D+, amenities D-.
- Fairborn City (suburban): math 36% / reading 49% proficiency, ranked #520 of 656 in OH (top 79%) — families likely to look elsewhere, expect single-tenant / working-renter base with shorter leases.
- Zoned schools: Fairborn Primary School (1,253 students, 0% FRL); Baker Middle School (math 34% / reading 46%, grade F, #511 of 654 statewide, top 79%, 939 students, 0% FRL); Fairborn High School (math 33% / reading 65%, grade D, #422 of 781 statewide, top 54%, 1,048 students, 46% FRL) — zoned schools average 15% FRL vs 51% district-wide (35 pts lower); this property's tenant base skews higher-income than the district average.
- Market conditions: Rents rising fast (+5.8%/yr); 181 active listings in the ZIP; 4 comparable units currently listed for rent nearby; rentals at typical pace (median 21d on market — plan ~3-4 weeks tenant-placement turnaround); 797 units permitted in Greene County in 2024 (148 in 5+ unit buildings).
Forward outlook
- Local home prices are declining (-3.0%/yr); year-one equity from $864 of loan paydown is wiped out by about $4k of value loss. Plan a longer hold.
Negotiation context
- Only 2 days on market — expect competitive offers; lowballing is unlikely to land.
- Current owner paid $83k; list at $125k implies a 51% gain — meaningful room to come down on a strong offer.
Risks & watch-outs
- Watch-outs: HOA is 22% of rent.
Questions for the listing agent
- What do current leases actually rent for vs. the listed asking? Can we see a recent rent roll and the last 12 months of T-12 income?
- Built in 1975 — when were the roof, HVAC, electrical panel, plumbing, and water heater last replaced?
- What does the HOA fee cover, when was the last increase, and are there any pending special assessments or reserve-fund shortfalls?
- Any open or pending special assessments — roof, HVAC, plumbing, elevator, façade? What's the per-unit balance and payoff schedule, and is the seller paying it off at close or rolling it to the buyer?
- Is there a deadline driving the sale (1031 exchange, divorce, estate, relocation)? That informs how much negotiation room exists.
- Schools are D-rated, which usually means shorter tenancies and higher turnover. Who's the typical renter profile here, and what's been the actual vacancy rate?
- The area grade is low — what's the realistic commute time and amenity access for the typical tenant pool here? Any planned neighborhood developments (good or bad) we should know about?
- What's the average days-on-market for RENTAL listings here right now (not sales)? A rising rental-DOM trend means longer vacancies and softer asking-rent achievability than the comps imply.
- What's the recent tenant-quality profile in this submarket — average credit score on applications, eviction rate, late-payment / NSF rate, and stable-employment percentage? A property-management company in the area should have these aggregated.
- How much new apartment / multifamily construction is in the pipeline within 1–3 miles? Heavy new supply (>2% of stock underway) typically softens rents 12–24 months out; light construction supports rent growth.
Investment metrics
- 1% rule
- 1.12% ✓
- Cap rate
- 6.13%
- Cash-on-cash
- -0.59%
- DSCR
- 0.97
- GRM
- 7.4
CMA / ARV
No comps found within radius.
Projected returns pro-forma
-3.0% appreciation · 5.75% rent growth · sell at horizon
- IRR
- -13.2%
- Equity multiple
- 0.51×
- Total profit
- $-17,186
- Equity at exit
- $18,638
- IRR
- 0.6%
- Equity multiple
- 1.05×
- Total profit
- $1,674
- Equity at exit
- $10,808
Cash invested: $35,000 (down + closing). Projections, not guarantees.
Landlord ↔ Tenant lean methodology
- Overall (STATE)
- 73 Landlord-Friendly
- State Ohio
- 73 Landlord-Friendly · R+6
- County
- — inherits STATE
- City
- — inherits STATE
ZIP-level market 45324
- Rents YoY
- 5.8%
- Active inventory
- 181
- Price-to-rent
- 7.4×
Monthly cashflow live
- Estimated rent
- $1,403 medium interval (Pro) →
- Mortgage (P&I)
- −$656
- Tax from tax record
- −$103 /mo · $1,236/yr
- Insurance
- −$52
- HOA
- −$315
- Vacancy / Maint / Mgmt
- −$295
- Net cashflow
- $-17
Break-even live
Sensitivity live
| Price | -10% $53 | -5% $18 | +0% $-17 | +5% $-53 | +10% $-88 |
|---|---|---|---|---|---|
| Rent | -10% $-128 | -5% $-73 | +0% $-17 | +5% $38 | +10% $94 |
| Rate | -1.0pp $46 | -0.5pp $15 | base $-17 | +0.5pp $-50 | +1.0pp $-83 |
UW: 25.0% down · 7.5% · 30yr · 1.5% tax · 5.0% vac · 8.0% maint · 8.0% mgmt
Financing live
Cash to close
- Down payment
- $31,250
- Closing costs
- $3,750
- Reserves months
- —
- Total cash needed
- —
Loan-product check · same deal, 3 products live
Conventional
25% down · 7.5% · 30yr
- Down + closing
- —
- Monthly P&I
- —
- Monthly cashflow
- —
- DSCR
- —
- Eligible?
- —
Personal DTI + credit; lowest rate.
DSCR
20% down · 8.5% · 30yr
- Down + closing
- —
- Monthly P&I
- —
- Monthly cashflow
- —
- DSCR
- —
- Eligible?
- —
No personal income docs; deal must DSCR.
Hard money
10% down · 12.0% · 12mo
- Down + closing
- —
- Monthly P&I
- —
- Monthly cashflow
- —
- DSCR
- —
- Eligible?
- —
Short-term bridge; refi at stabilization.
Rent comps 4 comps
| Address | Beds | Baths | Sqft | Rent | $/sqft | DOM | Units | Dist |
|---|---|---|---|---|---|---|---|---|
| 1102 Charleston Ct Unit 1102 Fairborn, OH | 2.0 | 1.5 | 1200 | $1,500 | $1.25 | 4d | 1 | 0.09mi |
| 1102 Charleston Ct Unit 1102 Fairborn, OH | 2.0 | 1.5 | 1200 | $1,500 | $1.25 | 21d | 1 | 0.09mi |
| 1123 Charleston Ct Unit 1123 Fairborn, OH | 2.0 | 1.5 | 1360 | $1,250 | $0.92 | 45d | 1 | 0.11mi |
| 1121 Peidmont Dr Unit Na Fairborn, OH | 3.0 | 2.0 | 1222 | $1,500 | $1.23 | 16d | 1 | 1.09mi |
HOA detail condo
- Monthly dues
- $315 · $3,780/yr
- Assessments
- None detected in remarks — confirm with the listing agent.
Listing history 2 events
-
2026-06-21remarks 699-char remark
-
2026-06-21$125,000 Active 2 DOM
ⓘ Source: listings_history table (triggers on properties + properties_extension) + one-shot
backfill from property_details.listing_events for pre-trigger history.
Tax reassessment forecast OH · Partial reset (capped growth)
- Current annual tax
- $1,236 · $103/mo
- Projected year-2 tax
- $1,593 · $133/mo
- Expected delta
- +$357/yr (+$30/mo · 28.9%)
ⓘ Screening estimate from a state-policy table — verify with the county assessor before closing.
Climate risk First Street
- Flood 1/10 Low FEMA zone X (unshaded) · 0% chance over 30 yrs
- Wildfire 1/10 Low
- Heat 4/10 Moderate 7 d/yr ≥102°F today · 18 d/yr by 30 yrs out
- Wind 2/10 Low
- Air quality 4/10 Moderate 4 unhealthy d/yr today · 5 by 30 yrs out
Nearby sold comps map
Loading sold comps map…
Walkable amenities ~0.75 mi
Loading nearby amenities…
Taxation est. · year 1
- Rental income
- $16,835
- − Mortgage interest
- −$7,002
- − Property taxes
- −$1,236
- − Insurance
- −$625
- − Repairs & maintenance
- −$1,347
- − Management
- −$1,347
- − HOA
- −$3,780
- − Depreciation
- −$3,636
- Taxable loss
- −$2,138
- Est. tax savings @ 24.0%
- +$513
- After-tax cash flow
- $306/yr
For passive investors: Depreciation is non-cash, so a rental often shows a tax loss while cash-flowing — sheltering income. Rental losses are passive: they offset passive income freely, and up to $25,000/yr can offset ordinary (W-2) income if you actively participate and your MAGI is under $100k (phasing out to $0 by $150k); unused losses carry forward. On sale, claimed depreciation is recaptured at up to 25%, and gains may owe capital-gains tax (a 1031 exchange can defer both). Figures are a year-1 estimate at your 24.0% rate — not tax advice; consult a CPA.
Schools (NCES district)
- District
- Fairborn City
- NCES district ID
- 3904396
- Math proficiency
- 36% ▼ -17.00%
- Reading proficiency
- 49% ▼ -10.00%
- Median HH income
- $45,091
- Composite
- 36.05/100
- National rank
- #4772
- State rank
- #520 of 656 in OH
Livability — Fairborn
- Score
- 72/100
- State rank
- #374
- US rank
- #6101
Category grades
Schools grade is shown separately in the Schools card above.
Census & demographics
- Census place
- Fairborn, OH
- County
- Greene County · 132,120 people
- City population
- 41,194
- Metro
- Dayton-Kettering, OH
- Population (ZIP)
- 41,194
- Household income
- $64,979
- Rent vs Own
- Severe rent burden
- 1472.0
Population outlook (Greene County) Hauer SSP2
- Today (2025)
- 170,301 people
- By 2030
- 171,840 · +0.9%
- By 2040
- 171,408 · +0.7%
- By 2050
- 167,806 · -1.5%
- By 2075
- 154,430 · -9.3%
- By 2100
- 138,669 · -18.6%
Race, ethnicity, and origin ACS 2023
- Neighborhood character
- Predominantly White (78%)
- Race & ethnicity
- White 78% Two or more races 9% Black 8% Hispanic / Latino 3% Asian 2%
- Common ancestry
- Lithuanian 2% Slovak 2% Italian 1%
- Foreign-born
- 6% · Canada, China
- Languages at home
- 94% English-only · Spanish 1% German/W. Germanic 1% Other Indo-European 1%
Political lean MEDSL · Greene
- 2024 margin
- R (+19.8) · D 39.5% · R 59.3% · Other 1.2%
- 2008→2024 swing
- -1.4pp toward R · 2008: -18.4pp · 2024: -19.8pp
- All cycles
- 2024: R+19.8 2020: R+19.5 2016: R+24.5 2012: R+21.8 2008: R+18.4
Not yet ingested
- Civics
- —
Market trends
- HPI YoY
- ▼ -157.48%
- Current HPI
- 228.0801
- Rent YoY
- ▲ 5.75%
- Metro
- Dayton-Kettering, OH
- State GDP YoY
- ▲ 1.98%
- F500 in state
- 48
Industry mix (Fortune 500 HQ in OH)
| Industry | F500 HQs | Revenue |
|---|---|---|
| Insurance | 3 | $145B |
|
||
| Industrial Machinery | 3 | $49B |
|
||
| Financial Services | 3 | $24B |
|
||
| Consumer Goods | 2 | $93B |
|
||
| Aerospace / Defense | 2 | $47B |
|
||
| Utilities | 2 | $33B |
|
||
Price history
+155.1% since first listed4 events — show timeline
- 2026-06-19 Listed $125,000 Dayton MLS
- 2005-08-04 Sold (Public Records) $82,900 Public Records
- 2002-07-12 Sold (Public Records) $67,800 Public Records
- 1984-05-04 Sold (Public Records) $49,000 Public Records
Property tax history
+4.6%/yrLatest (2025): $1,236 · -0.5% YoY. Source: county tax records.
Cash-flow waterfall
monthlySold comps — $/sqft
last 12 mo · ≤1 miLoading sold comps…