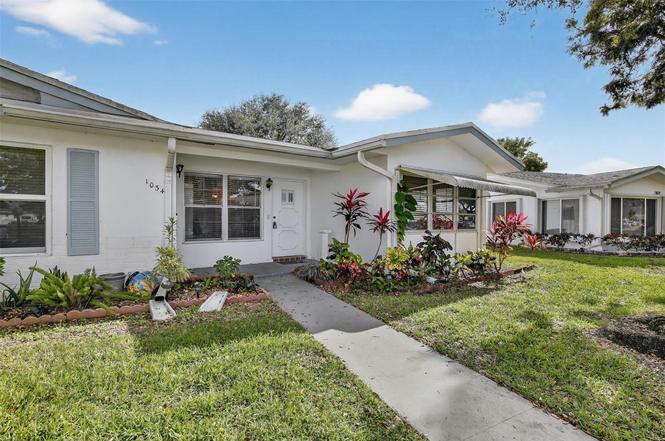
1032 NW 83 Ave Unit D58 · Plantation, FL
Flood risk 1/10 · Minimal
- FEMA flood zone
- X (shaded)
- Chance of flooding over 30 yrs
- 0.0%
- Est. flood insurance / yr
- $507 – $1,088
Fire risk 1/10 · Minimal
- Est. fire insurance / yr
- $947 – $1,759
Heat risk 10/10 · Severe
- Hot days now (above 105°F)
- 7 days/yr
- Hot days in 30 yrs
- 26 days/yr
Wind risk 10/10 · Severe
- Chance of severe wind over 30 yrs
- 99.0%
Air-quality risk 3/10 · Minor
- Unhealthy air days now
- 2 days/yr
- Unhealthy air days in 30 yrs
- 3 days/yr
Risk factors via First Street. Map © Google.
Why this score? — see what drove the D grade
The composite is a weighted blend of 9 inputs, each scored 0–100. Each bar is that input's sub-score; the figure is the points it added to the 100-point composite (weight × sub-score).
- Cash flow +10.8/30.0
- ARV discount +7.5/15.0
- 1% rule +6.1/10.0
- Schools +4.1/10.0
- Livability +4.1/5.0
- DSCR +3.1/10.0
- Rent growth +2.7/5.0
- Condition / age +2.5/5.0
- Appreciation +0.0/10.0
$223,900
🖨 Deal sheet 📄 Offer letter ✓ Due diligence
Listing remarks
Welcome to your dream home! Nestled on a charming corner lot, this inviting residence boasts a breathtaking lake view that will captivate your heart in LAUDERDALE WEST AN ACTIVE 55+ COMMUNITY. UP DATED KITCHEN WITH NEW REFRIG. DISHERWASHER AND MICROWAVE CABINETS, COUNTERS. Recently refreshed with a fresh coat of paint and new laminated floors, along with NEW blinds. This cozy abode offers spacious closets and an abundance of natural light, creating a warm and welcoming atmosphere. Enjoy the convenience of numerous amenities, including lawn, basic cable, internet, 2 clubhouses, pools, tennis counts, fitness center, card rooms, organized clubs, bus service, roof repairs/replacements, exterior
Key facts
- 2 parking spots
- Community pool
- Built 1977
Property features AI
Finance
- HOA & community: Has association; Monthly HOA fee; Association amenities include: billiard room, clubhouse, fitness center, parking, pool, shuffleboard court, spa/hot tub, community room, courtesy bus, hobby room, internet included, library, maintenance; HOA covers maintenance of grounds, trash, common areas, roof repairs, recreation facility, and pool service; Senior community
Exterior
- Parking: Guest parking; 2 open parking spaces
- Security: Other security features
- Utilities: Cable available
- Home design: Villa; Single-story; Faces north; Resale condition
- Construction: CBS construction
- Exterior features: First-floor/foyer entry; Waterfront property
Interior
- Kitchen: Dishwasher; Electric range; Refrigerator
- Bedrooms: 2 bedrooms on the main level
- Flooring: Laminate flooring; Tile flooring
- Bathrooms: 2 full bathrooms (main level)
- Heating & cooling: Central heating; Central air conditioning
- Interior features: Entrance foyer; Blinds on windows
Neighborhood map
What this means for you Summary
Snapshot
- This is a 2-bed/2.0-bath condo listed at $224k.
Deal economics
- At list price, monthly cash flow is $-100 ($-1k/yr) — negative.
- To cash-flow at today's rent, offer at most $209k (6.5% below list).
- Meets the 1% rule at list price ($2k rent vs $224k).
- Recommended offer: $204k (9.0% below list) — sets the bar for market timing.
- Cap rate 5.8% vs local median 3.4% in Plantation — top-decile yield for the area; either an underpriced asset or a hidden risk that comps aren't pricing in. Stress-test before assuming the spread holds.
Location & tenants
- Location reads 82/100 on livability (#70 in FL, #1,174 nationally) — a professional / high-income tenant draw. Strengths: commute A+, housing A+, health & safety A+; Watch: amenities C-, cost of living D-.
- Broward (suburban): math 42% / reading 53% proficiency, ranked #46 of 73 in FL (top 63%) — families likely to look elsewhere, expect single-tenant / working-renter base with shorter leases.
- Zoned schools: Mirror Lake Elementary School (math 33% / reading 48%, grade F, #1,471 of 2,144 statewide, top 69%, 610 students, 68% FRL); Plantation Middle School (math 20% / reading 39%, grade F, #469 of 571 statewide, top 84%, 572 students, 72% FRL); Plantation High School (math 14% / reading 36%, grade F, #501 of 667 statewide, top 75%, 1,818 students, 68% FRL) — zoned schools average 70% FRL vs 51% district-wide (18 pts higher); higher-poverty schools than district average — tighter screening recommended.
- Zoned-school proficiency averages 32% at this address vs 48% district-wide (-16 pts) — the specific schools serving this property underperform the Broward average; the district grade overstates school quality for this exact location.
- Market conditions: Rents flat; 559 active listings in the ZIP; 40 comparable units currently listed for rent nearby; rentals at typical pace (median 15d on market — plan ~3-4 weeks tenant-placement turnaround); 2,111 units permitted in Broward County in 2024 (1,265 in 5+ unit buildings).
Forward outlook
- Local home prices are declining (-3.0%/yr); year-one equity from $2k of loan paydown is wiped out by about $7k of value loss. Plan a longer hold.
- Broward County population projected at +34% by 2050 — long-run rental-demand tailwind backs the buy-and-hold thesis.
Negotiation context
- It's been on market 99 days — a 9% lower offer ($204k) is reasonable based on typical stale-listing flexibility.
- 3 sale attempts with the ask held roughly flat each time — persistent listings suggest the price (not the market) is what's stuck; bring a comps-based counter.
- Current owner paid $135k; list at $224k implies a 66% gain — meaningful room to come down on a strong offer.
Risks & watch-outs
- Watch-outs: HOA is 21% of rent.
- Climate carrying-cost: severe wind risk, 99% chance of damaging wind over 30y; extreme-heat days projected 7→26/yr by 2055 (HVAC capex compounding) — expect insurance premiums to compound above CPI over the hold.
Questions for the listing agent
- What do current leases actually rent for vs. the listed asking? Can we see a recent rent roll and the last 12 months of T-12 income?
- It's been on market 99 days. Have you received any prior offers? Is the seller open to a 9% concession, seller financing, or rate buy-down credit?
- Built in 1977 — when were the roof, HVAC, electrical panel, plumbing, and water heater last replaced?
- What does the HOA fee cover, when was the last increase, and are there any pending special assessments or reserve-fund shortfalls?
- Any open or pending special assessments — roof, HVAC, plumbing, elevator, façade? What's the per-unit balance and payoff schedule, and is the seller paying it off at close or rolling it to the buyer?
- Why hasn't it sold? Are there any deal-killer items the seller is aware of (foundation, flood, title, zoning, code violations)?
- Is there a deadline driving the sale (1031 exchange, divorce, estate, relocation)? That informs how much negotiation room exists.
- Schools are B-rated — typically a magnet for longer-tenancy family renters. What's the average tenant stay here, and is there a school-zone premium baked into asking?
- The area grade is low — what's the realistic commute time and amenity access for the typical tenant pool here? Any planned neighborhood developments (good or bad) we should know about?
- What's the average days-on-market for RENTAL listings here right now (not sales)? A rising rental-DOM trend means longer vacancies and softer asking-rent achievability than the comps imply.
- What's the recent tenant-quality profile in this submarket — average credit score on applications, eviction rate, late-payment / NSF rate, and stable-employment percentage? A property-management company in the area should have these aggregated.
- How much new apartment / multifamily construction is in the pipeline within 1–3 miles? Heavy new supply (>2% of stock underway) typically softens rents 12–24 months out; light construction supports rent growth.
Investment metrics
- 1% rule
- 1.11% ✓
- Cap rate
- 5.75%
- Cash-on-cash
- -1.92%
- DSCR
- 0.91
- GRM
- 7.5
CMA / ARV
No comps found within radius.
Projected returns pro-forma
-3.0% appreciation · 0.6% rent growth · sell at horizon
- IRR
- -23.0%
- Equity multiple
- 0.23×
- Total profit
- $-48,174
- Equity at exit
- $33,384
- IRR
- -28.9%
- Equity multiple
- -0.14×
- Total profit
- $-71,632
- Equity at exit
- $19,359
Cash invested: $62,692 (down + closing). Projections, not guarantees.
Landlord ↔ Tenant lean methodology
- Overall (STATE)
- 87 Strongly Landlord-Friendly
- State Florida
- 87 Strongly Landlord-Friendly · R+3
- County
- — inherits STATE
- City
- — inherits STATE
ZIP-level market 33322
- Home prices YoY
- -33.3%
- Rents YoY
- 0.6%
- Active inventory
- 559
- Price-to-rent
- 7.5×
Monthly cashflow live
- Estimated rent
- $2,481 high interval (Pro) →
- Mortgage (P&I)
- −$1,174
- Tax est. 1.5%
- −$280 /mo · $3,358/yr
- Insurance
- −$93
- HOA
- −$513
- Vacancy / Maint / Mgmt
- −$521
- Net cashflow
- $-100
Break-even live
UW: 25.0% down · 7.5% · 30yr · 1.5% tax · 5.0% vac · 8.0% maint · 8.0% mgmt
Financing live
Cash to close
- Down payment
- $55,975
- Closing costs
- $6,717
- Reserves months
- —
- Total cash needed
- —
Loan-product check · same deal, 3 products live
Conventional
25% down · 7.5% · 30yr
- Down + closing
- —
- Monthly P&I
- —
- Monthly cashflow
- —
- DSCR
- —
- Eligible?
- —
Personal DTI + credit; lowest rate.
DSCR
20% down · 8.5% · 30yr
- Down + closing
- —
- Monthly P&I
- —
- Monthly cashflow
- —
- DSCR
- —
- Eligible?
- —
No personal income docs; deal must DSCR.
Hard money
10% down · 12.0% · 12mo
- Down + closing
- —
- Monthly P&I
- —
- Monthly cashflow
- —
- DSCR
- —
- Eligible?
- —
Short-term bridge; refi at stabilization.
Rent comps 40 comps
| Address | Beds | Baths | Sqft | Rent | $/sqft | DOM | Units | Dist |
|---|---|---|---|---|---|---|---|---|
| 8080 NW 10th Ct Plantation, FL | 2.0 | 2.0 | 1111 | $2,300 | $2.07 | 24d | 1 | 0.16mi |
| 8080 NW 10th Ct Plantation, FL | 1.0 | 1.0 | 862 | $1,875 | $2.18 | 20d | 1 | 0.16mi |
| 1140 NW 85th Ave Unit A16 Plantation, FL | 2.0 | 1.5 | 1065 | $1,950 | $1.83 | 24d | 1 | 0.19mi |
| 8423 NW 12th St Unit C67 Plantation, FL | 1.0 | 2.0 | 1046 | $2,050 | $1.96 | 7d | 1 | 0.19mi |
| 1171 Lakepointe Lndg Plantation, FL | 2.0 | 1.0–2.0 | 837 | $2,889 | $3.45 | 2d | 21 | 0.29mi |
| 8536 NW 12th Ct Plantation, FL | 2.0 | 2.0 | 1138 | $2,625 | $2.31 | 17d | 1 | 0.32mi |
| 8300 Cleary Blvd Plantation, FL | 1.0 | 1.0 | 760 | $2,566 | $3.38 | 20d | 1 | 0.33mi |
| 8300 Cleary Blvd Plantation, FL | 1.0 | 1.0 | 760 | $2,483 | $3.27 | 3d | 1 | 0.33mi |
| 8300 Cleary Blvd Plantation, FL | 2.0 | 2.0 | 1099 | $3,032 | $2.76 | 18d | 1 | 0.33mi |
| 1031 NW 79th Ave #1031 Plantation, FL | 2.0 | 2.0 | 1062 | $2,400 | $2.26 | 18d | 1 | 0.35mi |
| 8000 Cleary Blvd Plantation, FL | 2.0–3.0 | 2.0–3.0 | 1357 | $2,548 | $1.88 | 1d | 21 | 0.36mi |
| 832 NW 86th Ave Plantation, FL | 2.0 | 2.0 | 1144 | $2,913 | $2.55 | 22d | 1 | 0.38mi |
| 832 NW 86th Ave Plantation, FL | 1.0 | 1.0 | 976 | $2,141 | $2.19 | 12d | 1 | 0.38mi |
| 8500 Cleary Blvd Plantation, FL | 1.0–3.0 | 1.0–2.0 | 1045 | $2,921 | $2.80 | 2d | 18 | 0.39mi |
| 962 NW 79th Ter Plantation, FL | 2.0 | 2.0 | 1432 | $2,997 | $2.09 | 24d | 1 | 0.40mi |
| 8101 NW 14th St Plantation, FL | 1.0–2.0 | 1.5–2.0 | 1123 | $2,619 | $2.33 | 1d | 11 | 0.42mi |
| 651 NW 82nd Ave Plantation, FL | 1.0 | 1.0 | 919 | $2,684 | $2.92 | 22d | 1 | 0.47mi |
| 7903 NW 7th Ct Unit 7903 Plantation, FL | 3.0 | 2.5 | 1340 | $2,800 | $2.09 | 22d | 1 | 0.48mi |
| 9000 NW 9th St Plantation, FL | 1.0 | 1.0 | 800 | $2,287 | $2.86 | 20d | 1 | 0.48mi |
| 791 N Pine Island Rd Plantation, FL | 2.0–3.0 | 2.0 | 1196 | $2,000 | $1.67 | 5d | 2 | 0.48mi |
| 791 N Pine Island Rd #306 Plantation, FL | 3.0 | 2.0 | 1320 | $2,400 | $1.82 | 12d | 1 | 0.48mi |
| 7885 NW 7th Ct #406 Plantation, FL | 3.0 | 2.5 | 1340 | $2,800 | $2.09 | 11d | 1 | 0.49mi |
| 771 N Pine Island Rd #213 Plantation, FL | 2.0 | 2.5 | 1385 | $2,400 | $1.73 | 5d | 1 | 0.53mi |
| 601 NW 82nd Ave Plantation, FL | 1.0–2.0 | 1.0–2.5 | 1073 | $3,473 | $3.24 | 3d | 10 | 0.53mi |
| 711 N Pine Island Rd Plantation, FL | 1.0–2.0 | 1.0–2.0 | 910 | $1,850 | $2.03 | 7d | 4 | 0.55mi |
| 711 N Pine Island Rd Plantation, FL | 1.0–2.0 | 1.0–2.0 | 910 | $1,850 | $2.03 | 3d | 5 | 0.55mi |
| 701 N Pine Island Rd #105 Plantation, FL | 1.0 | 1.5 | 764 | $1,650 | $2.16 | 17d | 1 | 0.57mi |
| 510 NW 84th Ave Plantation, FL | 1.0–3.0 | 1.0–2.0 | 1124 | $2,650 | $2.36 | 17d | 6 | 0.58mi |
| 510 NW 84th Ave Plantation, FL | 2.0–3.0 | 2.0 | 1303 | $2,800 | $2.15 | 15d | 5 | 0.58mi |
| 510 NW 84th Ave Plantation, FL | 1.0–3.0 | 1.0–2.0 | 1124 | $2,700 | $2.40 | 1d | 5 | 0.58mi |
| 510 NW 84th Ave Plantation, FL | 1.0–3.0 | 1.0–2.0 | 1137 | $2,900 | $2.55 | 11d | 7 | 0.58mi |
| 751 N Pine Island Rd Plantation, FL | 1.0–3.0 | 1.0–2.0 | 1003 | $2,200 | $2.19 | 24d | 2 | 0.59mi |
| 741 N Pine Island Rd #303 Plantation, FL | 3.0 | 2.0 | 1214 | $2,400 | $1.98 | 24d | 1 | 0.61mi |
| 721 N Pine Island Rd Plantation, FL | 2.0 | 2.0 | 1058 | $1,925 | $1.82 | 17d | 2 | 0.62mi |
| 721 N Pine Island Rd Plantation, FL | 1.0–2.0 | 1.5–2.0 | 912 | $2,100 | $2.30 | 15d | 3 | 0.62mi |
| 721 N Pine Island Rd Plantation, FL | 1.0–2.0 | 1.5–2.0 | 912 | $2,100 | $2.30 | 7d | 3 | 0.62mi |
| 721 N Pine Island Rd #103 Plantation, FL | 2.0 | 2.0 | 1057 | $2,100 | $1.99 | 24d | 1 | 0.62mi |
| 1661 NW 81st Way #1661 Plantation, FL | 2.0 | 2.0 | 1034 | $2,400 | $2.32 | 3d | 1 | 0.62mi |
| 1661 NW 81st Way #1661 Plantation, FL | 2.0 | 2.0 | 1034 | $2,500 | $2.42 | 24d | 1 | 0.62mi |
| 731 N Pine Island Rd #401 Plantation, FL | 2.0 | 2.0 | 1057 | $2,300 | $2.18 | 15d | 1 | 0.67mi |
HOA detail condo
- Monthly dues
- $513 · $6,156/yr
- Likely covers
- internetcableroofpoolgym
- Assessments
- None detected in remarks — confirm with the listing agent.
Listing history 19 events
-
2026-06-18days on market $223,900 Active 99 DOM
-
2026-06-17days on market $223,900 Active 98 DOM
-
2026-06-16days on market $223,900 Active 97 DOM
-
2026-06-15days on market $223,900 Active 96 DOM
-
2026-06-13days on market $223,900 Active 94 DOM
-
2026-06-09statusdays on market $223,900 Active 90 DOM
-
2026-06-07days on market $223,900 Active Under Contract 88 DOM
-
2026-06-04statusdays on market $223,900 Active Under Contract 85 DOM
-
2026-06-03days on market $223,900 Active 84 DOM
-
2026-06-02days on market $223,900 Active 83 DOM
-
2026-06-01days on market $223,900 Active 82 DOM
-
2026-05-31days on market $223,900 Active 81 DOM
-
2026-03-30status Active
-
2026-03-11Active Under Contract
-
2026-01-12$223,900
-
2005-07-07soldstatus $134,900
-
2001-09-13soldstatus $67,000
-
2000-05-10soldstatus $63,500
-
1987-03-10soldstatus $43,000
ⓘ Source: listings_history table (triggers on properties + properties_extension) + one-shot
backfill from property_details.listing_events for pre-trigger history.
Climate risk First Street
- Flood 1/10 Low FEMA zone X (shaded) · 0% chance over 30 yrs
- Wildfire 1/10 Low
- Heat 10/10 Extreme 7 d/yr ≥105°F today · 26 d/yr by 30 yrs out
- Wind 10/10 Extreme 99% chance of damaging wind over 30 yrs
- Air quality 3/10 Moderate 2 unhealthy d/yr today · 3 by 30 yrs out
Nearby sold comps map
Loading sold comps map…
Walkable amenities ~0.75 mi
Loading nearby amenities…
Taxation est. · year 1
- Rental income
- $29,771
- − Mortgage interest
- −$12,542
- − Property taxes
- −$3,358
- − Insurance
- −$1,120
- − Repairs & maintenance
- −$2,382
- − Management
- −$2,382
- − HOA
- −$6,156
- − Depreciation
- −$6,513
- Taxable loss
- −$4,682
- Est. tax savings @ 24.0%
- +$1,124
- After-tax cash flow
- $-81/yr
For passive investors: Depreciation is non-cash, so a rental often shows a tax loss while cash-flowing — sheltering income. Rental losses are passive: they offset passive income freely, and up to $25,000/yr can offset ordinary (W-2) income if you actively participate and your MAGI is under $100k (phasing out to $0 by $150k); unused losses carry forward. On sale, claimed depreciation is recaptured at up to 25%, and gains may owe capital-gains tax (a 1031 exchange can defer both). Figures are a year-1 estimate at your 24.0% rate — not tax advice; consult a CPA.
Schools (NCES district)
- District
- Broward
- NCES district ID
- 1200180
- Math proficiency
- 42% ▼ -18.00%
- Reading proficiency
- 53% ▼ -5.00%
- Median HH income
- $52,139
- Composite
- 40.88/100
- National rank
- #3621
- State rank
- #46 of 73 in FL
Livability — Plantation
- Score
- 82/100
- State rank
- #70
- US rank
- #1174
Category grades
Schools grade is shown separately in the Schools card above.
Census & demographics
- Census place
- Plantation, FL
- County
- Broward County · 1,963,430 people
- City population
- 111,690
- Metro
- Miami-Fort Lauderdale-Pompano Beach, FL
- Population (ZIP)
- 41,128
- Household income
- $71,755
- Rent vs Own
- Severe rent burden
- 931.0
Population outlook (Broward County) Hauer SSP2
- Today (2025)
- 2,207,033 people
- By 2030
- 2,360,704 · +7.0%
- By 2040
- 2,661,208 · +20.6%
- By 2050
- 2,946,698 · +33.5%
- By 2075
- 3,602,273 · +63.2%
- By 2100
- 3,970,984 · +79.9%
Race, ethnicity, and origin ACS 2023
- Neighborhood character
- Highly diverse neighborhood (Simpson 0.72)
- Race & ethnicity
- Hispanic / Latino 35% White 32% Black 24% Two or more races 22% Asian 4%
- Hispanic origin (detail)
- Puerto Rican 5% Cuban 6% Dominican 2% Salvadoran 1%
- Common ancestry
- Hispanic 5% Romanian 2% Scotch-Irish 2%
- Foreign-born
- 41% · Canada, Jamaica, South Korea
- Languages at home
- 58% English-only · Spanish 30% French/Haitian/Cajun 6% Other Indo-European 1%
Political lean MEDSL · Broward
- 2024 margin
- D (+17.0) · D 58.0% · R 41.0%
- 2008→2024 swing
- -17.8pp toward R · 2008: 34.7pp · 2024: 17.0pp
- All cycles
- 2024: D+17.0 2020: D+29.8 2016: D+35.0 2012: D+34.9 2008: D+34.7
Not yet ingested
- Civics
- —
Market trends
- HPI YoY
- ▼ -203.34%
- Current HPI
- 407.5452
- Rent YoY
- ▲ 0.60%
- Metro
- Miami-Fort Lauderdale-Pompano Beach, FL
- State GDP YoY
- ▲ 3.28%
- F500 in state
- 36
Industry mix (Fortune 500 HQ in FL)
| Industry | F500 HQs | Revenue |
|---|---|---|
| Industrial Technology | 2 | $29B |
|
||
| Insurance | 2 | $17B |
|
||
| Retail | 1 | $60B |
|
||
| Technology Distribution | 1 | $58B |
|
||
| Homebuilding | 1 | $35B |
|
||
| Technology Manufacturing | 1 | $35B |
|
||
Price history
+420.7% since first listed7 events — show timeline
- 2026-03-30 Relisted — Beaches MLS
- 2026-03-11 Listed — Beaches MLS
- 2026-01-12 Listed $223,900 Beaches MLS
- 2005-07-07 Sold (Public Records) $134,900 Public Records
- 2001-09-13 Sold (Public Records) $67,000 Public Records
- 2000-05-10 Sold (Public Records) $63,500 Public Records
- 1987-03-10 Sold (Public Records) $43,000 Public Records
Property tax history
+4.1%/yrLatest (2025): $270 · +8.2% YoY. Source: county tax records.
Cash-flow waterfall
monthlySold comps — $/sqft
last 12 mo · ≤1 miLoading sold comps…