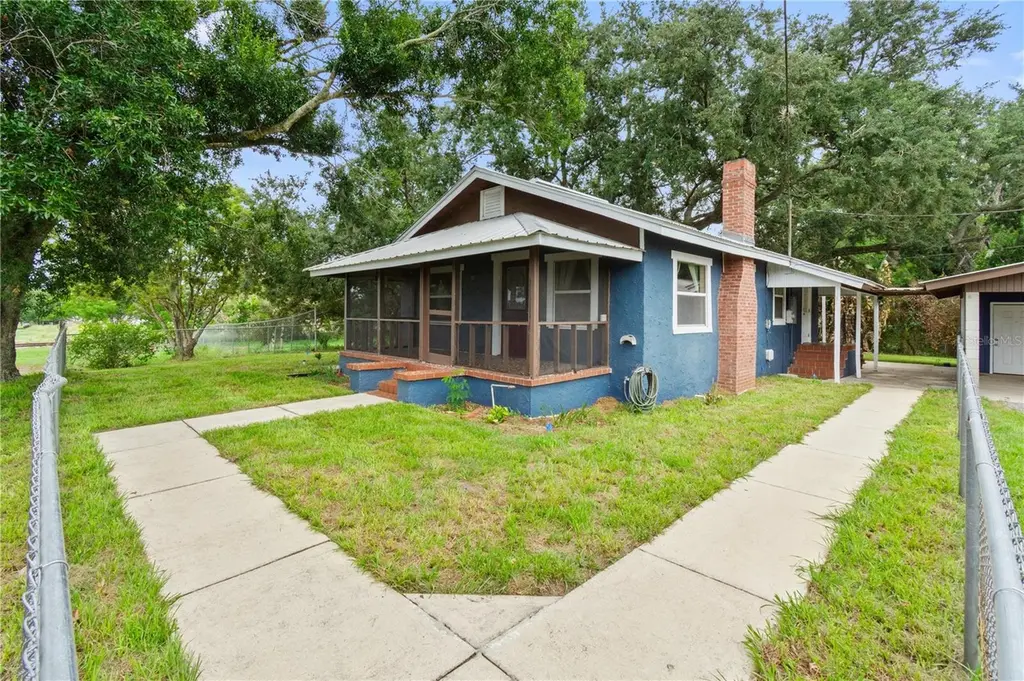
30 E 8th St · Frostproof, FL
Flood risk 1/10 · Minimal
- FEMA flood zone
- X (unshaded)
- Chance of flooding over 30 yrs
- 0.0%
- Est. flood insurance / yr
- $507 – $1,088
Fire risk 3/10 · Minor
- Est. fire insurance / yr
- $947 – $1,759
Heat risk 8/10 · Major
- Hot days now (above 108°F)
- 7 days/yr
- Hot days in 30 yrs
- 24 days/yr
Wind risk 9/10 · Severe
- Chance of severe wind over 30 yrs
- 99.0%
Air-quality risk 2/10 · Minimal
- Unhealthy air days now
- 0 days/yr
- Unhealthy air days in 30 yrs
- 2 days/yr
Risk factors via First Street. Map © Google.
Why this score? — see what drove the D grade
The composite is a weighted blend of 9 inputs, each scored 0–100. Each bar is that input's sub-score; the figure is the points it added to the 100-point composite (weight × sub-score).
- Cash flow +10.9/30.0
- ARV discount +7.5/15.0
- Appreciation +4.7/10.0
- Schools +3.5/10.0
- Livability +3.5/5.0
- DSCR +3.2/10.0
- 1% rule +2.6/10.0
- Rent growth +2.5/5.0
- Condition / age +2.5/5.0
$179,000
🖨 Deal sheet 📄 Offer letter ✓ Due diligence
Listing remarks MLS
Looking for a charming little bungalow to call home? Here it is!!! This adorable home, built in 1925, boasts 2 bed/2 bath and was updated in 2005 with new plumbing, windows, roof, flooring and more! Spacious, open floor plan offers easy living with lots of storage! Complete with a large 2 car carport, laundry room and lushly landscaped fenced yard. Take time to relax and enjoy either of your screen enclosed porches, front or back! This little gem has a so much to offer and will be gone in no time. .. .don't wait to see it!
Key facts
- Screened front porch
- Updated roofing
- Open floor plan
Tags
Property features AI
Finance
- Other: Zoning: RM; Lot approximately 0.34 acres (100.2 x 147); Total building area approximately 1,136 sq ft (public records)
- Financial info: No lease restrictions
- HOA & community: No association
Exterior
- Parking: Covered carport; 2 carport spaces
- Utilities: Public water; Public sewer; Sewer connected; Water connected; Irrigation equipment
- Home design: Single family residence; One story; North facing; Homestead property
- Construction: Stucco and frame construction; Metal roof; Crawlspace foundation; Workshop/other structure on site; Built with approximately 912 sq ft living area (public records)
- Exterior features: Storage; Chain link fencing; Paved road access; City limits lot
Interior
- Kitchen: Dishwasher; Range; Microwave; Refrigerator; Electric water heater
- Bedrooms: 2 bedrooms
- Flooring: Vinyl
- Bathrooms: 2 full bathrooms
- Heating & cooling: Central heating; Central air conditioning; Decorative fireplace in living room
- Interior features: Ceiling fans
- Laundry & utility: Washer; Dryer; Laundry area in garage
Neighborhood map
What this means for you Summary
Snapshot
- This is a 3-bed/1.0-bath single-family listed at $179k.
Deal economics
- At list price, monthly cash flow is $-79 ($-944/yr) — negative.
- To cash-flow at today's rent, offer at most $165k (7.8% below list).
- To meet the 1% rule (rent ≥ 1% of price), the offer needs to be $137k (23.7% below list).
- Recommended offer: $137k (23.7% below list) — sets the bar for 1% rule.
Location & tenants
- Location reads 69/100 on livability (#456 in FL) — a middle-class / working-renter tenant base. Strengths: cost of living A+, housing A+, health & safety A+; Watch: schools D-, amenities F, commute F.
- Polk (suburban): math 39% / reading 43% proficiency, ranked #62 of 73 in FL (top 85%) — families likely to look elsewhere, expect single-tenant / working-renter base with shorter leases.
- Market conditions: 437 active listings in the ZIP; 2 comparable units currently listed for rent nearby; 10,384 units permitted in Polk County in 2024 (1,716 in 5+ unit buildings).
Forward outlook
- In year one you build about $37 of equity ($1k loan paydown + $-1k appreciation (-0.7% local appreciation)).
- Polk County population projected at +33% by 2050 — long-run rental-demand tailwind backs the buy-and-hold thesis.
Negotiation context
- It's been on market 15 days — a 2% lower offer ($176k) is reasonable based on typical stale-listing flexibility.
- 2 sale attempts since 5y ago with the ask held roughly flat each time — persistent listings suggest the price (not the market) is what's stuck; bring a comps-based counter.
- Current owner paid $129k; 39% above their basis — modest negotiation headroom, anchor on the comps not their cost.
Risks & watch-outs
- Watch-outs: built in 1925 — expect roof / HVAC / electrical / plumbing capex.
- Climate carrying-cost: severe wind risk, 99% chance of damaging wind over 30y; extreme-heat days projected 7→24/yr by 2055 (HVAC capex compounding) — expect insurance premiums to compound above CPI over the hold.
Questions for the listing agent
- What do current leases actually rent for vs. the listed asking? Can we see a recent rent roll and the last 12 months of T-12 income?
- Built in 1925 — when were the roof, HVAC, electrical panel, plumbing, and water heater last replaced?
- Is there a deadline driving the sale (1031 exchange, divorce, estate, relocation)? That informs how much negotiation room exists.
- Schools are D-rated, which usually means shorter tenancies and higher turnover. Who's the typical renter profile here, and what's been the actual vacancy rate?
- The area grade is low — what's the realistic commute time and amenity access for the typical tenant pool here? Any planned neighborhood developments (good or bad) we should know about?
- What's the average days-on-market for RENTAL listings here right now (not sales)? A rising rental-DOM trend means longer vacancies and softer asking-rent achievability than the comps imply.
- What's the recent tenant-quality profile in this submarket — average credit score on applications, eviction rate, late-payment / NSF rate, and stable-employment percentage? A property-management company in the area should have these aggregated.
- How much new for-sale + rental construction is in the pipeline within 1–3 miles? Heavy new supply typically softens prices + rents 12–24 months out; constrained supply supports both.
Investment metrics
- 1% rule
- 0.76% ✗
- Cap rate
- 5.77%
- Cash-on-cash
- -1.88%
- DSCR
- 0.92
- GRM
- 10.9
CMA / ARV
No comps found within radius.
Projected returns pro-forma
-0.67% appreciation · 3.0% rent growth · sell at horizon
- IRR
- -7.1%
- Equity multiple
- 0.68×
- Total profit
- $-15,845
- Equity at exit
- $46,050
- IRR
- -0.6%
- Equity multiple
- 0.94×
- Total profit
- $-2,984
- Equity at exit
- $50,821
Cash invested: $50,120 (down + closing). Projections, not guarantees.
Landlord ↔ Tenant lean methodology
- Overall (STATE)
- 87 Strongly Landlord-Friendly
- State Florida
- 87 Strongly Landlord-Friendly · R+3
- County
- — inherits STATE
- City
- — inherits STATE
ZIP-level market 33843
- Home prices YoY
- -0.2%
- Active inventory
- 437
- Price-to-rent
- 10.9×
Monthly cashflow live
- Estimated rent
- $1,367 medium interval (Pro) →
- Mortgage (P&I)
- −$939
- Tax from tax record
- −$145 /mo · $1,740/yr
- Insurance
- −$75
- HOA
- −$0
- Vacancy / Maint / Mgmt
- −$287
- Net cashflow
- $-79
Break-even live
UW: 25.0% down · 7.5% · 30yr · 1.5% tax · 5.0% vac · 8.0% maint · 8.0% mgmt
Financing live
Cash to close
- Down payment
- $44,750
- Closing costs
- $5,370
- Reserves months
- —
- Total cash needed
- —
Loan-product check · same deal, 3 products live
Conventional
25% down · 7.5% · 30yr
- Down + closing
- —
- Monthly P&I
- —
- Monthly cashflow
- —
- DSCR
- —
- Eligible?
- —
Personal DTI + credit; lowest rate.
DSCR
20% down · 8.5% · 30yr
- Down + closing
- —
- Monthly P&I
- —
- Monthly cashflow
- —
- DSCR
- —
- Eligible?
- —
No personal income docs; deal must DSCR.
Hard money
10% down · 12.0% · 12mo
- Down + closing
- —
- Monthly P&I
- —
- Monthly cashflow
- —
- DSCR
- —
- Eligible?
- —
Short-term bridge; refi at stabilization.
Rent comps 2 comps
| Address | Beds | Baths | Sqft | Rent | $/sqft | DOM | Units | Dist |
|---|---|---|---|---|---|---|---|---|
| 313 S Palm Ave Frostproof, FL | 3.0 | 1.0 | 896 | $1,300 | $1.45 | 14d | 1 | 0.51mi |
| 120 Chesney Blvd Frostproof, FL | 3.0 | 2.0 | 944 | $1,495 | $1.58 | 3d | 1 | 0.98mi |
Listing history 11 events
-
2026-06-18days on market $179,000 Active 15 DOM
-
2026-06-17days on market $179,000 Active 14 DOM
-
2026-06-16days on market $179,000 Active 13 DOM
-
2026-06-15days on market $179,000 Active 12 DOM
-
2026-06-13days on market $179,000 Active 10 DOM
-
2026-06-10days on market $179,000 Active 7 DOM
-
2026-06-09days on market $179,000 Active 6 DOM
-
2026-06-08days on market $179,000 Active 5 DOM
-
2026-06-07days on market $179,000 Active 4 DOM
-
2026-06-05remarks 687-char remark
-
2026-06-05$179,000 Active 1 DOM
ⓘ Source: listings_history table (triggers on properties + properties_extension) + one-shot
backfill from property_details.listing_events for pre-trigger history.
Tax reassessment forecast FL · Resets to sale price
- Current annual tax
- $1,740 · $145/mo
- Projected year-2 tax
- $1,740 · $145/mo
- Expected delta
- $0/yr ($0/mo · 0.0%)
ⓘ Screening estimate from a state-policy table — verify with the county assessor before closing.
Climate risk First Street
- Flood 1/10 Low FEMA zone X (unshaded) · 0% chance over 30 yrs
- Wildfire 3/10 Moderate
- Heat 8/10 Severe 7 d/yr ≥108°F today · 24 d/yr by 30 yrs out
- Wind 9/10 Extreme 99% chance of damaging wind over 30 yrs
- Air quality 2/10 Low 0 unhealthy d/yr today · 2 by 30 yrs out
Nearby sold comps map
Loading sold comps map…
Walkable amenities ~0.75 mi
Loading nearby amenities…
Taxation est. · year 1
- Rental income
- $16,400
- − Mortgage interest
- −$10,027
- − Property taxes
- −$1,740
- − Insurance
- −$895
- − Repairs & maintenance
- −$1,312
- − Management
- −$1,312
- − Depreciation
- −$5,207
- Taxable loss
- −$4,094
- Est. tax savings @ 24.0%
- +$982
- After-tax cash flow
- $39/yr
For passive investors: Depreciation is non-cash, so a rental often shows a tax loss while cash-flowing — sheltering income. Rental losses are passive: they offset passive income freely, and up to $25,000/yr can offset ordinary (W-2) income if you actively participate and your MAGI is under $100k (phasing out to $0 by $150k); unused losses carry forward. On sale, claimed depreciation is recaptured at up to 25%, and gains may owe capital-gains tax (a 1031 exchange can defer both). Figures are a year-1 estimate at your 24.0% rate — not tax advice; consult a CPA.
Schools (NCES district)
- District
- Polk
- NCES district ID
- 1201590
- Math proficiency
- 39% ▼ -11.00%
- Reading proficiency
- 43% ▼ -4.00%
- Median HH income
- $43,979
- Composite
- 34.74/100
- National rank
- #5132
- State rank
- #62 of 73 in FL
Livability — Frostproof
- Score
- 69/100
- State rank
- #456
- US rank
- #8297
Category grades
Schools grade is shown separately in the Schools card above.
Census & demographics
- Census place
- Frostproof, FL
- Population (ZIP)
- 11,072
Population outlook (Polk County) Hauer SSP2
- Today (2025)
- 752,975 people
- By 2030
- 804,621 · +6.9%
- By 2040
- 906,117 · +20.3%
- By 2050
- 1,000,476 · +32.9%
- By 2075
- 1,197,520 · +59.0%
- By 2100
- 1,271,518 · +68.9%
Race, ethnicity, and origin ACS 2023
- Neighborhood character
- Majority White (65%)
- Race & ethnicity
- White 65% Hispanic / Latino 24% Two or more races 14% Black 8%
- Hispanic origin (detail)
- Mexican 12% Puerto Rican 9% Cuban 2%
- Common ancestry
- Slovak 3% Italian 1% Romanian 1%
- Foreign-born
- 8% · Canada, Jamaica
- Languages at home
- 78% English-only · Spanish 20%
Political lean MEDSL · Polk
- 2024 margin
- Strong R (+20.7) · D 39.2% · R 59.9%
- 2008→2024 swing
- -14.6pp toward R · 2008: -6.1pp · 2024: -20.7pp
- All cycles
- 2024: R+20.7 2020: R+14.4 2016: R+14.1 2012: R+6.8 2008: R+6.1
Not yet ingested
- Civics
- —
Market trends
- HPI YoY
- ▼ -0.67%
- Current HPI
- 311.1519
- Rent YoY
- —
- Metro
- —
- State GDP YoY
- ▲ 3.28%
- F500 in state
- 36
Industry mix (Fortune 500 HQ in FL)
| Industry | F500 HQs | Revenue |
|---|---|---|
| Industrial Technology | 2 | $29B |
|
||
| Insurance | 2 | $17B |
|
||
| Retail | 1 | $60B |
|
||
| Technology Distribution | 1 | $58B |
|
||
| Homebuilding | 1 | $35B |
|
||
| Technology Manufacturing | 1 | $35B |
|
||
Price history
+1527.3% since first listed8 events — show timeline
- 2026-06-03 Listed $179,000 Stellar MLS as Distributed by MLS Grid
- 2021-07-08 Sold (Public Records) $128,900 Public Records
- 2021-06-25 Sold (MLS) $128,900 Stellar MLS as Distributed by MLS Grid
- 2021-05-14 Pending — Stellar MLS as Distributed by MLS Grid
- 2021-05-12 Listed $128,900 Stellar MLS as Distributed by MLS Grid
- 2007-08-10 Sold (Public Records) $85,000 Public Records
- 1983-10-01 Sold (Public Records) $17,000 Public Records
- 1977-12-01 Sold (Public Records) $11,000 Public Records
Property tax history
+14.8%/yrLatest (2025): $1,740 · +3.3% YoY. Source: county tax records.
Cash-flow waterfall
monthlySold comps — $/sqft
last 12 mo · ≤1 miLoading sold comps…