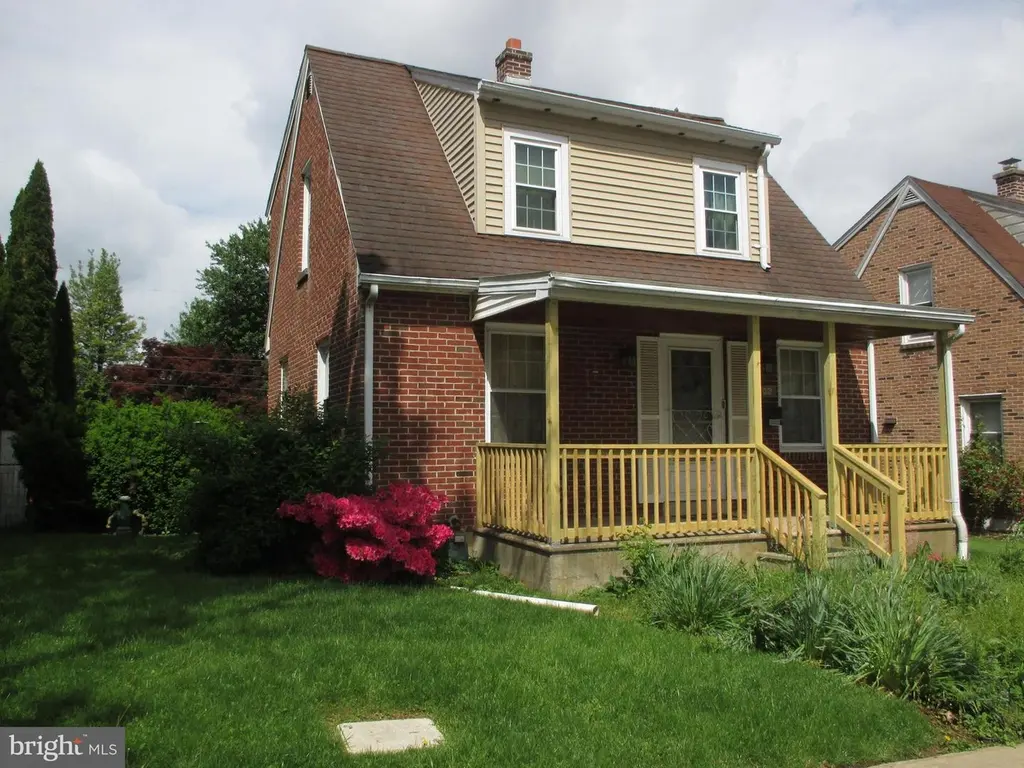
988 Midland Ave · Valley View, PA
Flood risk 1/10 · Minimal
- FEMA flood zone
- X (unshaded)
- Chance of flooding over 30 yrs
- 0.0%
- Est. flood insurance / yr
- $473 – $860
Fire risk 1/10 · Minimal
- Est. fire insurance / yr
- $511 – $949
Heat risk 5/10 · Moderate
- Hot days now (above 102°F)
- 7 days/yr
- Hot days in 30 yrs
- 14 days/yr
Wind risk 4/10 · Minor
- Chance of severe wind over 30 yrs
- 11.0%
Air-quality risk 3/10 · Minor
- Unhealthy air days now
- 3 days/yr
- Unhealthy air days in 30 yrs
- 5 days/yr
Risk factors via First Street. Map © Google.
Why this score? — see what drove the D grade
The composite is a weighted blend of 9 inputs, each scored 0–100. Each bar is that input's sub-score; the figure is the points it added to the 100-point composite (weight × sub-score).
- ARV discount +15.0/15.0
- Cash flow +7.8/30.0
- Schools +5.3/10.0
- Livability +4.2/5.0
- Rent growth +3.6/5.0
- 1% rule +2.9/10.0
- Condition / age +2.5/5.0
- DSCR +1.9/10.0
- Appreciation +0.0/10.0
$174,900
🖨 Deal sheet (PDF) 📄 Offer letter ✓ Due diligence
Listing remarks MLS
DELIGHTFUL ALL BRICK POST WAR CAPE COD IN MT ROSE. THIS COZY 2 BR HOME BOASTS HW FLRS, NEW ROOF, NEWER FURNACE/WTR HTR & CENTRAL A/C. HOME IS BEING SOLD FULLY FURNISHED~ALL CONTENTS IN HOME CONVEY TO BUYER. SEE ASSOCIATED TWP DOC REGARDING REQUIRED SIDEWALK REPAIR TO BE COMPLETED BY BUYER BY 7-1-09.
Key facts
- 4,600 sq ft lot
- Built 1947
- Listed 3 days
Property features AI
Finance
- Other: Not in a federal flood zone; Ground rent and front foot fee paid annually
Exterior
- Parking: On-street parking
- Utilities: Public water; Public sewer; Natural gas available; 100 amp electric service with circuit breakers; Cable internet/TV available; Phone service; Municipal trash service
- Home design: Detached property; Fee simple ownership; Average condition
- Construction: Built with aluminum siding, block, concrete, brick, stick built components, and vinyl siding; Block foundation; Asphalt shingle roof (architectural shingle)
- Exterior features: Cleared, level lot with rear yard; Porch(es) and deck(s); Shed
Interior
- Kitchen: Refrigerator; Stove
- Bedrooms: Two bedrooms on the upper level
- Flooring: Solid hardwood and wood flooring
- Bathrooms: One full bathroom
- Heating & cooling: Natural gas forced air heating (90% efficiency); Central air conditioning
- Interior features: Plaster walls; Tub shower; Formal separate dining room; Galley kitchen; Wood floors
- Laundry & utility: Washer and dryer in the basement; Natural gas water heater
Neighborhood map
What this means for you Summary
Snapshot
- This is a 2-bed/1.0-bath single-family listed at $175k.
Deal economics
- At list price, monthly cash flow is $-196 ($-2k/yr) — negative.
- To cash-flow at today's rent, offer at most $140k (19.8% below list).
- To meet the 1% rule (rent ≥ 1% of price), the offer needs to be $138k (20.8% below list).
- Recommended offer: $138k (20.8% below list) — sets the bar for 1% rule.
Location & tenants
- Location reads 85/100 on livability (#67 in PA, #467 nationally) — a professional / high-income tenant draw. Strengths: crime A+, cost of living A+, housing A+; Watch: amenities D+.
- York Suburban SD (suburban): math 50% / reading 71% proficiency, ranked #65 of 539 in PA (top 12%) — acceptable for families but not a draw, mixed tenant base, ~2y average lease.
- Zoned schools: Valley View El Sch (321 students, 38% FRL); York Suburban Ms (math 30% / reading 63%, grade D+, #172 of 512 statewide, top 35%, 713 students, 40% FRL); York Suburban Shs (math 85% / reading 82%, grade A, #12 of 437 statewide, top 3%, 873 students, 36% FRL).
- Market conditions: Rents rising fast (+4.4%/yr); 223 active listings in the ZIP; 18 comparable units currently listed for rent nearby; rentals at typical pace (median 23d on market — plan ~3-4 weeks tenant-placement turnaround); 44% of comp listings sitting > 30 days — soft ceiling on asking rent; solid renter incomes; 1,328 units permitted in York County in 2024 (338 in 5+ unit buildings).
Forward outlook
- Local home prices are declining (-3.0%/yr); year-one equity from $1k of loan paydown is wiped out by about $5k of value loss. Plan a longer hold.
Negotiation context
- Only 3 days on market — expect competitive offers; lowballing is unlikely to land.
- 2 sale attempts since 18y ago with the ask held roughly flat each time — persistent listings suggest the price (not the market) is what's stuck; bring a comps-based counter.
- Current owner paid $120k; 46% above their basis — modest negotiation headroom, anchor on the comps not their cost.
Risks & watch-outs
- Watch-outs: built in 1947 — expect roof / HVAC / electrical / plumbing capex.
- Climate carrying-cost: extreme-heat days projected 7→14/yr by 2055 (HVAC capex compounding) — expect insurance premiums to compound above CPI over the hold.
Questions for the listing agent
- What do current leases actually rent for vs. the listed asking? Can we see a recent rent roll and the last 12 months of T-12 income?
- Built in 1947 — when were the roof, HVAC, electrical panel, plumbing, and water heater last replaced?
- Is there a deadline driving the sale (1031 exchange, divorce, estate, relocation)? That informs how much negotiation room exists.
- Schools are B-rated — typically a magnet for longer-tenancy family renters. What's the average tenant stay here, and is there a school-zone premium baked into asking?
- The area grade is low — what's the realistic commute time and amenity access for the typical tenant pool here? Any planned neighborhood developments (good or bad) we should know about?
- What's the average days-on-market for RENTAL listings here right now (not sales)? A rising rental-DOM trend means longer vacancies and softer asking-rent achievability than the comps imply.
- What's the recent tenant-quality profile in this submarket — average credit score on applications, eviction rate, late-payment / NSF rate, and stable-employment percentage? A property-management company in the area should have these aggregated.
- How much new for-sale + rental construction is in the pipeline within 1–3 miles? Heavy new supply typically softens prices + rents 12–24 months out; constrained supply supports both.
Investment metrics
- 1% rule
- 0.79% ✗
- Cap rate
- 4.95%
- Cash-on-cash
- -4.80%
- DSCR
- 0.79
- GRM
- 10.5
CMA / ARV
- ARV (median comp)
- $222,254
- List price
- $174,900
- Delta
- -21.31%
- Verdict
- UNDERPRICED
- Comps
- 20 within 1.0 mi
Show comp detail 12 sales within ~0.75 mi
| Address | Dist | Beds/Ba | Sqft | Sold | Price | $/sf | Match |
|---|---|---|---|---|---|---|---|
| 1037 Lancaster Ave | 0.10mi | 3/1.0 (+1) | 1,034 (-2%) | 8mo | $200,000 | $193 | 81 |
| 1305 Lancaster Ave | 0.35mi | 3/1.0 (+1) | 1,050 (-1%) | 6mo | $230,000 | $219 | 73 |
| 1262 S Albemarle St | 0.31mi | 3/2.0 (+1) | 1,128 (+7%) | 4mo | $225,000 | $199 | 62 |
| 766 Clearmount Rd | 0.44mi | 3/1.0 (+1) | 1,025 (-3%) | 10mo | $255,000 | $249 | 61 |
| 1212 E Jackson St | 0.17mi | 2/1.0 | 908 (-14%) | 11mo | $153,000 | $169 | 60 |
| 722 Lancaster Ave | 0.22mi | 3/1.0 (+1) | 1,188 (+12%) | 7mo | $202,500 | $170 | 58 |
| 1140 E Prospect St | 0.44mi | 3/1.0 (+1) | 1,142 (+8%) | 13mo | $229,900 | $201 | 50 |
| 647 Wheatlyn Dr | 0.45mi | 3/2.0 (+1) | 972 (-8%) | 13mo | $230,000 | $237 | 46 |
| 844 E Boundary Ave | 0.50mi | 3/2.0 (+1) | 960 (-9%) | 12mo | $162,500 | $169 | 42 |
| 345 Simpson St | 0.72mi | 3/1.0 (+1) | 1,133 (+7%) | 9mo | $220,000 | $194 | 42 |
| 332 Springdale Rd | 0.71mi | 3/1.0 (+1) | 1,152 (+9%) | 13mo | $195,000 | $169 | 36 |
| 930 Edgar St | 0.71mi | 3/2.0 (+1) | 1,200 (+14%) | 1mo | $289,000 | $241 | 34 |
Match score weights: distance 35% · size 25% · config 20% · recency 20%. Top-matched comps best support the ARV.
Projected returns pro-forma
-3.0% appreciation · 4.43% rent growth · sell at horizon
- IRR
- -22.7%
- Equity multiple
- 0.21×
- Total profit
- $-38,728
- Equity at exit
- $26,078
- IRR
- -13.5%
- Equity multiple
- 0.16×
- Total profit
- $-40,968
- Equity at exit
- $15,122
Cash invested: $48,972 (down + closing). Projections, not guarantees.
Landlord ↔ Tenant lean methodology
- Overall (STATE)
- 62 Landlord-Friendly
- State Pennsylvania
- 62 Landlord-Friendly · EVEN
- County
- — inherits STATE
- City
- — inherits STATE
ZIP-level market 17403
- Home prices YoY
- -26.9%
- Rents YoY
- 4.4%
- Active inventory
- 223
- Price-to-rent
- 10.5×
Monthly cashflow live
- Estimated rent
- $1,384 high interval (Pro) →
- Mortgage (P&I)
- −$917
- Tax from tax record
- −$299 /mo · $3,594/yr
- Insurance
- −$73
- HOA
- −$0
- Vacancy / Maint / Mgmt
- −$291
- Net cashflow
- $-196
Break-even live
Sensitivity live
| Price | -10% $-97 | -5% $-146 | +0% $-196 | +5% $-245 | +10% $-295 |
|---|---|---|---|---|---|
| Rent | -10% $-305 | -5% $-251 | +0% $-196 | +5% $-141 | +10% $-87 |
| Rate | -1.0pp $-108 | -0.5pp $-151 | base $-196 | +0.5pp $-241 | +1.0pp $-287 |
UW: 25.0% down · 7.5% · 30yr · 1.5% tax · 5.0% vac · 8.0% maint · 8.0% mgmt
Financing live
Cash to close
- Down payment
- $43,725
- Closing costs
- $5,247
- Reserves months
- —
- Total cash needed
- —
Loan-product check · same deal, 3 products live
Conventional
25% down · 7.5% · 30yr
- Down + closing
- —
- Monthly P&I
- —
- Monthly cashflow
- —
- DSCR
- —
- Eligible?
- —
Personal DTI + credit; lowest rate.
DSCR
20% down · 8.5% · 30yr
- Down + closing
- —
- Monthly P&I
- —
- Monthly cashflow
- —
- DSCR
- —
- Eligible?
- —
No personal income docs; deal must DSCR.
Hard money
10% down · 12.0% · 12mo
- Down + closing
- —
- Monthly P&I
- —
- Monthly cashflow
- —
- DSCR
- —
- Eligible?
- —
Short-term bridge; refi at stabilization.
Rent comps 18 comps
| Address | Beds | Baths | Sqft | Rent | $/sqft | DOM | Units | Dist |
|---|---|---|---|---|---|---|---|---|
| 549 Lancaster Ave York, PA | 3.0 | 1.0 | 1458 | $1,875 | $1.29 | 45d | 1 | 0.39mi |
| 715 Vander Ave York, PA | 3.0 | 1.0 | 1180 | $1,295 | $1.10 | 15d | 1 | 0.75mi |
| 516 E Boundary Ave York, PA | 2.0 | 1.0 | 1128 | $1,200 | $1.06 | 15d | 1 | 0.76mi |
| 728 E Princess St Apt 3 York, PA | 2.0 | 1.0 | 822 | $995 | $1.21 | 45d | 1 | 0.87mi |
| 1505 3rd Ave York, PA | 3.0 | 1.5 | 1408 | $1,800 | $1.28 | 15d | 1 | 0.90mi |
| 1538 1st Ave Unit 2 York, PA | 3.0 | 2.0 | 1500 | $1,900 | $1.27 | 15d | 1 | 1.01mi |
| 1027 E Market St Unit 2 York, PA | 2.0 | 1.0 | 1145 | $1,095 | $0.96 | 15d | 1 | 1.12mi |
| 606 E Market St Unit 1STFLRREAR York, PA | 2.0 | 1.0 | 700 | $925 | $1.32 | 15d | 1 | 1.13mi |
| 208 Liberty Ct York, PA | 3.0 | 1.0 | 1096 | $1,195 | $1.09 | 45d | 1 | 1.14mi |
| 30 N Franklin St York, PA | 3.0 | 1.0 | 1400 | $1,395 | $1.00 | 45d | 1 | 1.17mi |
| 40 N Tremont St #2 York, PA | 3.0 | 1.0 | 900 | $1,500 | $1.67 | 45d | 1 | 1.17mi |
| 514 S Duke St York, PA | 3.0 | 1.0 | 1289 | $1,625 | $1.26 | 23d | 1 | 1.18mi |
| 443 S Duke St York, PA | 3.0 | 1.0 | 1028 | $1,225 | $1.19 | 45d | 1 | 1.19mi |
| 2000 Maplewood Dr York, PA | 1.0–2.0 | 1.0 | 749 | $1,590 | $2.12 | 15d | 18 | 1.19mi |
| 444 S Duke St York, PA | 3.0 | 1.0 | 1200 | $1,200 | $1.00 | 45d | 1 | 1.20mi |
| 347 E King St Unit 1 York, PA | 1.0 | 1.0 | 800 | $1,000 | $1.25 | 45d | 1 | 1.20mi |
| 100 Bridlewood Way York, PA | 1.0–2.0 | 1.0–2.0 | 1100 | $1,804 | $1.64 | 15d | 8 | 1.27mi |
| 446 Wallace St York, PA | 3.0 | 1.0 | 1092 | $1,295 | $1.19 | 23d | 1 | 1.38mi |
Listing history 9 events
-
2026-06-05statusdays on market $174,900 Pending 3 DOM
-
2026-06-02days on market $174,900 Active 2 DOM
-
2026-06-01statusdays on market $174,900 Active 1 DOM
-
2026-05-31days on market $174,900 Coming Soon 16 DOM
-
2026-05-30days on market $174,900 Coming Soon 15 DOM
-
2026-05-15historical $174,900 537-char remark
-
2008-08-05soldstatus $120,000
-
2008-07-31soldstatus $120,000 306-char remark
Show marketing remark (306 chars)
DELIGHTFUL ALL BRICK POST WAR CAPE COD IN MT ROSE. THIS COZY 2 BR HOME BOASTS HW FLRS, NEW ROOF, NEWER FURNACE/WTR HTR & CENTRAL A/C. HOME IS BEING SOLD FULLY FURNISHED~ALL CONTENTS IN HOME CONVEY TO BUYER. SEE ASSOCIATED TWP DOC REGARDING REQUIRED SIDEWALK REPAIR TO BE COMPLETED BY BUYER BY 7-1-09.
-
2008-06-16$119,900 306-char remark
Show marketing remark (306 chars)
DELIGHTFUL ALL BRICK POST WAR CAPE COD IN MT ROSE. THIS COZY 2 BR HOME BOASTS HW FLRS, NEW ROOF, NEWER FURNACE/WTR HTR & CENTRAL A/C. HOME IS BEING SOLD FULLY FURNISHED~ALL CONTENTS IN HOME CONVEY TO BUYER. SEE ASSOCIATED TWP DOC REGARDING REQUIRED SIDEWALK REPAIR TO BE COMPLETED BY BUYER BY 7-1-09.
ⓘ Source: listings_history table (triggers on properties + properties_extension) + one-shot
backfill from property_details.listing_events for pre-trigger history.
Tax reassessment forecast PA · Partial reset (capped growth)
- Current annual tax
- $3,594 · $299/mo
- Projected year-2 tax
- $3,594 · $299/mo
- Expected delta
- $0/yr ($0/mo · 0.0%)
ⓘ Screening estimate from a state-policy table — verify with the county assessor before closing.
Climate risk First Street
- Flood 1/10 Low FEMA zone X (unshaded) · 0% chance over 30 yrs
- Wildfire 1/10 Low
- Heat 5/10 Major 7 d/yr ≥102°F today · 14 d/yr by 30 yrs out
- Wind 4/10 Moderate 11% chance of damaging wind over 30 yrs
- Air quality 3/10 Moderate 3 unhealthy d/yr today · 5 by 30 yrs out
Nearby sold comps map
Loading sold comps map…
Walkable amenities ~0.75 mi
Loading nearby amenities…
Taxation est. · year 1
- Rental income
- $16,612
- − Mortgage interest
- −$9,797
- − Property taxes
- −$3,594
- − Insurance
- −$874
- − Repairs & maintenance
- −$1,329
- − Management
- −$1,329
- − Depreciation
- −$5,088
- Taxable loss
- −$5,399
- Est. tax savings @ 24.0%
- +$1,296
- After-tax cash flow
- $-1,055/yr
For passive investors: Depreciation is non-cash, so a rental often shows a tax loss while cash-flowing — sheltering income. Rental losses are passive: they offset passive income freely, and up to $25,000/yr can offset ordinary (W-2) income if you actively participate and your MAGI is under $100k (phasing out to $0 by $150k); unused losses carry forward. On sale, claimed depreciation is recaptured at up to 25%, and gains may owe capital-gains tax (a 1031 exchange can defer both). Figures are a year-1 estimate at your 24.0% rate — not tax advice; consult a CPA.
Schools (NCES district)
- District
- York Suburban SD
- NCES district ID
- 4226850
- Math proficiency
- 50% ▼ -9.00%
- Reading proficiency
- 71% ▼ -7.00%
- Median HH income
- $64,375
- Composite
- 52.78/100
- National rank
- #1541
- State rank
- #65 of 539 in PA
Livability — Valley View
- Score
- 85/100
- State rank
- #67
- US rank
- #467
Category grades
Schools grade is shown separately in the Schools card above.
Census & demographics
- Census place
- Valley View, PA
- County
- York County · 278,806 people
- City population
- 1,529
- Metro
- York-Hanover, PA
- Population (ZIP)
- 40,287
- Household income
- $75,384
- Rent vs Own
- Severe rent burden
- 1305.0
Population outlook (York County) Hauer SSP2
- Today (2025)
- 454,205 people
- By 2030
- 457,407 · +0.7%
- By 2040
- 457,529 · +0.7%
- By 2050
- 448,261 · -1.3%
- By 2075
- 427,388 · -5.9%
- By 2100
- 384,218 · -15.4%
Race, ethnicity, and origin ACS 2023
- Neighborhood character
- Diverse neighborhood (Simpson 0.58)
- Race & ethnicity
- White 60% Hispanic / Latino 20% Black 12% Two or more races 9% Asian 3%
- Hispanic origin (detail)
- Mexican 3% Puerto Rican 10% Dominican 3%
- Common ancestry
- Romanian 3% Lithuanian 1% Slovak 1%
- Foreign-born
- 10% · Canada, Vietnam, Jamaica
- Languages at home
- 81% English-only · Spanish 14% Other Indo-European 1% Arabic 1%
Political lean MEDSL · York
- 2024 margin
- Strong R (+25.3) · D 36.9% · R 62.1%
- 2008→2024 swing
- -11.7pp toward R · 2008: -13.6pp · 2024: -25.3pp
- All cycles
- 2024: R+25.3 2020: R+24.6 2016: R+29.3 2012: R+21.2 2008: R+13.6
Not yet ingested
- Civics
- —
Market trends
- HPI YoY
- ▼ -104.51%
- Current HPI
- 284.0731
- Rent YoY
- ▲ 4.43%
- Metro
- York-Hanover, PA
- State GDP YoY
- ▲ 1.68%
- F500 in state
- 34
Industry mix (Fortune 500 HQ in PA)
| Industry | F500 HQs | Revenue |
|---|---|---|
| Healthcare | 2 | $309B |
|
||
| Insurance | 2 | $27B |
|
||
| Telecommunications / Media | 1 | $124B |
|
||
| Industrial Distribution | 1 | $22B |
|
||
| Financial Services | 1 | $20B |
|
||
| Chemicals / Materials | 1 | $18B |
|
||
Price history
+45.9% since first listed6 events — show timeline
- 2026-06-03 Pending — BRIGHT MLS
- 2026-06-01 Listed $174,900 BRIGHT MLS
- 2026-05-15 Coming Soon $174,900 BRIGHT MLS
- 2008-08-05 Sold (Public Records) $120,000 Public Records
- 2008-07-31 Sold (MLS) $120,000 BRIGHT MLS
- 2008-06-16 Listed $119,900 BRIGHT MLS
Property tax history
+3.0%/yrLatest (2026): $3,594 · +5.6% YoY. Source: county tax records.
Cash-flow waterfall
monthlySold comps — $/sqft
last 12 mo · ≤1 miLoading sold comps…