 🌊 Lakefront
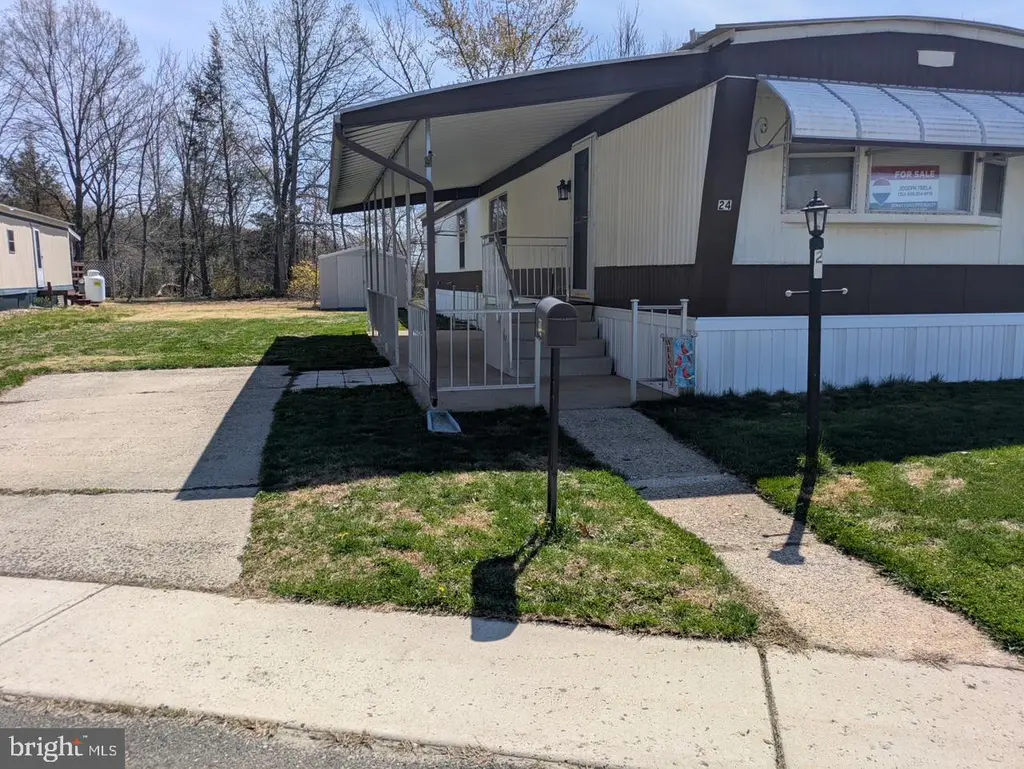
24 Lakeshore Dr · Pemberton, NJ
Flood risk No data
- FEMA flood zone
- —
- Chance of flooding over 30 yrs
- —
- Est. flood insurance / yr
- —
Fire risk No data
- Est. fire insurance / yr
- —
Heat risk No data
- Hot days now (above threshold)
- —
- Hot days in 30 yrs
- —
Wind risk No data
- Chance of severe wind over 30 yrs
- —
Air-quality risk No data
- Unhealthy air days now
- —
- Unhealthy air days in 30 yrs
- —
Risk factors via First Street. Map © Google.
Why this score? — see what drove the B grade
The composite is a weighted blend of 9 inputs, each scored 0–100. Each bar is that input's sub-score; the figure is the points it added to the 100-point composite (weight × sub-score).
- Cash flow +30.0/30.0
- 1% rule +10.0/10.0
- DSCR +10.0/10.0
- ARV discount +9.3/15.0
- Schools +4.5/10.0
- Livability +3.6/5.0
- Rent growth +2.5/5.0
- Condition / age +2.2/5.0
- Appreciation +0.0/10.0
$79,900
🖨 Deal sheet 📄 Offer letter ✓ Due diligence
Listing remarks
LAKEFRONT Lot!!! - An extra spacious 2 Bedroom home which is situated on one of the premier lots in the development, backing to the lake. Not your ordinary mobile home. This unit has been upgraded to include a wide-open floor plan, custom built kitchen island for entertaining, central air conditioning, unique light and ceiling fan comb's, some of the furniture and gigantic tv are available for sale with the home, large shed for storage and a covered patio for relaxing. Sure to sell quickly! Call to schedule your showing today.
Key facts
- Covered porch
- Lakefront view
- Nice sized shed
Tags
Property features AI
Finance
- HOA & community: Located in the Mobile Estates park
Exterior
- Parking: Driveway parking
- Utilities: Public water; Public sewer; Propane service; Electric hot water
- Home design: Manufactured single-wide home; Above-grade living space
- Construction: Metal siding; Estimated year built
- Exterior features: Water view; Shed
Interior
- Kitchen: Eat-in kitchen
- Bedrooms: Two bedrooms on the main level
- Bathrooms: One full bathroom on the main level
- Heating & cooling: Forced air heating; Central air conditioning
- Interior features: Ceiling fans; Eat-in kitchen
- Laundry & utility: Washer and dryer on the main floor
Neighborhood map
What this means for you Summary
Snapshot
- This is a 2-bed/1.0-bath single-family listed at $80k. Condition is rated fair.
Deal economics
- At list price, monthly cash flow is $1k ($14k/yr) — positive.
- The deal already cash-flows at list — no discount required.
- Meets the 1% rule at list price ($2k rent vs $80k).
- Recommended offer: $79k (1.5% below list) — sets the bar for market timing.
- Cap rate 24.3% vs local median 4.9% in Pemberton — top-decile yield for the area; either an underpriced asset or a hidden risk that comps aren't pricing in. Stress-test before assuming the spread holds.
Location & tenants
- Location reads 72/100 on livability (#217 in NJ) — a middle-class / working-renter tenant base. Strengths: crime A+, housing A+, health & safety A+; Watch: cost of living C-, schools D-, amenities F.
- Lenape Regional High School District (suburban): math 34% / reading 60% proficiency, ranked #136 of 472 in NJ (top 29%) — families likely to look elsewhere, expect single-tenant / working-renter base with shorter leases.
- Market conditions: 156 active listings in the ZIP; 2,161 units permitted in Burlington County in 2024 (988 in 5+ unit buildings).
Forward outlook
- Local home prices are declining (-3.0%/yr); year-one equity from $552 of loan paydown is wiped out by about $2k of value loss. Plan a longer hold.
- Burlington County population projected to shrink 5% by 2050 — rents likely to lag national; underwrite the cash flow, not the appreciation.
- At projected returns (-3.0% appreciation + 3.0% rent growth), your $22k cash investment doubles in ~2 years — after that, you're playing with house money.
Negotiation context
- It's been on market 27 days — a 2% lower offer ($79k) is reasonable based on typical stale-listing flexibility.
Questions for the listing agent
- Have any recent inspections been done? Can we get a copy of the seller's disclosures and any deferred-maintenance estimates?
- Is there a deadline driving the sale (1031 exchange, divorce, estate, relocation)? That informs how much negotiation room exists.
- Schools are D-rated, which usually means shorter tenancies and higher turnover. Who's the typical renter profile here, and what's been the actual vacancy rate?
- This sits on a lake — are riparian / water-frontage rights deeded with the parcel? Any dock permits, shoreline easements, or HOA water-use restrictions?
- What's the documented flood / surge / shoreline-erosion history here (FEMA AND non-FEMA — e.g., storm surge, creek backup, septic-field saturation)?
- Any water-quality or seasonal algae-bloom issues that affect tenant satisfaction or short-term-rental demand?
- What's the average days-on-market for RENTAL listings here right now (not sales)? A rising rental-DOM trend means longer vacancies and softer asking-rent achievability than the comps imply.
- What's the recent tenant-quality profile in this submarket — average credit score on applications, eviction rate, late-payment / NSF rate, and stable-employment percentage? A property-management company in the area should have these aggregated.
- How much new for-sale + rental construction is in the pipeline within 1–3 miles? Heavy new supply typically softens prices + rents 12–24 months out; constrained supply supports both.
Investment metrics
- 1% rule
- 2.77% ✓
- Cap rate
- 24.29%
- Cash-on-cash
- 64.27%
- DSCR
- 3.86
- GRM
- 3.0
CMA / ARV
- ARV (on-the-fly)
- $83,160
- Comps found
- 12
Show comp detail 12 sales within ~0.75 mi
| Address | Dist | Beds/Ba | Sqft | Sold | Price | $/sf | Match |
|---|---|---|---|---|---|---|---|
| 24 Lakeshore Dr | 0.00mi | 2/1.0 | 990 (0%) | 1mo | $69,000 | $70 | 99 |
| 23 Winding Way | 0.08mi | 2/1.0 | 980 (-1%) | 11mo | $82,000 | $84 | 86 |
| 59 Estates Dr | 0.17mi | 3/1.5 (+1) | 980 (-1%) | 5mo | $67,000 | $68 | 79 |
| 55 James Ave | 0.13mi | 2/2.0 | 924 (-7%) | 8mo | $84,000 | $91 | 72 |
| 23 Sunset Blvd | 0.20mi | 2/2.0 | 980 (-1%) | 16mo | $55,000 | $56 | 72 |
| 12 Sunset Blvd | 0.14mi | 2/2.0 | 980 (-1%) | 20mo | $62,500 | $64 | 71 |
| 19 Sunset Blvd | 0.18mi | 3/2.0 (+1) | 924 (-7%) | 8mo | $55,000 | $60 | 65 |
| 51 James Ave | 0.12mi | 2/2.0 | 924 (-7%) | 20mo | $65,000 | $70 | 63 |
| 58 Estates Dr | 0.16mi | 2/1.0 | 896 (-10%) | 17mo | $75,000 | $84 | 62 |
| 2409 Route 206 | 0.49mi | 2/1.0 | 930 (-6%) | 10mo | $300,000 | $323 | 59 |
| 824 Crystal Ave | 0.53mi | 2/1.5 | 1,064 (+8%) | 16mo | $325,000 | $305 | 48 |
| 725 Lenz Ave | 0.73mi | 2/1.0 | 1,014 (+2%) | 20mo | $315,000 | $311 | 45 |
Match score weights: distance 35% · size 25% · config 20% · recency 20%. Top-matched comps best support the ARV.
Projected returns pro-forma
-3.0% appreciation · 3.0% rent growth · sell at horizon
- IRR
- 63.4%
- Equity multiple
- 3.83×
- Total profit
- $63,397
- Equity at exit
- $11,913
- IRR
- 67.8%
- Equity multiple
- 7.87×
- Total profit
- $153,604
- Equity at exit
- $6,908
Cash invested: $22,372 (down + closing). Projections, not guarantees.
Landlord ↔ Tenant lean methodology
- Overall (STATE)
- 21 Tenant-Leaning
- State New Jersey
- 21 Tenant-Leaning · D+6
- County
- — inherits STATE
- City
- — inherits STATE
ZIP-level market 08088
- Active inventory
- 156
- Price-to-rent
- 3.0×
Monthly cashflow live
- Estimated rent
- $2,216 medium interval (Pro) →
- Mortgage (P&I)
- −$419
- Tax est. 1.5%
- −$100 /mo · $1,198/yr
- Insurance
- −$33
- HOA
- −$0
- Vacancy / Maint / Mgmt
- −$465
- Net cashflow
- $1,198
Break-even live
UW: 25.0% down · 7.5% · 30yr · 1.5% tax · 5.0% vac · 8.0% maint · 8.0% mgmt
Financing live
Cash to close
- Down payment
- $19,975
- Closing costs
- $2,397
- Reserves months
- —
- Total cash needed
- —
Loan-product check · same deal, 3 products live
Conventional
25% down · 7.5% · 30yr
- Down + closing
- —
- Monthly P&I
- —
- Monthly cashflow
- —
- DSCR
- —
- Eligible?
- —
Personal DTI + credit; lowest rate.
DSCR
20% down · 8.5% · 30yr
- Down + closing
- —
- Monthly P&I
- —
- Monthly cashflow
- —
- DSCR
- —
- Eligible?
- —
No personal income docs; deal must DSCR.
Hard money
10% down · 12.0% · 12mo
- Down + closing
- —
- Monthly P&I
- —
- Monthly cashflow
- —
- DSCR
- —
- Eligible?
- —
Short-term bridge; refi at stabilization.
Listing history 2 events
-
2026-05-07status Pending
-
2026-04-10$79,900 Active
ⓘ Source: listings_history table (triggers on properties + properties_extension) + one-shot
backfill from property_details.listing_events for pre-trigger history.
Nearby sold comps map
Loading sold comps map…
Walkable amenities ~0.75 mi
Loading nearby amenities…
Taxation est. · year 1
- Rental income
- $26,587
- − Mortgage interest
- −$4,476
- − Property taxes
- −$1,198
- − Insurance
- −$400
- − Repairs & maintenance
- −$2,127
- − Management
- −$2,127
- − Depreciation
- −$2,324
- Taxable income
- $13,935
- Est. tax owed @ 24.0%
- −$3,344
- After-tax cash flow
- $11,033/yr
For passive investors: Depreciation is non-cash, so a rental often shows a tax loss while cash-flowing — sheltering income. Rental losses are passive: they offset passive income freely, and up to $25,000/yr can offset ordinary (W-2) income if you actively participate and your MAGI is under $100k (phasing out to $0 by $150k); unused losses carry forward. On sale, claimed depreciation is recaptured at up to 25%, and gains may owe capital-gains tax (a 1031 exchange can defer both). Figures are a year-1 estimate at your 24.0% rate — not tax advice; consult a CPA.
Condition & rehab AI · 13 photos
A moderately rehabbed mobile home with average condition, requiring minor repairs and maintenance. Upgrades in landscaping, painting, and HVAC maintenance would significantly enhance its value.
Repairs flagged
- Minor Landscaping — Overgrown areas need trimming
- Minor Exterior paint — Paint appears faded in some areas
Value-add opportunities
- Both Painting exterior and interior — Fresh paint enhances curb appeal and interior aesthetics
- Both Landscaping improvements — Well-maintained landscaping increases curb appeal and property value
- Both HVAC maintenance — Regular maintenance ensures system efficiency and reduces energy costs
Renovation cost estimate screening
| Repair item | Severity | Est. cost |
|---|---|---|
| Landscaping · Overgrown areas need trimming | Minor | $500–3,000 |
| Exterior paint · Paint appears faded in some areas | Minor | $500–3,000 |
| Total estimated repair cost · 2 items | $1,000–6,000 |
Value-add ROI direction
- Both Painting exterior and interior — Fresh paint enhances curb appeal and interior aesthetics ↑
- Both Landscaping improvements — Well-maintained landscaping increases curb appeal and property value ↑
- Both HVAC maintenance — Regular maintenance ensures system efficiency and reduces energy costs ↑
ⓘ Cost ranges are severity-bucket heuristics (US national rule-of-thumb). Get contractor quotes + a written scope before underwriting a rehab budget.
Schools (NCES district)
- District
- Lenape Regional High School District
- NCES district ID
- 3408490
- Math proficiency
- 34% ▼ -2.00%
- Reading proficiency
- 60% ▼ -5.00%
- Median HH income
- $98,739
- Composite
- 44.86/100
- National rank
- #2724
- State rank
- #136 of 472 in NJ
Livability — Pemberton
- Score
- 72/100
- State rank
- #217
- US rank
- #6053
Category grades
Schools grade is shown separately in the Schools card above.
Census & demographics
- Population (ZIP)
- 24,153
Population outlook (Burlington County) Hauer SSP2
- Today (2025)
- 453,425 people
- By 2030
- 452,359 · -0.2%
- By 2040
- 445,033 · -1.9%
- By 2050
- 431,760 · -4.8%
- By 2075
- 406,277 · -10.4%
- By 2100
- 364,732 · -19.6%
Race, ethnicity, and origin ACS 2023
- Neighborhood character
- Predominantly White (90%)
- Race & ethnicity
- White 90% Hispanic / Latino 4% Two or more races 4% Asian 2% Black 1%
- Common ancestry
- Romanian 8% Slovak 2% Iranian 2%
- Foreign-born
- 4% · Canada, China
- Languages at home
- 94% English-only · Spanish 3% Chinese 1%
Political lean MEDSL · Burlington
- 2024 margin
- D (+16.6) · D 57.6% · R 41.0% · Other 1.3%
- 2008→2024 swing
- -2.0pp toward R · 2008: 18.6pp · 2024: 16.6pp
- All cycles
- 2024: D+16.6 2020: D+19.5 2016: D+14.8 2012: D+18.7 2008: D+18.6
Not yet ingested
- Civics
- —
Market trends
- HPI YoY
- ▼ -214.45%
- Current HPI
- 302.9094
- Rent YoY
- —
- Metro
- —
- State GDP YoY
- ▲ 2.05%
- F500 in state
- 34
Industry mix (Fortune 500 HQ in NJ)
| Industry | F500 HQs | Revenue |
|---|---|---|
| Consumer Goods | 3 | $31B |
|
||
| Pharmaceuticals | 2 | $153B |
|
||
| Technology | 2 | $21B |
|
||
| Insurance | 2 | $20B |
|
||
| Healthcare | 2 | $19B |
|
||
| Financial Services | 1 | $70B |
|
||
Price history
2 events — show timeline
- 2026-05-07 Pending — BRIGHT MLS
- 2026-04-10 Listed $79,900 BRIGHT MLS
Cash-flow waterfall
monthlySold comps — $/sqft
last 12 mo · ≤1 miLoading sold comps…