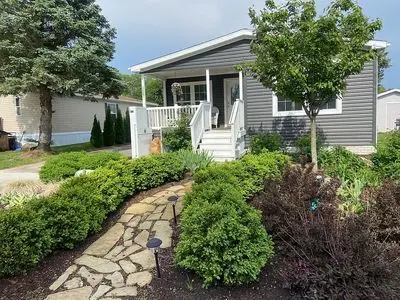
7122 Belmont Ln · Hamburg, MI
Flood risk No data
- FEMA flood zone
- —
- Chance of flooding over 30 yrs
- —
- Est. flood insurance / yr
- —
Fire risk No data
- Est. fire insurance / yr
- —
Heat risk No data
- Hot days now (above threshold)
- —
- Hot days in 30 yrs
- —
Wind risk No data
- Chance of severe wind over 30 yrs
- —
Air-quality risk No data
- Unhealthy air days now
- —
- Unhealthy air days in 30 yrs
- —
Risk factors via First Street. Map © Google.
Why this score? — see what drove the B- grade
The composite is a weighted blend of 9 inputs, each scored 0–100. Each bar is that input's sub-score; the figure is the points it added to the 100-point composite (weight × sub-score).
- Cash flow +30.0/30.0
- 1% rule +10.0/10.0
- DSCR +10.0/10.0
- ARV discount +7.5/15.0
- Schools +3.9/10.0
- Rent growth +2.5/5.0
- Livability +2.5/5.0
- Condition / age +2.5/5.0
- Appreciation +0.0/10.0
$129,900
🖨 Deal sheet 📄 Offer letter ✓ Due diligence
Listing remarks
Beautifully maintained 2022 MHE Mansion Elite Sherwood Creek 5876 located in the desirable Hamburg Hills Coventry Woods community. This premium 3-bedroom, 2-bath home offers an open-concept floor plan with drywall throughout, upgraded residential trim, a spacious living area, dedicated dining space, and a large kitchen featuring a center island and abundant storage. Appliances are included, along with select furniture, making this home truly move-in ready. The private primary suite features a spacious primary closet and ensuite bath with dual sinks, soaking tub, and separate shower. Two additional bedrooms and a full bath are located on the opposite end of the home, providing privacy and fl
Key facts
- Ensuite bath
- Large kitchen
- Abundant storage
Tags
Neighborhood map
What this means for you Summary
Snapshot
- This is a 3-bed/2.0-bath other listed at $130k.
Deal economics
- At list price, monthly cash flow is $784 ($9k/yr) — positive.
- The deal already cash-flows at list — no discount required.
- Meets the 1% rule at list price ($2k rent vs $130k).
Location & tenants
- Location reads: area grade B — affects rentability + tenant quality, not the cash-flow math above.
- Pinckney Community Schools (suburban): math 34% / reading 52% proficiency, ranked #135 of 540 in MI (top 25%) — families likely to look elsewhere, expect single-tenant / working-renter base with shorter leases; only 17% free/reduced lunch — higher-income household profile.
- Market conditions: 87 active listings in the ZIP; solid renter incomes; 488 units permitted in Livingston County in 2024 (0 in 5+ unit buildings).
Forward outlook
- Local home prices are declining (-3.0%/yr); year-one equity from $898 of loan paydown is wiped out by about $4k of value loss. Plan a longer hold.
- Livingston County population projected at +7% by 2050 — modest demand growth; plan on rents tracking national, not racing it.
- At projected returns (-3.0% appreciation + 3.0% rent growth), your $36k cash investment doubles in ~5 years — after that, you're playing with house money.
Negotiation context
- Only 4 days on market — expect competitive offers; lowballing is unlikely to land.
Questions for the listing agent
- Is there a deadline driving the sale (1031 exchange, divorce, estate, relocation)? That informs how much negotiation room exists.
- What's the average days-on-market for RENTAL listings here right now (not sales)? A rising rental-DOM trend means longer vacancies and softer asking-rent achievability than the comps imply.
- What's the recent tenant-quality profile in this submarket — average credit score on applications, eviction rate, late-payment / NSF rate, and stable-employment percentage? A property-management company in the area should have these aggregated.
- How much new for-sale + rental construction is in the pipeline within 1–3 miles? Heavy new supply typically softens prices + rents 12–24 months out; constrained supply supports both.
Investment metrics
- 1% rule
- 1.64% ✓
- Cap rate
- 13.54%
- Cash-on-cash
- 25.88%
- DSCR
- 2.15
- GRM
- 5.1
CMA / ARV
No comps found within radius.
Projected returns pro-forma
-3.0% appreciation · 3.0% rent growth · sell at horizon
- IRR
- 19.6%
- Equity multiple
- 1.80×
- Total profit
- $28,935
- Equity at exit
- $19,369
- IRR
- 27.9%
- Equity multiple
- 3.46×
- Total profit
- $89,649
- Equity at exit
- $11,231
Cash invested: $36,372 (down + closing). Projections, not guarantees.
Landlord ↔ Tenant lean methodology
- Overall (STATE)
- 62 Landlord-Friendly
- State Michigan
- 62 Landlord-Friendly · EVEN
- County
- — inherits STATE
- City
- — inherits STATE
ZIP-level market 48189
- Active inventory
- 87
- Price-to-rent
- 5.1×
Monthly cashflow live
- Estimated rent
- $2,129 medium interval (Pro) →
- Mortgage (P&I)
- −$681
- Tax est. 1.5%
- −$162 /mo · $1,948/yr
- Insurance
- −$54
- HOA
- −$0
- Vacancy / Maint / Mgmt
- −$447
- Net cashflow
- $784
Break-even live
UW: 25.0% down · 7.5% · 30yr · 1.5% tax · 5.0% vac · 8.0% maint · 8.0% mgmt
Financing live
Cash to close
- Down payment
- $32,475
- Closing costs
- $3,897
- Reserves months
- —
- Total cash needed
- —
Loan-product check · same deal, 3 products live
Conventional
25% down · 7.5% · 30yr
- Down + closing
- —
- Monthly P&I
- —
- Monthly cashflow
- —
- DSCR
- —
- Eligible?
- —
Personal DTI + credit; lowest rate.
DSCR
20% down · 8.5% · 30yr
- Down + closing
- —
- Monthly P&I
- —
- Monthly cashflow
- —
- DSCR
- —
- Eligible?
- —
No personal income docs; deal must DSCR.
Hard money
10% down · 12.0% · 12mo
- Down + closing
- —
- Monthly P&I
- —
- Monthly cashflow
- —
- DSCR
- —
- Eligible?
- —
Short-term bridge; refi at stabilization.
Listing history 13 events
-
2026-06-18status $129,900 Pending 4 DOM
-
2026-06-18days on market $129,900 Active 4 DOM
-
2026-06-17days on market $129,900 Active 3 DOM
-
2026-06-16days on market $129,900 Active 2 DOM
-
2026-06-15days on market $129,900 Active 1 DOM
-
2026-06-15days on market $129,900 Active 3 DOM
-
2026-06-13price $129,900 Active 1 DOM
-
2026-06-13remarks 699-char remark
-
2026-06-13days on market $139,900 Active 1 DOM
-
2026-06-09days on market $139,900 Active 4 DOM
-
2026-06-08days on market $139,900 Active 3 DOM
-
2026-06-07remarks 691-char remark
-
2026-06-07$139,900 Active 2 DOM
ⓘ Source: listings_history table (triggers on properties + properties_extension) + one-shot
backfill from property_details.listing_events for pre-trigger history.
Nearby sold comps map
Loading sold comps map…
Walkable amenities ~0.75 mi
Loading nearby amenities…
Taxation est. · year 1
- Rental income
- $25,550
- − Mortgage interest
- −$7,276
- − Property taxes
- −$1,948
- − Insurance
- −$650
- − Repairs & maintenance
- −$2,044
- − Management
- −$2,044
- − Depreciation
- −$3,779
- Taxable income
- $7,808
- Est. tax owed @ 24.0%
- −$1,874
- After-tax cash flow
- $7,538/yr
For passive investors: Depreciation is non-cash, so a rental often shows a tax loss while cash-flowing — sheltering income. Rental losses are passive: they offset passive income freely, and up to $25,000/yr can offset ordinary (W-2) income if you actively participate and your MAGI is under $100k (phasing out to $0 by $150k); unused losses carry forward. On sale, claimed depreciation is recaptured at up to 25%, and gains may owe capital-gains tax (a 1031 exchange can defer both). Figures are a year-1 estimate at your 24.0% rate — not tax advice; consult a CPA.
Schools (NCES district)
- District
- Pinckney Community Schools
- NCES district ID
- 2628140
- Math proficiency
- 34% ▼ -10.00%
- Reading proficiency
- 52% ▼ -3.00%
- Median HH income
- $74,072
- Composite
- 39.21/100
- National rank
- #4016
- State rank
- #135 of 540 in MI
Livability — Hamburg
No livability data for this city. (Only ~50 U.S. cities are tracked.)
Census & demographics
- County
- Washtenaw County · 306,860 people
- Metro
- Ann Arbor, MI
- Population (ZIP)
- 13,893
- Household income
- $87,145
- Rent vs Own
- Severe rent burden
- 105.0
Population outlook (Livingston County) Hauer SSP2
- Today (2025)
- 202,920 people
- By 2030
- 209,173 · +3.1%
- By 2040
- 216,878 · +6.9%
- By 2050
- 217,485 · +7.2%
- By 2075
- 217,590 · +7.2%
- By 2100
- 197,095 · -2.9%
Race, ethnicity, and origin ACS 2023
- Neighborhood character
- Predominantly White (91%)
- Race & ethnicity
- White 91% Hispanic / Latino 3% Two or more races 3% Black 2% Asian 1%
- Common ancestry
- Romanian 9% Lithuanian 6% Slovak 5%
- Foreign-born
- 3% · Canada
- Languages at home
- 97% English-only · French/Haitian/Cajun 1% Spanish 1%
Political lean MEDSL · Livingston
- 2024 margin
- Strong R (+23.9) · D 37.4% · R 61.3% · Other 1.3%
- 2008→2024 swing
- -10.7pp toward R · 2008: -13.3pp · 2024: -23.9pp
- All cycles
- 2024: R+23.9 2020: R+22.6 2016: R+29.6 2012: R+23.3 2008: R+13.3
Not yet ingested
- Civics
- —
Market trends
- HPI YoY
- ▼ -192.47%
- Current HPI
- 187.7383
- Rent YoY
- —
- Metro
- Ann Arbor, MI
- State GDP YoY
- ▲ 1.37%
- F500 in state
- 28
Industry mix (Fortune 500 HQ in MI)
| Industry | F500 HQs | Revenue |
|---|---|---|
| Automotive Parts | 3 | $48B |
|
||
| Automotive | 2 | $372B |
|
||
| Chemicals | 1 | $45B |
|
||
| Automotive Retail | 1 | $29B |
|
||
| Healthcare / Medical Devices | 1 | $23B |
|
||
| Automotive Technology | 1 | $20B |
|
||
Price history
1 event — show timeline
- 2026-06-06 Listed $139,900 FSBO.com
Cash-flow waterfall
monthlySold comps — $/sqft
last 12 mo · ≤1 miLoading sold comps…