 🏷️ Likely Rental
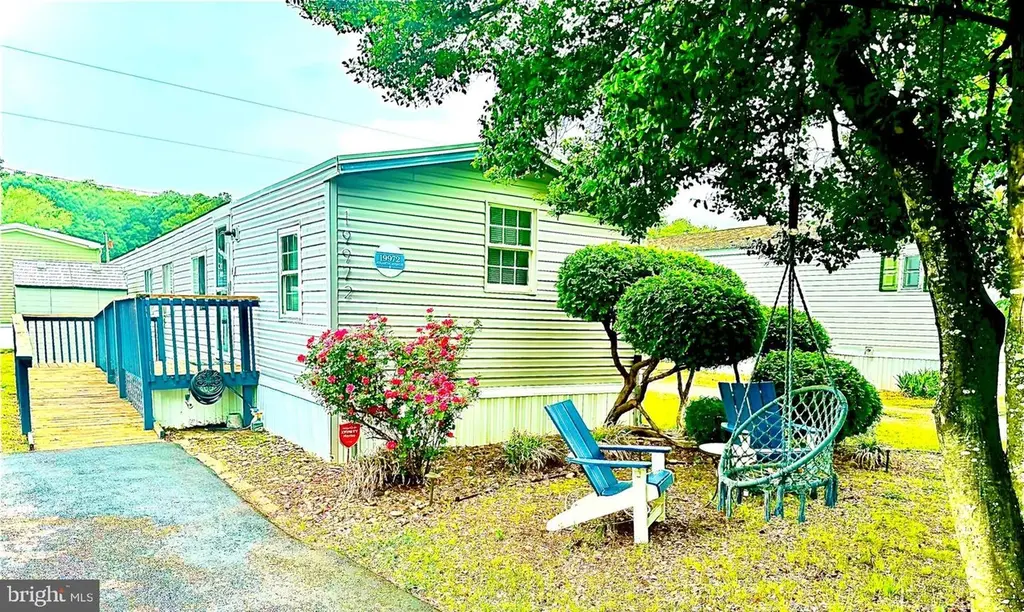
19972 Atlantic Ave #19227 · Rehoboth Beach, DE
Flood risk 1/10 · Minimal
- FEMA flood zone
- X (unshaded)
- Chance of flooding over 30 yrs
- 0.0%
- Est. flood insurance / yr
- $473 – $860
Fire risk 1/10 · Minimal
- Est. fire insurance / yr
- $476 – $884
Heat risk 8/10 · Major
- Hot days now (above 101°F)
- 7 days/yr
- Hot days in 30 yrs
- 18 days/yr
Wind risk 8/10 · Major
- Chance of severe wind over 30 yrs
- 80.0%
Air-quality risk 2/10 · Minimal
- Unhealthy air days now
- 1 days/yr
- Unhealthy air days in 30 yrs
- 1 days/yr
Risk factors via First Street. Map © Google.
Why this score? — see what drove the D+ grade
The composite is a weighted blend of 9 inputs, each scored 0–100. Each bar is that input's sub-score; the figure is the points it added to the 100-point composite (weight × sub-score).
- Cash flow +15.0/30.0
- ARV discount +7.5/15.0
- 1% rule +5.0/10.0
- DSCR +5.0/10.0
- Schools +4.2/10.0
- Livability +3.6/5.0
- Rent growth +2.5/5.0
- Condition / age +2.5/5.0
- Appreciation +0.0/10.0
$49,999
🖨 Deal sheet (PDF) 📄 Offer letter ✓ Due diligence
Listing remarks MLS
Welcome To Sea Air MHP. Here is your chance to be close to the beaches with a HANDYMAN Special. Accepting CASH only. This is a 1983 Mobile home that had construction started and seller was not able to finish. The kitchen has been updated but has NO appliances, and the Bathroom has been updated completely. The difficult parts have been done. The bedrooms need a little TLC to finish up. The seller is selling the property "AS IS". There are no warranties given or expressed and no further repairs will be done to the property. Seller is not sure of heating unit or cooling unit. You can check out or replace as needed. Vinyl siding was added but not completed final touch ups, back few windows were not installed. Lot rent is 595.00 Per month. New buyer must be approved into the park. There is an application fee of 50.00 per person.
Key facts
- 2 parking spots
- Community pool
- Built 1983
Property features AI
Finance
- Other: Income/expense list notes annual ground rent
- Financial info: Monthly land lease payment of $823; Land lease has 1 year remaining; Ground rent listed with 1 year remaining; Lease not considered
- HOA & community: Community pool; Property manager present
Exterior
- Parking: Driveway parking (2 spaces); 2 total garage/parking spaces
- Security: No security details provided
- Utilities: Public water; Public septic; Electric hot water
- Home design: Manufactured property (single wide); Land lease ownership; Very good condition; Effective year of major remodel: 2021; Year built source estimated; Located outside city limits; Facing / directional details not provided; Entry level details not provided
- Construction: Modular/manufactured construction
- Exterior features: Community pool; Above grade and below grade structures noted; Not in a federal flood zone; Ground rent exists
Interior
- Kitchen: No kitchen appliance details provided
- Bedrooms: 3 bedrooms on main level
- Flooring: No flooring details provided
- Bathrooms: 1 full bathroom on main level
- Heating & cooling: Forced air heating; Central air conditioning; Electric heating/cooling and hot water
- Interior features: Not furnished; Ramp to main level; 6 total rooms; No basement
- Laundry & utility: Washer and dryer in unit
Neighborhood map
What this means for you Summary
Snapshot
- This is a 3-bed/1.0-bath single-family listed at $50k.
Deal economics
- At list price, monthly cash flow is $2k ($22k/yr) — positive.
- The deal already cash-flows at list — no discount required.
- Meets the 1% rule at list price ($3k rent vs $50k).
- Recommended offer: $49k (1.5% below list) — sets the bar for market timing.
- Cap rate 50.5% vs local median 1.1% in Rehoboth Beach — top-decile yield for the area; either an underpriced asset or a hidden risk that comps aren't pricing in. Stress-test before assuming the spread holds.
Location & tenants
- Location reads 71/100 on livability (#20 in DE) — a middle-class / working-renter tenant base. Strengths: amenities A+, employment A+, health & safety A+; Watch: crime F, commute F, cost of living F.
- Cape Henlopen School District (town): math 42% / reading 55% proficiency, ranked #5 of 26 in DE (top 19%) — families likely to look elsewhere, expect single-tenant / working-renter base with shorter leases.
- Zoned schools: Rehoboth Elementary School (math 51% / reading 60%, grade C, #8 of 105 statewide, top 8%, 525 students, 0% FRL); Beacon Middle School (math 49% / reading 62%, grade B-, #1 of 36 statewide, top 0%, 648 students, 0% FRL); Cape Henlopen High School (math 26% / reading 51%, grade F, #14 of 40 statewide, top 33%, 1,813 students, 0% FRL) — zoned schools average 0% FRL vs 41% district-wide (41 pts lower); this property's tenant base skews higher-income than the district average.
- Market conditions: 334 active listings in the ZIP; 5 comparable units currently listed for rent nearby; rentals lingering (median 46d on market — plan ~5-8 weeks vacancy on turnover, expect pricing pressure); 60% of comp listings sitting > 30 days — soft ceiling on asking rent; solid renter incomes; 4,354 units permitted in Sussex County in 2024 (344 in 5+ unit buildings).
- This rent runs 33% of the median local income ($102k/yr) — at the standard rent-burdened threshold; future hikes will face affordability resistance.
Forward outlook
- Local home prices are declining (-3.0%/yr); year-one equity from $345 of loan paydown is wiped out by about $2k of value loss. Plan a longer hold.
- Sussex County population projected at +25% by 2050 — long-run rental-demand tailwind backs the buy-and-hold thesis.
- At projected returns (-3.0% appreciation + 3.0% rent growth), your $14k cash investment doubles in ~1 year — after that, you're playing with house money.
Negotiation context
- It's been on market 22 days — a 2% lower offer ($49k) is reasonable based on typical stale-listing flexibility.
- 2 sale attempts since 6y ago with the ask held roughly flat each time — persistent listings suggest the price (not the market) is what's stuck; bring a comps-based counter.
- Current owner paid $28k; list at $50k implies a 79% gain — meaningful room to come down on a strong offer.
Risks & watch-outs
- Climate carrying-cost: severe wind risk, 80% chance of damaging wind over 30y; extreme-heat days projected 7→18/yr by 2055 (HVAC capex compounding) — expect insurance premiums to compound above CPI over the hold.
Questions for the listing agent
- Is there a deadline driving the sale (1031 exchange, divorce, estate, relocation)? That informs how much negotiation room exists.
- Schools are A-rated — typically a magnet for longer-tenancy family renters. What's the average tenant stay here, and is there a school-zone premium baked into asking?
- Crime grade is F in this area — have there been break-ins, vandalism, or insurance claims at this property in the last 3 years? What carrier currently insures it and at what premium?
- The area grade is low — what's the realistic commute time and amenity access for the typical tenant pool here? Any planned neighborhood developments (good or bad) we should know about?
- What's the average days-on-market for RENTAL listings here right now (not sales)? A rising rental-DOM trend means longer vacancies and softer asking-rent achievability than the comps imply.
- What's the recent tenant-quality profile in this submarket — average credit score on applications, eviction rate, late-payment / NSF rate, and stable-employment percentage? A property-management company in the area should have these aggregated.
- How much new for-sale + rental construction is in the pipeline within 1–3 miles? Heavy new supply typically softens prices + rents 12–24 months out; constrained supply supports both.
Investment metrics
- 1% rule
- 5.54% ✓
- Cap rate
- 50.50%
- Cash-on-cash
- 157.88%
- DSCR
- 8.02
- GRM
- 1.5
CMA / ARV
- ARV (on-the-fly)
- $100,800
- Comps found
- 8
Show comp detail 8 sales within ~0.75 mi
| Address | Dist | Beds/Ba | Sqft | Sold | Price | $/sf | Match |
|---|---|---|---|---|---|---|---|
| 19989 Center Ave Unit D95 | 0.20mi | 2/1.0 (-1) | 840 (0%) | 11mo | $68,000 | $81 | 76 |
| 26 Sunnyfield Rd Unit E-15 | 0.61mi | 2/1.0 (-1) | 840 (0%) | 2mo | $110,000 | $131 | 65 |
| 19961 Center Ave #20473 | 0.15mi | 2/1.0 (-1) | 728 (-13%) | 6mo | $38,380 | $53 | 61 |
| 20087 Atlantic Ave #52388 | 0.22mi | 2/2.0 (-1) | 924 (+10%) | 9mo | $121,000 | $131 | 57 |
| 19993 Center Ave #14279 | 0.21mi | 2/1.0 (-1) | 924 (+10%) | 20mo | $106,000 | $115 | 52 |
| 19883 Atlantic Ave #54290 | 0.18mi | 2/2.0 (-1) | 960 (+14%) | 10mo | $115,000 | $120 | 50 |
| 19889 Atlantic Ave Unit F-5 | 0.16mi | 2/1.0 (-1) | 960 (+14%) | 17mo | $85,000 | $89 | 50 |
| 19698 Queen St #195 | 0.33mi | 2/1.0 (-1) | 910 (+8%) | 21mo | $116,000 | $127 | 48 |
Match score weights: distance 35% · size 25% · config 20% · recency 20%. Top-matched comps best support the ARV.
Projected returns pro-forma
-3.0% appreciation · 3.0% rent growth · sell at horizon
- IRR
- —
- Equity multiple
- 8.80×
- Total profit
- $109,249
- Equity at exit
- $7,455
- IRR
- —
- Equity multiple
- 18.60×
- Total profit
- $246,356
- Equity at exit
- $4,323
Cash invested: $14,000 (down + closing). Projections, not guarantees.
Landlord ↔ Tenant lean methodology
- Overall (STATE)
- 70 Landlord-Friendly
- State Delaware
- 70 Landlord-Friendly · D+7
- County
- — inherits STATE
- City
- — inherits STATE
ZIP-level market 19971
- Active inventory
- 334
- Price-to-rent
- 1.5×
Monthly cashflow live
- Estimated rent
- $2,769 high interval (Pro) →
- Mortgage (P&I)
- −$262
- Tax est. 1.5%
- −$62 /mo · $750/yr
- Insurance
- −$21
- HOA
- −$0
- Vacancy / Maint / Mgmt
- −$581
- Net cashflow
- $1,842
Break-even live
Sensitivity live
| Price | -10% $1,876 | -5% $1,859 | +0% $1,842 | +5% $1,825 | +10% $1,807 |
|---|---|---|---|---|---|
| Rent | -10% $1,623 | -5% $1,732 | +0% $1,842 | +5% $1,951 | +10% $2,061 |
| Rate | -1.0pp $1,867 | -0.5pp $1,855 | base $1,842 | +0.5pp $1,829 | +1.0pp $1,816 |
UW: 25.0% down · 7.5% · 30yr · 1.5% tax · 5.0% vac · 8.0% maint · 8.0% mgmt
Financing live
Cash to close
- Down payment
- $12,500
- Closing costs
- $1,500
- Reserves months
- —
- Total cash needed
- —
Loan-product check · same deal, 3 products live
Conventional
25% down · 7.5% · 30yr
- Down + closing
- —
- Monthly P&I
- —
- Monthly cashflow
- —
- DSCR
- —
- Eligible?
- —
Personal DTI + credit; lowest rate.
DSCR
20% down · 8.5% · 30yr
- Down + closing
- —
- Monthly P&I
- —
- Monthly cashflow
- —
- DSCR
- —
- Eligible?
- —
No personal income docs; deal must DSCR.
Hard money
10% down · 12.0% · 12mo
- Down + closing
- —
- Monthly P&I
- —
- Monthly cashflow
- —
- DSCR
- —
- Eligible?
- —
Short-term bridge; refi at stabilization.
Rent comps 5 comps
| Address | Beds | Baths | Sqft | Rent | $/sqft | DOM | Units | Dist |
|---|---|---|---|---|---|---|---|---|
| 36400 Warwick Dr Rehoboth Beach, DE | 3.0 | 2.5 | 792 | $3,500 | $4.42 | 45d | 1 | 0.77mi |
| 107 Strawberry Way Rehoboth Beach, DE | 3.0 | 2.0 | 1025 | $2,750 | $2.68 | 45d | 1 | 0.94mi |
| 35948 Haven Dr #201 Rehoboth Beach, DE | 2.0 | 2.0 | 858 | $1,800 | $2.10 | 22d | 1 | 0.98mi |
| 300 Pebble Dr #318 Rehoboth Beach, DE | 2.0 | 2.0 | 940 | $1,800 | $1.91 | 22d | 1 | 1.05mi |
| 32015 Azure Ave Rehoboth Beach, DE | 1.0–3.0 | 1.0–2.0 | 1054 | $2,375 | $2.25 | 45d | 1 | 1.43mi |
Listing history 18 events
-
2026-06-22days on market $49,999 Active 22 DOM
-
2026-06-18days on market $49,999 Active 19 DOM
-
2026-06-17days on market $49,999 Active 18 DOM
-
2026-06-16days on market $49,999 Active 17 DOM
-
2026-06-15days on market $49,999 Active 16 DOM
-
2026-06-14days on market $49,999 Active 14 DOM
-
2026-06-13days on market $49,999 Active 13 DOM
-
2026-06-10days on market $49,999 Active 11 DOM
-
2026-06-09days on market $49,999 Active 10 DOM
-
2026-06-08days on market $49,999 Active 9 DOM
-
2026-06-07remarks 699-char remark
-
2026-06-07days on market $49,999 Active 8 DOM
-
2026-06-05days on market $49,999 Active 5 DOM
-
2026-06-03days on market $49,999 Active 4 DOM
-
2026-06-02days on market $49,999 Active 3 DOM
-
2026-06-01days on market $49,999 Active 2 DOM
-
2026-05-31remarks 423-char remark
-
2026-05-31$49,999 Active 1 DOM
ⓘ Source: listings_history table (triggers on properties + properties_extension) + one-shot
backfill from property_details.listing_events for pre-trigger history.
Climate risk First Street
- Flood 1/10 Low FEMA zone X (unshaded) · 0% chance over 30 yrs
- Wildfire 1/10 Low
- Heat 8/10 Severe 7 d/yr ≥101°F today · 18 d/yr by 30 yrs out
- Wind 8/10 Severe 80% chance of damaging wind over 30 yrs
- Air quality 2/10 Low 1 unhealthy d/yr today · 1 by 30 yrs out
Nearby sold comps map
Loading sold comps map…
Walkable amenities ~0.75 mi
Loading nearby amenities…
Taxation est. · year 1
- Rental income
- $33,226
- − Mortgage interest
- −$2,801
- − Property taxes
- −$750
- − Insurance
- −$250
- − Repairs & maintenance
- −$2,658
- − Management
- −$2,658
- − Depreciation
- −$1,455
- Taxable income
- $22,655
- Est. tax owed @ 24.0%
- −$5,437
- After-tax cash flow
- $16,665/yr
For passive investors: Depreciation is non-cash, so a rental often shows a tax loss while cash-flowing — sheltering income. Rental losses are passive: they offset passive income freely, and up to $25,000/yr can offset ordinary (W-2) income if you actively participate and your MAGI is under $100k (phasing out to $0 by $150k); unused losses carry forward. On sale, claimed depreciation is recaptured at up to 25%, and gains may owe capital-gains tax (a 1031 exchange can defer both). Figures are a year-1 estimate at your 24.0% rate — not tax advice; consult a CPA.
Schools (NCES district)
- District
- Cape Henlopen School District
- NCES district ID
- 1000170
- Math proficiency
- 42% ▼ -14.00%
- Reading proficiency
- 55% ▼ -10.00%
- Median HH income
- $60,196
- Composite
- 42.47/100
- National rank
- #3214
- State rank
- #5 of 26 in DE
Livability — Rehoboth Beach
- Score
- 71/100
- State rank
- #20
- US rank
- #6520
Category grades
Schools grade is shown separately in the Schools card above.
Census & demographics
- County
- Sussex County · 82,708 people
- City population
- 14,886
- Metro
- Salisbury, MD-DE
- Population (ZIP)
- 14,886
- Household income
- $102,146
- Rent vs Own
- Severe rent burden
- 317.0
Population outlook (Sussex County) Hauer SSP2
- Today (2025)
- 248,853 people
- By 2030
- 264,464 · +6.3%
- By 2040
- 290,980 · +16.9%
- By 2050
- 311,259 · +25.1%
- By 2075
- 352,488 · +41.6%
- By 2100
- 367,406 · +47.6%
Race, ethnicity, and origin ACS 2023
- Neighborhood character
- Predominantly White (88%)
- Race & ethnicity
- White 88% Black 4% Two or more races 4% Hispanic / Latino 3% Asian 2%
- Common ancestry
- Romanian 5% Slovak 3% Italian 3%
- Foreign-born
- 6% · Canada, China
- Languages at home
- 95% English-only · Spanish 2% Russian/Polish/Slavic 1% French/Haitian/Cajun 1%
Political lean MEDSL · Sussex
- 2024 margin
- R (+11.0) · D 43.9% · R 54.9% · Other 1.2%
- 2008→2024 swing
- -2.4pp toward R · 2008: -8.6pp · 2024: -11.0pp
- All cycles
- 2024: R+11.0 2020: R+11.2 2016: R+22.0 2012: R+13.0 2008: R+8.6
Not yet ingested
- Civics
- —
Market trends
- HPI YoY
- ▼ -220.39%
- Current HPI
- 353.3977
- Rent YoY
- —
- Metro
- Salisbury, MD-DE
- State GDP YoY
- —
- F500 in state
- 0
Price history
+25.0% since first listed4 events — show timeline
- 2026-05-30 Listed $49,999 BRIGHT MLS
- 2021-01-08 Sold (MLS) $28,000 BRIGHT MLS
- 2020-12-23 Contingent — BRIGHT MLS
- 2020-10-23 Listed $40,000 BRIGHT MLS
Cash-flow waterfall
monthlySold comps — $/sqft
last 12 mo · ≤1 miLoading sold comps…