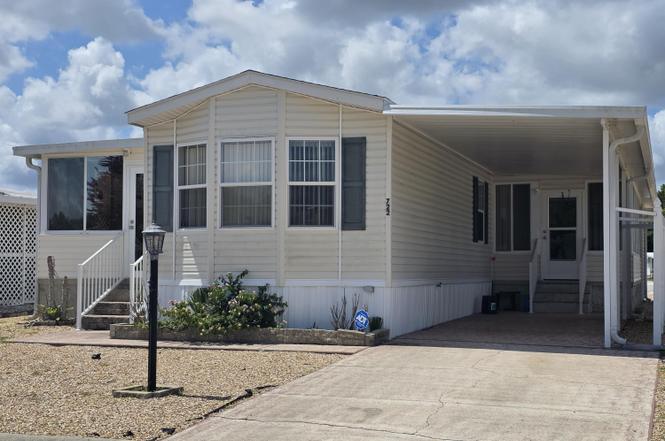
722 La Grange Ave · Port Orange, FL
Flood risk 1/10 · Minimal
- FEMA flood zone
- X (unshaded)
- Chance of flooding over 30 yrs
- 0.0%
- Est. flood insurance / yr
- $507 – $1,088
Fire risk 2/10 · Minimal
- Est. fire insurance / yr
- $947 – $1,759
Heat risk 9/10 · Severe
- Hot days now (above 106°F)
- 7 days/yr
- Hot days in 30 yrs
- 20 days/yr
Wind risk 10/10 · Severe
- Chance of severe wind over 30 yrs
- 99.0%
Air-quality risk 2/10 · Minimal
- Unhealthy air days now
- 1 days/yr
- Unhealthy air days in 30 yrs
- 1 days/yr
Risk factors via First Street. Map © Google.
Why this score? — see what drove the D- grade
The composite is a weighted blend of 9 inputs, each scored 0–100. Each bar is that input's sub-score; the figure is the points it added to the 100-point composite (weight × sub-score).
- Cash flow +12.4/30.0
- ARV discount +7.5/15.0
- Livability +4.0/5.0
- Schools +3.9/10.0
- DSCR +3.7/10.0
- 1% rule +3.6/10.0
- Condition / age +2.5/5.0
- Rent growth +1.8/5.0
- Appreciation +0.0/10.0
$193,000
🖨 Deal sheet (PDF) 📄 Offer letter ✓ Due diligence
Listing remarks
Enjoy easy Florida living in this well-kept 2010 mobile home located on a corner lot in a friendly 55+ community where you own the land. With a voluntary HOA of only $25 per year, this home is an affordable and low-maintenance option for retirees, snowbirds, or anyone ready to simplify. The split-bedroom floor plan gives you privacy with bedrooms on opposite ends of the home, while two sun porches offer the perfect spots to enjoy morning coffee, read, relax, or visit with friends. Outside, the attractive rock landscaping means no lawn to mow, giving you more time to enjoy the Florida lifestyle. An outbuilding provides extra storage for tools, beach chairs, bikes, holiday items, or anything
Key facts
- Rock landscaping
- Two sun porches
- Outbuilding
Tags
Neighborhood map
What this means for you Summary
Snapshot
- This is a 2-bed/2.0-bath manufactured listed at $193k.
Deal economics
- At list price, monthly cash flow is $-30 ($-361/yr) — negative.
- To cash-flow at today's rent, offer at most $189k (2.3% below list).
- To meet the 1% rule (rent ≥ 1% of price), the offer needs to be $165k (14.4% below list).
- Recommended offer: $165k (14.4% below list) — sets the bar for 1% rule.
Location & tenants
- Location reads 80/100 on livability (#131 in FL, #1,957 nationally) — a professional / high-income tenant draw. Strengths: housing A+, health & safety A+, cost of living A; Watch: amenities D+, commute D+.
- Volusia (suburban): math 44% / reading 49% proficiency, ranked #47 of 73 in FL (top 64%) — families likely to look elsewhere, expect single-tenant / working-renter base with shorter leases.
- Market conditions: Rents soft (-2.7%/yr); 247 active listings in the ZIP; 15 comparable units currently listed for rent nearby; rentals at typical pace (median 16d on market — plan ~3-4 weeks tenant-placement turnaround); 3,402 units permitted in Volusia County in 2024 (681 in 5+ unit buildings).
Forward outlook
- Local home prices are declining (-3.0%/yr); year-one equity from $1k of loan paydown is wiped out by about $6k of value loss. Plan a longer hold.
- Volusia County population projected at +19% by 2050 — long-run rental-demand tailwind backs the buy-and-hold thesis.
Negotiation context
- Only 1 days on market — expect competitive offers; lowballing is unlikely to land.
- 3 sale attempts since 17y ago with the ask held roughly flat each time — persistent listings suggest the price (not the market) is what's stuck; bring a comps-based counter.
- Current owner paid $10k; list at $193k implies a 1738% gain — meaningful room to come down on a strong offer.
Risks & watch-outs
- Climate carrying-cost: severe wind risk, 99% chance of damaging wind over 30y; extreme-heat days projected 7→20/yr by 2055 (HVAC capex compounding) — expect insurance premiums to compound above CPI over the hold.
Questions for the listing agent
- What do current leases actually rent for vs. the listed asking? Can we see a recent rent roll and the last 12 months of T-12 income?
- What does the HOA fee cover, when was the last increase, and are there any pending special assessments or reserve-fund shortfalls?
- Is there a deadline driving the sale (1031 exchange, divorce, estate, relocation)? That informs how much negotiation room exists.
- Schools are B-rated — typically a magnet for longer-tenancy family renters. What's the average tenant stay here, and is there a school-zone premium baked into asking?
- The area grade is low — what's the realistic commute time and amenity access for the typical tenant pool here? Any planned neighborhood developments (good or bad) we should know about?
- What's the average days-on-market for RENTAL listings here right now (not sales)? A rising rental-DOM trend means longer vacancies and softer asking-rent achievability than the comps imply.
- What's the recent tenant-quality profile in this submarket — average credit score on applications, eviction rate, late-payment / NSF rate, and stable-employment percentage? A property-management company in the area should have these aggregated.
- How much new for-sale + rental construction is in the pipeline within 1–3 miles? Heavy new supply typically softens prices + rents 12–24 months out; constrained supply supports both.
Investment metrics
- 1% rule
- 0.86% ✗
- Cap rate
- 6.11%
- Cash-on-cash
- -0.67%
- DSCR
- 0.97
- GRM
- 9.7
CMA / ARV
No comps found within radius.
Projected returns pro-forma
-3.0% appreciation · 0.0% rent growth · sell at horizon
- IRR
- -20.8%
- Equity multiple
- 0.30×
- Total profit
- $-38,007
- Equity at exit
- $28,777
- IRR
- -23.0%
- Equity multiple
- -0.00×
- Total profit
- $-54,175
- Equity at exit
- $16,687
Cash invested: $54,040 (down + closing). Projections, not guarantees.
Landlord ↔ Tenant lean methodology
- Overall (STATE)
- 87 Strongly Landlord-Friendly
- State Florida
- 87 Strongly Landlord-Friendly · R+3
- County
- — inherits STATE
- City
- — inherits STATE
ZIP-level market 32129
- Rents YoY
- -2.7%
- Active inventory
- 247
- Price-to-rent
- 9.7×
Monthly cashflow live
- Estimated rent
- $1,653 high interval (Pro) →
- Mortgage (P&I)
- −$1,012
- Tax est. 1.5%
- −$241 /mo · $2,895/yr
- Insurance
- −$80
- HOA
- −$2
- Vacancy / Maint / Mgmt
- −$347
- Net cashflow
- $-30
Break-even live
Sensitivity live
| Price | -10% $103 | -5% $37 | +0% $-30 | +5% $-97 | +10% $-163 |
|---|---|---|---|---|---|
| Rent | -10% $-161 | -5% $-95 | +0% $-30 | +5% $35 | +10% $100 |
| Rate | -1.0pp $67 | -0.5pp $19 | base $-30 | +0.5pp $-80 | +1.0pp $-131 |
UW: 25.0% down · 7.5% · 30yr · 1.5% tax · 5.0% vac · 8.0% maint · 8.0% mgmt
Financing live
Cash to close
- Down payment
- $48,250
- Closing costs
- $5,790
- Reserves months
- —
- Total cash needed
- —
Loan-product check · same deal, 3 products live
Conventional
25% down · 7.5% · 30yr
- Down + closing
- —
- Monthly P&I
- —
- Monthly cashflow
- —
- DSCR
- —
- Eligible?
- —
Personal DTI + credit; lowest rate.
DSCR
20% down · 8.5% · 30yr
- Down + closing
- —
- Monthly P&I
- —
- Monthly cashflow
- —
- DSCR
- —
- Eligible?
- —
No personal income docs; deal must DSCR.
Hard money
10% down · 12.0% · 12mo
- Down + closing
- —
- Monthly P&I
- —
- Monthly cashflow
- —
- DSCR
- —
- Eligible?
- —
Short-term bridge; refi at stabilization.
Rent comps 15 comps
| Address | Beds | Baths | Sqft | Rent | $/sqft | DOM | Units | Dist |
|---|---|---|---|---|---|---|---|---|
| 1154 Ashland Ct Port Orange, FL | 3.0 | 2.0 | 1118 | $1,795 | $1.61 | 15d | 1 | 0.33mi |
| 1152 Old Hammock Rd Unit 1 Port Orange, FL | 1.0 | 1.0 | 600 | $1,295 | $2.16 | 24d | 1 | 0.47mi |
| 3835 Clyde Morris Blvd Port Orange, FL | 1.0–3.0 | 1.0–2.0 | 1013 | $2,012 | $1.99 | 12d | 17 | 0.49mi |
| 1206 Deer Springs Rd Port Orange, FL | 2.0 | 2.0 | 1064 | $1,625 | $1.53 | 15d | 1 | 0.61mi |
| 1401 Reed Canal Rd Port Orange, FL | 1.0–3.0 | 1.0–2.0 | 1045 | $1,856 | $1.78 | 15d | 25 | 0.69mi |
| 3780 Clyde Morris Blvd Port Orange, FL | 2.0–3.0 | 2.0 | 1050 | $1,369 | $1.30 | 12d | 12 | 0.71mi |
| 1270 Reed Canal Rd Port Orange, FL | 1.0–3.0 | 1.0–2.0 | 1001 | $1,746 | $1.74 | 12d | 29 | 0.75mi |
| 12 Downing Dr Port Orange, FL | 2.0 | 2.0 | 921 | $1,599 | $1.74 | 15d | 1 | 0.80mi |
| 1200 Floral Springs Blvd Port Orange, FL | 1.0–3.0 | 1.0–2.0 | 1047 | $1,780 | $1.70 | 12d | 81 | 0.94mi |
| 980 Canal View Blvd Port Orange, FL | 2.0 | 1.5 | 1024 | $1,448 | $1.41 | 24d | 2 | 1.05mi |
| 1025 Eagle Lake Trl Port Orange, FL | 1.0 | 1.0 | 576 | $1,185 | $2.06 | 24d | 2 | 1.24mi |
| 110 Dolphin Fleet Cir Daytona Beach, FL | 1.0–3.0 | 1.0–2.5 | 1125 | $1,736 | $1.54 | 12d | 20 | 1.24mi |
| 1010 N Swallow Tail Dr Port Orange, FL | 1.0–2.0 | 1.0–2.0 | 893 | $1,574 | $1.76 | 12d | 16 | 1.36mi |
| 1601 Big Tree Rd #1107 South Daytona, FL | 2.0 | 2.0 | 864 | $1,500 | $1.74 | 15d | 1 | 1.44mi |
| 4801 Clyde Morris Blvd Port Orange, FL | 1.0 | 1.0 | 576 | $1,376 | $2.39 | 24d | 5 | 1.45mi |
HOA detail
- Monthly dues
- $2 · $24/yr
- Likely covers
- landscaping
Listing history 2 events
-
2026-06-18remarks 699-char remark
-
2026-06-18$193,000 Active 1 DOM
ⓘ Source: listings_history table (triggers on properties + properties_extension) + one-shot
backfill from property_details.listing_events for pre-trigger history.
Climate risk First Street
- Flood 1/10 Low FEMA zone X (unshaded) · 0% chance over 30 yrs
- Wildfire 2/10 Low
- Heat 9/10 Extreme 7 d/yr ≥106°F today · 20 d/yr by 30 yrs out
- Wind 10/10 Extreme 99% chance of damaging wind over 30 yrs
- Air quality 2/10 Low 1 unhealthy d/yr today · 1 by 30 yrs out
Nearby sold comps map
Loading sold comps map…
Walkable amenities ~0.75 mi
Loading nearby amenities…
Taxation est. · year 1
- Rental income
- $19,833
- − Mortgage interest
- −$10,811
- − Property taxes
- −$2,895
- − Insurance
- −$965
- − Repairs & maintenance
- −$1,587
- − Management
- −$1,587
- − HOA
- −$24
- − Depreciation
- −$5,615
- Taxable loss
- −$3,649
- Est. tax savings @ 24.0%
- +$876
- After-tax cash flow
- $515/yr
For passive investors: Depreciation is non-cash, so a rental often shows a tax loss while cash-flowing — sheltering income. Rental losses are passive: they offset passive income freely, and up to $25,000/yr can offset ordinary (W-2) income if you actively participate and your MAGI is under $100k (phasing out to $0 by $150k); unused losses carry forward. On sale, claimed depreciation is recaptured at up to 25%, and gains may owe capital-gains tax (a 1031 exchange can defer both). Figures are a year-1 estimate at your 24.0% rate — not tax advice; consult a CPA.
Schools (NCES district)
- District
- Volusia
- NCES district ID
- 1201920
- Math proficiency
- 44% ▼ -9.00%
- Reading proficiency
- 49% ▼ -3.00%
- Median HH income
- $42,946
- Composite
- 39.2/100
- National rank
- #4019
- State rank
- #47 of 73 in FL
Livability — Port Orange
- Score
- 80/100
- State rank
- #131
- US rank
- #1957
Category grades
Schools grade is shown separately in the Schools card above.
Census & demographics
- Census place
- Port Orange, FL
- County
- Volusia County · 556,871 people
- City population
- 75,051
- Metro
- Deltona-Daytona Beach-Ormond Beach, FL
- Population (ZIP)
- 23,195
- Household income
- $67,924
- Rent vs Own
- Severe rent burden
- 602.0
Population outlook (Volusia County) Hauer SSP2
- Today (2025)
- 572,749 people
- By 2030
- 598,695 · +4.5%
- By 2040
- 644,880 · +12.6%
- By 2050
- 681,451 · +19.0%
- By 2075
- 759,957 · +32.7%
- By 2100
- 778,902 · +36.0%
Race, ethnicity, and origin ACS 2023
- Neighborhood character
- Predominantly White (80%)
- Race & ethnicity
- White 80% Hispanic / Latino 7% Two or more races 6% Black 6% Asian 3%
- Hispanic origin (detail)
- Mexican 2% Puerto Rican 3%
- Common ancestry
- Lithuanian 4% Iranian 3% Romanian 3%
- Foreign-born
- 9% · Canada, South Korea, China
- Languages at home
- 87% English-only · Spanish 4% German/W. Germanic 3% Arabic 1%
Political lean MEDSL · Volusia
- 2024 margin
- Strong R (+21.8) · D 38.7% · R 60.5%
- 2008→2024 swing
- -27.4pp toward R · 2008: 5.7pp · 2024: -21.8pp
- All cycles
- 2024: R+21.8 2020: R+14.1 2016: R+13.1 2012: R+1.2 2008: D+5.7
Not yet ingested
- Civics
- —
Market trends
- HPI YoY
- ▼ -234.13%
- Current HPI
- 310.0285
- Rent YoY
- ▼ -2.71%
- Metro
- Deltona-Daytona Beach-Ormond Beach, FL
- State GDP YoY
- ▲ 3.28%
- F500 in state
- 36
Industry mix (Fortune 500 HQ in FL)
| Industry | F500 HQs | Revenue |
|---|---|---|
| Industrial Technology | 2 | $29B |
|
||
| Insurance | 2 | $17B |
|
||
| Retail | 1 | $60B |
|
||
| Technology Distribution | 1 | $58B |
|
||
| Homebuilding | 1 | $35B |
|
||
| Technology Manufacturing | 1 | $35B |
|
||
Price history
+1738.1% since first listed4 events — show timeline
- 2026-06-18 Listed $193,000 Daytona MLS
- 2010-02-01 Listed $45,000 Daytona MLS
- 2009-10-14 Listed $45,000 Daytona MLS
- 1980-04-01 Sold (Public Records) $10,500 Public Records
Property tax history
-3.3%/yrLatest (2025): $341 · +7.0% YoY. Source: county tax records.
Cash-flow waterfall
monthlySold comps — $/sqft
last 12 mo · ≤1 miLoading sold comps…