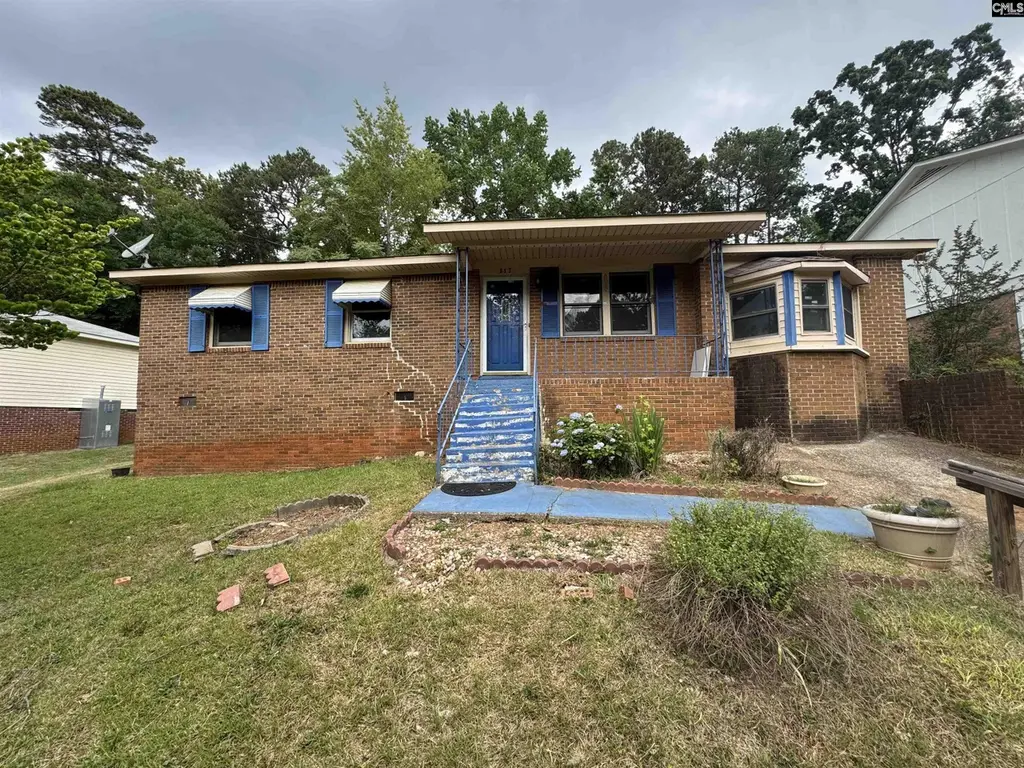
317 W Miriam Ave · Columbia, SC
Flood risk 1/10 · Minimal
- FEMA flood zone
- X (unshaded)
- Chance of flooding over 30 yrs
- 0.0%
- Est. flood insurance / yr
- $507 – $1,088
Fire risk 3/10 · Minor
- Est. fire insurance / yr
- $783 – $1,453
Heat risk 6/10 · Moderate
- Hot days now (above 108°F)
- 7 days/yr
- Hot days in 30 yrs
- 16 days/yr
Wind risk 6/10 · Moderate
- Chance of severe wind over 30 yrs
- 64.0%
Air-quality risk 3/10 · Minor
- Unhealthy air days now
- 2 days/yr
- Unhealthy air days in 30 yrs
- 2 days/yr
Risk factors via First Street. Map © Google.
Why this score? — see what drove the B- grade
The composite is a weighted blend of 9 inputs, each scored 0–100. Each bar is that input's sub-score; the figure is the points it added to the 100-point composite (weight × sub-score).
- Cash flow +30.0/30.0
- DSCR +10.0/10.0
- 1% rule +7.7/10.0
- ARV discount +7.5/15.0
- Livability +3.9/5.0
- Rent growth +3.1/5.0
- Schools +2.6/10.0
- Condition / age +2.5/5.0
- Appreciation +0.0/10.0
$120,000
🖨 Deal sheet 📄 Offer letter ✓ Due diligence
Listing remarks
* * Motivated Seller * * This home is cheaper than rent!! It is full of potential and ready for your personal touch. Property is being sold as-is. Please note that the water and electricity are currently off. This home offers 3 bedrooms, 1 bathroom, a bonus sitting area, hardwood floors in several rooms, and a back deck perfect for relaxing or entertaining. All appliances will remain with the property, including the stove, refrigerator, microwave, and dishwasher. Located in a quiet neighborhood, this property presents a great opportunity for an investment property or a starter home with plenty of possibilities. Don’t miss your chance to make it your own! Disclaimer: CMLS has
Key facts
- Bonus sitting area
- Back deck
- All appliances
Tags
Property features AI
Exterior
- Parking: Enclosed garage
- Utilities: Public water; Public sewer
- Home design: Single-story home; Crawlspace foundation
- Construction: Crawlspace foundation
- Exterior features: Deck; Front uncovered porch; Partial brick above foundation; Rear chain-link fence
Interior
- Kitchen: Tile countertops; Stained wood cabinets; Vinyl flooring; Dishwasher; Freezer; Refrigerator; Built-in microwave; Free-standing range
- Bedrooms: Master bedroom with private closet and hardwood and tile floors (Main level); Bedroom 2 with private closet and hardwood floors (Main level); Bedroom 3 with private closet and hardwood floors (Main level)
- Flooring: Hardwood floors in bedrooms; Tile in master bedroom; Carpet in living room; Vinyl in kitchen
- Bathrooms: One full bathroom (Main level)
- Heating & cooling: Central heating; Central cooling
- Interior features: Ceiling fan; Attic access; Bonus room (finished); Enclosed garage
- Laundry & utility: Utility room (Main level)
Neighborhood map
What this means for you Summary
Snapshot
- This is a 3-bed/1.0-bath single-family listed at $120k.
Deal economics
- At list price, monthly cash flow is $490 ($6k/yr) — positive.
- The deal already cash-flows at list — no discount required.
- Meets the 1% rule at list price ($2k rent vs $120k).
- Recommended offer: $118k (1.5% below list) — sets the bar for market timing.
- Cap rate 11.2% vs local median 5.0% in Columbia — top-decile yield for the area; either an underpriced asset or a hidden risk that comps aren't pricing in. Stress-test before assuming the spread holds.
Location & tenants
- Location reads 78/100 on livability (#18 in SC, #2,436 nationally) — a middle-class / working-renter tenant base. Strengths: amenities A+, commute A+, cost of living A+; Watch: employment D, crime F.
- Richland 01 (urban): math 26% / reading 36% proficiency, ranked #54 of 80 in SC (top 68%) — families likely to look elsewhere, expect single-tenant / working-renter base with shorter leases; 64% free/reduced lunch — lower-income household profile, screen leases tightly.
- Zoned schools: Edward E. Taylor Elementary (math 5% / reading 24%, grade F, #549 of 597 statewide, top 92%, 225 students, 100% FRL); Eau Claire High (math 22% / reading 84%, grade C-, #139 of 196 statewide, top 71%, 627 students, 100% FRL) — zoned schools average 100% FRL vs 64% district-wide (36 pts higher); higher-poverty schools than district average — tighter screening recommended.
- Market conditions: Rents rising (+2.5%/yr); 238 active listings in the ZIP; 10 comparable units currently listed for rent nearby; rentals at typical pace (median 24d on market — plan ~3-4 weeks tenant-placement turnaround); 3,472 units permitted in Richland County in 2024 (1,096 in 5+ unit buildings).
- This rent runs 40% of the median local income ($46k/yr) — at the standard rent-burdened threshold; future hikes will face affordability resistance.
Forward outlook
- Local home prices are declining (-3.0%/yr); year-one equity from $830 of loan paydown is wiped out by about $4k of value loss. Plan a longer hold.
- Richland County population projected at +30% by 2050 — long-run rental-demand tailwind backs the buy-and-hold thesis.
- At projected returns (-3.0% appreciation + 2.5% rent growth), your $34k cash investment doubles in ~8 years — after that, you're playing with house money.
Negotiation context
- It's been on market 29 days — a 2% lower offer ($118k) is reasonable based on typical stale-listing flexibility.
Risks & watch-outs
- Climate carrying-cost: major wind risk, 64% chance of damaging wind over 30y; extreme-heat days projected 7→16/yr by 2055 (HVAC capex compounding) — expect insurance premiums to compound above CPI over the hold.
Questions for the listing agent
- Built in 1971 — when were the roof, HVAC, electrical panel, plumbing, and water heater last replaced?
- Is there a deadline driving the sale (1031 exchange, divorce, estate, relocation)? That informs how much negotiation room exists.
- Schools are D-rated, which usually means shorter tenancies and higher turnover. Who's the typical renter profile here, and what's been the actual vacancy rate?
- Crime grade is F in this area — have there been break-ins, vandalism, or insurance claims at this property in the last 3 years? What carrier currently insures it and at what premium?
- What's the average days-on-market for RENTAL listings here right now (not sales)? A rising rental-DOM trend means longer vacancies and softer asking-rent achievability than the comps imply.
- What's the recent tenant-quality profile in this submarket — average credit score on applications, eviction rate, late-payment / NSF rate, and stable-employment percentage? A property-management company in the area should have these aggregated.
- How much new for-sale + rental construction is in the pipeline within 1–3 miles? Heavy new supply typically softens prices + rents 12–24 months out; constrained supply supports both.
Investment metrics
- 1% rule
- 1.27% ✓
- Cap rate
- 11.19%
- Cash-on-cash
- 17.49%
- DSCR
- 1.78
- GRM
- 6.5
CMA / ARV
No comps found within radius.
Projected returns pro-forma
-3.0% appreciation · 2.5% rent growth · sell at horizon
- IRR
- 8.3%
- Equity multiple
- 1.33×
- Total profit
- $10,928
- Equity at exit
- $17,892
- IRR
- 17.2%
- Equity multiple
- 2.38×
- Total profit
- $46,377
- Equity at exit
- $10,375
Cash invested: $33,600 (down + closing). Projections, not guarantees.
Landlord ↔ Tenant lean methodology
- Overall (STATE)
- 90 Strongly Landlord-Friendly
- State South Carolina
- 90 Strongly Landlord-Friendly · R+6
- County
- — inherits STATE
- City
- — inherits STATE
ZIP-level market 29203
- Home prices YoY
- -31.6%
- Rents YoY
- 2.5%
- Active inventory
- 238
- Price-to-rent
- 6.5×
Monthly cashflow live
- Estimated rent
- $1,528 high interval (Pro) →
- Mortgage (P&I)
- −$629
- Tax from tax record
- −$38 /mo · $460/yr
- Insurance
- −$50
- HOA
- −$0
- Vacancy / Maint / Mgmt
- −$321
- Net cashflow
- $490
Break-even live
UW: 25.0% down · 7.5% · 30yr · 1.5% tax · 5.0% vac · 8.0% maint · 8.0% mgmt
Financing live
Cash to close
- Down payment
- $30,000
- Closing costs
- $3,600
- Reserves months
- —
- Total cash needed
- —
Loan-product check · same deal, 3 products live
Conventional
25% down · 7.5% · 30yr
- Down + closing
- —
- Monthly P&I
- —
- Monthly cashflow
- —
- DSCR
- —
- Eligible?
- —
Personal DTI + credit; lowest rate.
DSCR
20% down · 8.5% · 30yr
- Down + closing
- —
- Monthly P&I
- —
- Monthly cashflow
- —
- DSCR
- —
- Eligible?
- —
No personal income docs; deal must DSCR.
Hard money
10% down · 12.0% · 12mo
- Down + closing
- —
- Monthly P&I
- —
- Monthly cashflow
- —
- DSCR
- —
- Eligible?
- —
Short-term bridge; refi at stabilization.
Rent comps 10 comps
| Address | Beds | Baths | Sqft | Rent | $/sqft | DOM | Units | Dist |
|---|---|---|---|---|---|---|---|---|
| 214 Hanover Ave Unit A Columbia, SC | 2.0 | 1.0 | 1400 | $1,450 | $1.04 | 23d | 1 | 0.40mi |
| 606 Muller Ave Columbia, SC | 2.0 | 1.0 | 1240 | $1,349 | $1.09 | 11d | 1 | 0.71mi |
| 5229 Woodbrier St Unit 504 Columbia, SC | 3.0 | 2.5 | 1360 | $1,500 | $1.10 | 23d | 1 | 0.98mi |
| 3638 Falling Springs Rd Columbia, SC | 3.0 | 2.0 | 1080 | $1,332 | $1.23 | 23d | 1 | 1.04mi |
| 4501 Bentley Dr Columbia, SC | 1.0–3.0 | 1.0–2.0 | 946 | $1,730 | $1.83 | 11d | 18 | 1.21mi |
| 1319 Hendrix St Columbia, SC | 2.0 | 1.0 | 900 | $1,050 | $1.17 | 23d | 1 | 1.28mi |
| 1800 Longcreek Dr Columbia, SC | 1.0–3.0 | 1.0–2.0 | 986 | $1,080 | $1.10 | 11d | 62 | 1.29mi |
| 1850 Atlantic Dr #524 Columbia, SC | 2.0 | 2.0 | 1630 | $2,400 | $1.47 | 14d | 1 | 1.41mi |
| 313 Cambout St Columbia, SC | 2.0 | 2.0 | 1100 | $1,450 | $1.32 | 23d | 1 | 1.43mi |
| 6408 Bishop Ave Columbia, SC | 3.0 | 2.0 | 1250 | $1,850 | $1.48 | 23d | 1 | 1.43mi |
Listing history 16 events
-
2026-06-18days on market $120,000 Active 29 DOM
-
2026-06-17days on market $120,000 Active 28 DOM
-
2026-06-16remarks 693-char remark
-
2026-06-16pricedays on market $120,000 Active 27 DOM
-
2026-06-15days on market $95,000 Active 26 DOM
-
2026-06-14days on market $95,000 Active 24 DOM
-
2026-06-10days on market $95,000 Active 21 DOM
-
2026-06-09days on market $95,000 Active 20 DOM
-
2026-06-08days on market $95,000 Active 19 DOM
-
2026-06-07days on market $95,000 Active 18 DOM
-
2026-06-03days on market $95,000 Active 14 DOM
-
2026-06-03days on market $95,000 Active 13 DOM
-
2026-06-01days on market $95,000 Active 12 DOM
-
2026-05-31days on market $95,000 Active 11 DOM
-
2026-05-23price $95,000
-
2026-05-18$128,000 Active
ⓘ Source: listings_history table (triggers on properties + properties_extension) + one-shot
backfill from property_details.listing_events for pre-trigger history.
Tax reassessment forecast SC · Resets to sale price
- Current annual tax
- $460 · $38/mo
- Projected year-2 tax
- $684 · $57/mo
- Expected delta
- +$224/yr (+$19/mo · 48.7%)
ⓘ Screening estimate from a state-policy table — verify with the county assessor before closing.
Climate risk First Street
- Flood 1/10 Low FEMA zone X (unshaded) · 0% chance over 30 yrs
- Wildfire 3/10 Moderate
- Heat 6/10 Major 7 d/yr ≥108°F today · 16 d/yr by 30 yrs out
- Wind 6/10 Major 64% chance of damaging wind over 30 yrs
- Air quality 3/10 Moderate 2 unhealthy d/yr today · 2 by 30 yrs out
Nearby sold comps map
Loading sold comps map…
Walkable amenities ~0.75 mi
Loading nearby amenities…
Taxation est. · year 1
- Rental income
- $18,338
- − Mortgage interest
- −$6,722
- − Property taxes
- −$460
- − Insurance
- −$600
- − Repairs & maintenance
- −$1,467
- − Management
- −$1,467
- − Depreciation
- −$3,491
- Taxable income
- $4,131
- Est. tax owed @ 24.0%
- −$991
- After-tax cash flow
- $4,884/yr
For passive investors: Depreciation is non-cash, so a rental often shows a tax loss while cash-flowing — sheltering income. Rental losses are passive: they offset passive income freely, and up to $25,000/yr can offset ordinary (W-2) income if you actively participate and your MAGI is under $100k (phasing out to $0 by $150k); unused losses carry forward. On sale, claimed depreciation is recaptured at up to 25%, and gains may owe capital-gains tax (a 1031 exchange can defer both). Figures are a year-1 estimate at your 24.0% rate — not tax advice; consult a CPA.
Schools (NCES district)
- District
- Richland 01
- NCES district ID
- 4503360
- Math proficiency
- 26% ▼ -7.00%
- Reading proficiency
- 36% ▼ -5.00%
- Median HH income
- $38,931
- Composite
- 25.94/100
- National rank
- #7335
- State rank
- #54 of 80 in SC
Livability — Columbia
- Score
- 78/100
- State rank
- #18
- US rank
- #2436
Category grades
Schools grade is shown separately in the Schools card above.
Census & demographics
- County
- Richland County · 389,530 people
- City population
- 335,994
- Metro
- Columbia, SC
- Population (ZIP)
- 40,653
- Household income
- $46,054
- Rent vs Own
- Severe rent burden
- 1980.0
Population outlook (Richland County) Hauer SSP2
- Today (2025)
- 459,667 people
- By 2030
- 487,524 · +6.1%
- By 2040
- 542,035 · +17.9%
- By 2050
- 595,371 · +29.5%
- By 2075
- 732,998 · +59.5%
- By 2100
- 820,415 · +78.5%
Race, ethnicity, and origin ACS 2023
- Neighborhood character
- Predominantly Black (80%)
- Race & ethnicity
- Black 80% White 13% Hispanic / Latino 5% Two or more races 2%
- Common ancestry
- Serbian 1%
- Foreign-born
- 3% · Canada
- Languages at home
- 93% English-only · Spanish 5%
Political lean MEDSL · Richland
- 2024 margin
- Solid D (+34.6) · D 66.4% · R 31.8% · Other 1.8%
- 2008→2024 swing
- +5.7pp toward D · 2008: 28.9pp · 2024: 34.6pp
- All cycles
- 2024: D+34.6 2020: D+38.3 2016: D+32.9 2012: D+33.3 2008: D+28.9
Not yet ingested
- Civics
- —
Market trends
- HPI YoY
- ▼ -77.52%
- Current HPI
- 168.2114
- Rent YoY
- ▲ 2.50%
- Metro
- Columbia, SC
- State GDP YoY
- ▲ 4.51%
- F500 in state
- 2
Industry mix (Fortune 500 HQ in SC)
| Industry | F500 HQs | Revenue |
|---|---|---|
| Packaging | 1 | $7B |
|
||
Price history
-25.8% since first listed2 events — show timeline
- 2026-05-23 Price Changed $95,000 Consolidated MLS
- 2026-05-18 Listed $128,000 Consolidated MLS
Property tax history
+1.5%/yrLatest (2025): $460 · +3.6% YoY. Source: county tax records.
Cash-flow waterfall
monthlySold comps — $/sqft
last 12 mo · ≤1 miLoading sold comps…