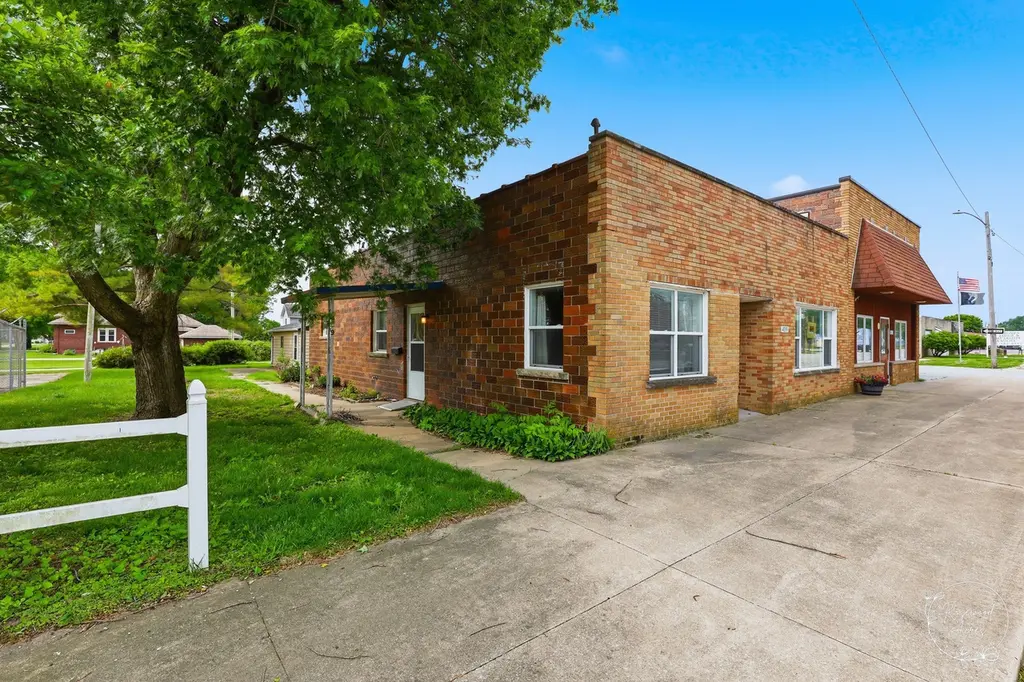
409 Main St · Crescent City, IL
Flood risk 1/10 · Minimal
- FEMA flood zone
- X (unshaded)
- Chance of flooding over 30 yrs
- 0.0%
- Est. flood insurance / yr
- $473 – $860
Fire risk 1/10 · Minimal
- Est. fire insurance / yr
- $804 – $1,492
Heat risk 3/10 · Minor
- Hot days now (above 104°F)
- 7 days/yr
- Hot days in 30 yrs
- 17 days/yr
Wind risk 2/10 · Minimal
- Chance of severe wind over 30 yrs
- 1.0%
Air-quality risk 2/10 · Minimal
- Unhealthy air days now
- 1 days/yr
- Unhealthy air days in 30 yrs
- 1 days/yr
Risk factors via First Street. Map © Google.
Why this score? — see what drove the B grade
The composite is a weighted blend of 9 inputs, each scored 0–100. Each bar is that input's sub-score; the figure is the points it added to the 100-point composite (weight × sub-score).
- Cash flow +25.7/30.0
- ARV discount +14.3/15.0
- DSCR +8.6/10.0
- 1% rule +6.6/10.0
- Appreciation +5.9/10.0
- Schools +3.7/10.0
- Livability +3.1/5.0
- Rent growth +2.5/5.0
- Condition / age +2.5/5.0
$94,900
🖨 Deal sheet 📄 Offer letter ✓ Due diligence
Listing remarks MLS
What a surprise this little place is! Right downtown, this house has 3 bedrooms, 1.5 baths, and a huge eat-in kitchen. Needs a little TLC, but it is worth a look. All appliances stay...electric range, refrigerator, washer and dryer. 2 car garage and a nice, shaded lawn. Seller willing to leave some furniture. Very economical living!
Key facts
- 6,098 sq ft lot
- 2 garage spots
- Built 1960
Property features AI
Finance
- Financial info: Special service area: No
- HOA & community: No master association fee required; Community has curbs, sidewalks and paved streets
Exterior
- Parking: Detached garage with garage door opener; Garage owned; Total parking for four vehicles; Two garage spaces; Additional off-street parking
- Utilities: Public water; Public sewer
- Home design: Detached single-family home; One-story
- Construction: Brick construction; Built approximately 61–70 years ago; Built before 1978
- Exterior features: Curbs and sidewalks; Paved street; Lot dimensions approximately 50 x 120
Interior
- Kitchen: Range; Refrigerator; Eating area / table space
- Bedrooms: Master bedroom on main level (includes a half bath); Two additional bedrooms on main level (11 x 11 and 12 x 11) with window coverings
- Flooring: Carpet in living room and bedrooms; Vinyl flooring in kitchen and foyer; Other flooring in utility room
- Bathrooms: One full bathroom; One half bathroom (in master bedroom)
- Heating & cooling: Natural gas forced-air heating; Central air conditioning
- Interior features: First-floor bedroom; First-floor full bathroom; Five total rooms; Ceiling fan(s)
- Laundry & utility: Main-level laundry; Utility room on main level (13 x 8)
Neighborhood map
What this means for you Summary
Snapshot
- This is a 3-bed/1.5-bath single-family listed at $95k.
Deal economics
- At list price, monthly cash flow is $227 ($3k/yr) — positive.
- The deal already cash-flows at list — no discount required.
- Meets the 1% rule at list price ($1k rent vs $95k).
- Recommended offer: $93k (1.5% below list) — sets the bar for market timing.
Location & tenants
- Location reads 62/100 on livability (#822 in IL) — a middle-class / working-renter tenant base. Strengths: cost of living A+, housing A+; Watch: crime D+, employment D+, amenities F.
- Crescent Iroquois CUSD 249 (rural): math 30% / reading 50% proficiency, ranked #305 of 919 in IL (top 33%) — families likely to look elsewhere, expect single-tenant / working-renter base with shorter leases.
- Market conditions: 6 active listings in the ZIP; 14 units permitted in Iroquois County in 2024 (0 in 5+ unit buildings).
Forward outlook
- In year one you build about $2k of equity ($656 loan paydown + $2k appreciation (1.9% local appreciation)).
- Iroquois County population projected at -20% by 2050 — secular population decline; favor cash flow + early exit over multi-decade hold.
- At projected returns (1.9% appreciation + 3.0% rent growth), your $27k cash investment doubles in ~5 years — after that, you're playing with house money.
Negotiation context
- It's been on market 30 days — a 2% lower offer ($93k) is reasonable based on typical stale-listing flexibility.
- 2 sale attempts since 10y ago with the ask held roughly flat each time — persistent listings suggest the price (not the market) is what's stuck; bring a comps-based counter.
- Current owner paid $29k; list at $95k implies a 227% gain — meaningful room to come down on a strong offer.
Questions for the listing agent
- Built in 1960 — when were the roof, HVAC, electrical panel, plumbing, and water heater last replaced?
- Is there a deadline driving the sale (1031 exchange, divorce, estate, relocation)? That informs how much negotiation room exists.
- Crime grade is D in this area — have there been break-ins, vandalism, or insurance claims at this property in the last 3 years? What carrier currently insures it and at what premium?
- What's the average days-on-market for RENTAL listings here right now (not sales)? A rising rental-DOM trend means longer vacancies and softer asking-rent achievability than the comps imply.
- What's the recent tenant-quality profile in this submarket — average credit score on applications, eviction rate, late-payment / NSF rate, and stable-employment percentage? A property-management company in the area should have these aggregated.
- How much new for-sale + rental construction is in the pipeline within 1–3 miles? Heavy new supply typically softens prices + rents 12–24 months out; constrained supply supports both.
Investment metrics
- 1% rule
- 1.16% ✓
- Cap rate
- 9.17%
- Cash-on-cash
- 10.27%
- DSCR
- 1.46
- GRM
- 7.2
CMA / ARV
- ARV (on-the-fly)
- $111,848
- Comps found
- 3
Show comp detail 3 sales within ~0.75 mi
| Address | Dist | Beds/Ba | Sqft | Sold | Price | $/sf | Match |
|---|---|---|---|---|---|---|---|
| 410 N Colfax St | 0.30mi | 3/1.0 | 1,356 (-1%) | 2mo | $45,000 | $33 | 81 |
| 202 N Grant St | 0.10mi | 3/1.5 | 1,456 (+7%) | 8mo | $120,000 | $82 | 77 |
| 208 Union St | 0.14mi | 3/2.0 | 1,232 (-10%) | 22mo | $160,000 | $130 | 57 |
Match score weights: distance 35% · size 25% · config 20% · recency 20%. Top-matched comps best support the ARV.
Projected returns pro-forma
1.89% appreciation · 3.0% rent growth · sell at horizon
- IRR
- 14.4%
- Equity multiple
- 1.77×
- Total profit
- $20,482
- Equity at exit
- $36,878
- IRR
- 17.0%
- Equity multiple
- 3.25×
- Total profit
- $59,728
- Equity at exit
- $52,684
Cash invested: $26,572 (down + closing). Projections, not guarantees.
Landlord ↔ Tenant lean methodology
- Overall (STATE)
- 43 Moderately Tenant-Leaning
- State Illinois
- 43 Moderately Tenant-Leaning · D+7
- County
- — inherits STATE
- City
- — inherits STATE
ZIP-level market 60928
- Home prices YoY
- 1.5%
- Active inventory
- 6
- Price-to-rent
- 7.2×
Monthly cashflow live
- Estimated rent
- $1,100 medium interval (Pro) →
- Mortgage (P&I)
- −$498
- Tax from tax record
- −$105 /mo · $1,256/yr
- Insurance
- −$40
- HOA
- −$0
- Vacancy / Maint / Mgmt
- −$231
- Net cashflow
- $227
Break-even live
UW: 25.0% down · 7.5% · 30yr · 1.5% tax · 5.0% vac · 8.0% maint · 8.0% mgmt
Financing live
Cash to close
- Down payment
- $23,725
- Closing costs
- $2,847
- Reserves months
- —
- Total cash needed
- —
Loan-product check · same deal, 3 products live
Conventional
25% down · 7.5% · 30yr
- Down + closing
- —
- Monthly P&I
- —
- Monthly cashflow
- —
- DSCR
- —
- Eligible?
- —
Personal DTI + credit; lowest rate.
DSCR
20% down · 8.5% · 30yr
- Down + closing
- —
- Monthly P&I
- —
- Monthly cashflow
- —
- DSCR
- —
- Eligible?
- —
No personal income docs; deal must DSCR.
Hard money
10% down · 12.0% · 12mo
- Down + closing
- —
- Monthly P&I
- —
- Monthly cashflow
- —
- DSCR
- —
- Eligible?
- —
Short-term bridge; refi at stabilization.
Listing history 20 events
-
2026-06-18days on market $94,900 Active 30 DOM
-
2026-06-17days on market $94,900 Active 29 DOM
-
2026-06-16days on market $94,900 Active 28 DOM
-
2026-06-15days on market $94,900 Active 27 DOM
-
2026-06-13days on market $94,900 Active 25 DOM
-
2026-06-12days on market $94,900 Active 24 DOM
-
2026-06-09days on market $94,900 Active 21 DOM
-
2026-06-08days on market $94,900 Active 20 DOM
-
2026-06-07days on market $94,900 Active 19 DOM
-
2026-06-05days on market $94,900 Active 17 DOM
-
2026-06-04days on market $94,900 Active 15 DOM
-
2026-06-02days on market $94,900 Active 14 DOM
-
2026-06-01days on market $94,900 Active 13 DOM
-
2026-05-31days on market $94,900 Active 12 DOM
-
2026-05-31days on market $94,900 Active 11 DOM
-
2026-05-19$94,900 Active
-
2016-06-03soldstatus $29,000 Closed Sale 340-char remark
Show marketing remark (340 chars)
What a surprise this little place is! Right downtown, this house has 3 bedrooms, 1.5 baths, and a huge eat-in kitchen. Needs a little TLC, but it is worth a look. All appliances stay...electric range, refrigerator, washer and dryer. 2 car garage and a nice, shaded lawn. Seller willing to leave some furniture. Very economical living!
-
2016-06-01soldstatus $9,667
-
2016-05-16status Pending 340-char remark
Show marketing remark (340 chars)
What a surprise this little place is! Right downtown, this house has 3 bedrooms, 1.5 baths, and a huge eat-in kitchen. Needs a little TLC, but it is worth a look. All appliances stay...electric range, refrigerator, washer and dryer. 2 car garage and a nice, shaded lawn. Seller willing to leave some furniture. Very economical living!
-
2016-05-06$33,900 New 340-char remark
Show marketing remark (340 chars)
What a surprise this little place is! Right downtown, this house has 3 bedrooms, 1.5 baths, and a huge eat-in kitchen. Needs a little TLC, but it is worth a look. All appliances stay...electric range, refrigerator, washer and dryer. 2 car garage and a nice, shaded lawn. Seller willing to leave some furniture. Very economical living!
ⓘ Source: listings_history table (triggers on properties + properties_extension) + one-shot
backfill from property_details.listing_events for pre-trigger history.
Tax reassessment forecast IL · Partial reset (capped growth)
- Current annual tax
- $1,256 · $105/mo
- Projected year-2 tax
- $1,705 · $142/mo
- Expected delta
- +$449/yr (+$37/mo · 35.8%)
ⓘ Screening estimate from a state-policy table — verify with the county assessor before closing.
Climate risk First Street
- Flood 1/10 Low FEMA zone X (unshaded) · 0% chance over 30 yrs
- Wildfire 1/10 Low
- Heat 3/10 Moderate 7 d/yr ≥104°F today · 17 d/yr by 30 yrs out
- Wind 2/10 Low 100% chance of damaging wind over 30 yrs
- Air quality 2/10 Low 1 unhealthy d/yr today · 1 by 30 yrs out
Nearby sold comps map
Loading sold comps map…
Walkable amenities ~0.75 mi
Loading nearby amenities…
Taxation est. · year 1
- Rental income
- $13,205
- − Mortgage interest
- −$5,316
- − Property taxes
- −$1,256
- − Insurance
- −$474
- − Repairs & maintenance
- −$1,056
- − Management
- −$1,056
- − Depreciation
- −$2,761
- Taxable income
- $1,285
- Est. tax owed @ 24.0%
- −$308
- After-tax cash flow
- $2,421/yr
For passive investors: Depreciation is non-cash, so a rental often shows a tax loss while cash-flowing — sheltering income. Rental losses are passive: they offset passive income freely, and up to $25,000/yr can offset ordinary (W-2) income if you actively participate and your MAGI is under $100k (phasing out to $0 by $150k); unused losses carry forward. On sale, claimed depreciation is recaptured at up to 25%, and gains may owe capital-gains tax (a 1031 exchange can defer both). Figures are a year-1 estimate at your 24.0% rate — not tax advice; consult a CPA.
Schools (NCES district)
- District
- Crescent Iroquois CUSD 249
- NCES district ID
- 1700323
- Math proficiency
- 30% ▲ 10.00%
- Reading proficiency
- 50% ▲ 10.00%
- Median HH income
- $54,136
- Composite
- 37.28/100
- National rank
- #8963
- State rank
- #305 of 919 in IL
Livability — Crescent City
- Score
- 62/100
- State rank
- #822
- US rank
- #16204
Category grades
Schools grade is shown separately in the Schools card above.
Census & demographics
- Census place
- Crescent City, IL
- Population (ZIP)
- 509
Population outlook (Iroquois County) Hauer SSP2
- Today (2025)
- 26,826 people
- By 2030
- 25,771 · -3.9%
- By 2040
- 23,589 · -12.1%
- By 2050
- 21,523 · -19.8%
- By 2075
- 17,998 · -32.9%
- By 2100
- 14,979 · -44.2%
Race, ethnicity, and origin ACS 2023
- Neighborhood character
- Predominantly White (91%)
- Race & ethnicity
- White 91% Hispanic / Latino 8% Two or more races 2%
- Hispanic origin (detail)
- Mexican 8%
- Common ancestry
- Lithuanian 6% Romanian 3% Iranian 2%
- Foreign-born
- 0%
Political lean MEDSL · Iroquois
- 2024 margin
- Solid R (+57.3) · D 20.6% · R 78.0% · Other 1.4%
- 2008→2024 swing
- -27.5pp toward R · 2008: -29.8pp · 2024: -57.3pp
- All cycles
- 2024: R+57.3 2020: R+56.7 2016: R+56.0 2012: R+44.7 2008: R+29.8
Not yet ingested
- Civics
- —
Market trends
- HPI YoY
- ▲ 1.89%
- Current HPI
- 128.1668
- Rent YoY
- —
- Metro
- —
- State GDP YoY
- ▲ 1.59%
- F500 in state
- 60
Industry mix (Fortune 500 HQ in IL)
| Industry | F500 HQs | Revenue |
|---|---|---|
| Insurance | 4 | $201B |
|
||
| Consumer Goods | 4 | $87B |
|
||
| Industrial Machinery | 3 | $64B |
|
||
| Healthcare | 2 | $55B |
|
||
| Retail / Pharmacy | 1 | $148B |
|
||
| Agriculture / Food | 1 | $86B |
|
||
Price history
+179.9% since first listed5 events — show timeline
- 2026-05-19 Listed $94,900 MRED as Distributed by MLS Grid
- 2016-06-03 Sold (MLS) $29,000 MRED as Distributed by MLS Grid
- 2016-06-01 Sold (Public Records) $9,667 Public Records
- 2016-05-16 Pending — MRED as Distributed by MLS Grid
- 2016-05-06 Listed $33,900 MRED as Distributed by MLS Grid
Property tax history
+45.7%/yrLatest (2024): $1,256 · +9.7% YoY. Source: county tax records.
Cash-flow waterfall
monthlySold comps — $/sqft
last 12 mo · ≤1 miLoading sold comps…