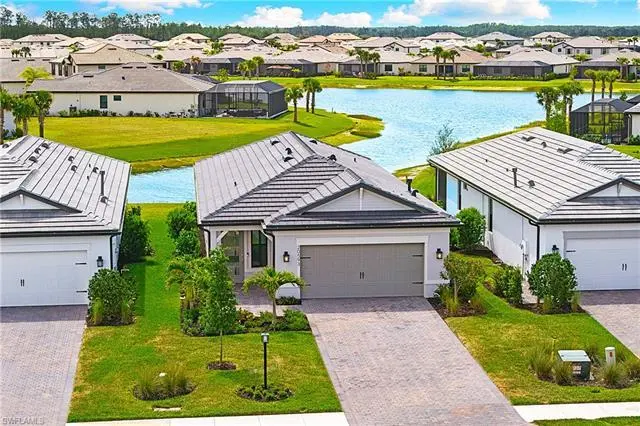
20593 Pebble Glen Dr · Estero, FL
Flood risk 1/10 · Minimal
- FEMA flood zone
- X (unshaded)
- Chance of flooding over 30 yrs
- 0.0%
- Est. flood insurance / yr
- $507 – $1,088
Fire risk 6/10 · Moderate
- Est. fire insurance / yr
- $947 – $1,759
Heat risk 9/10 · Severe
- Hot days now (above 108°F)
- 7 days/yr
- Hot days in 30 yrs
- 27 days/yr
Wind risk 10/10 · Severe
- Chance of severe wind over 30 yrs
- 99.0%
Air-quality risk 2/10 · Minimal
- Unhealthy air days now
- 1 days/yr
- Unhealthy air days in 30 yrs
- 1 days/yr
Risk factors via First Street. Map © Google.
Why this score? — see what drove the B- grade
The composite is a weighted blend of 9 inputs, each scored 0–100. Each bar is that input's sub-score; the figure is the points it added to the 100-point composite (weight × sub-score).
- Cash flow +25.1/30.0
- ARV discount +11.0/15.0
- DSCR +8.2/10.0
- 1% rule +6.7/10.0
- Condition / age +4.8/5.0
- Schools +4.1/10.0
- Livability +4.0/5.0
- Rent growth +2.1/5.0
- Appreciation +0.0/10.0
$449,000
🖨 Deal sheet 📄 Offer letter ✓ Due diligence
Listing remarks
One or more photo(s) has been virtually staged, AI generated or rendered. LONG SOUTHERLY WATER VIEWS! NO CORKSCREW ROAD NOISE TO DEAL WITH! IMMACULATE, MOVE IN READY “HALLMARK” IS NOW AVAILABLE IN VERDANA VILLAGE. All the benefits of new construction without the wait! Built by Pulte Homes in 2025, this home offers IMPACT RESISTANT WINDOWS/DOORS, 3 Bedrooms, 2 Full Baths, 2 Car Garage, 1650sf living area. This stunning residence is situated on a HIGHLY DESIRABLE WATERFRONT homesite with SOUTHEASTERN REAR EXPOSURE. The backyard is ready for you to build your own custom pool and/or a fence for your children and pets to play. The SCREENED COVERED LANAI provides a peaceful place to r
Key facts
- Waterfront homesite
- Gourmet kitchen
- Natural gas range
Tags
Property features AI
Finance
- HOA & community: Mandatory HOA; Master association fee $181 monthly; HOA fee $196.53 monthly; One-time other fee $1,700; Total annual recurring fees $4,536; Total one-time fees $5,200; Professional management; HOA maintenance includes insurance, irrigation water, lawn/land maintenance, pest control (exterior), repairs, security, street maintenance, street lights, legal/accounting, manager, and master association fee included; Community amenities include clubhouse, community pool and spa, exercise room, tennis, pickleball, bocce court, basketball, play area, cabana, barbecue/picnic, restaurant, community park, community room, sidewalk, underground utilities, private membership
Exterior
- Parking: Attached 2-car garage
- Security: Gated community with guard at gate
- Utilities: Central water; Central sewer; Natural gas available; Cable available; Electric service for heat and cooling
- Home design: Single-family residence; 1 story / ranch; Rear exposure facing southeast; Located in the Verdana Village community
- Construction: Concrete block construction; Stucco exterior finish; Tile roof; Impact-resistant doors and windows; Single-hung and sliding windows; Year built 2025
- Exterior features: Room for pool; Automatic sprinkler system; Open porch/lanai; Screened lanai/porch; Lake view/waterfront (lake); Irrigation from lake/canal; Paved private road access; Regular lot
Interior
- Kitchen: Gas available; Kitchen island; Pantry; Dishwasher; Disposal; Microwave; Range; Refrigerator/ice maker; Self-cleaning oven
- Bedrooms: 3 bedrooms with a first-floor/master-on-ground layout and split bedroom plan
- Flooring: Carpet; Tile
- Bathrooms: 2 full bathrooms; Master bath with dual sinks and shower (no tub)
- Heating & cooling: Central electric heat; Central electric cooling
- Interior features: Cable prewire; Foyer; Pantry; Smoke detectors; Window coverings; See remarks
- Laundry & utility: Laundry in residence; Washer; Dryer; Auto garage door
Neighborhood map
What this means for you Summary
Snapshot
- This is a 3-bed/2.0-bath single-family listed at $449k. Condition is rated excellent.
Deal economics
- At list price, monthly cash flow is $990 ($12k/yr) — positive.
- The deal already cash-flows at list — no discount required.
- Meets the 1% rule at list price ($5k rent vs $449k).
- Recommended offer: $436k (3.0% below list) — sets the bar for market timing.
- Cap rate 8.9% vs local median 3.4% in Estero — top-decile yield for the area; either an underpriced asset or a hidden risk that comps aren't pricing in. Stress-test before assuming the spread holds.
Location & tenants
- Location reads 79/100 on livability (#149 in FL, #2,242 nationally) — a middle-class / working-renter tenant base. Strengths: crime A+, employment A+, housing A+; Watch: amenities F, commute F, cost of living D-.
- Lee (suburban): math 47% / reading 50% proficiency, ranked #42 of 73 in FL (top 58%) — families likely to look elsewhere, expect single-tenant / working-renter base with shorter leases.
- Zoned schools: East Lee County High School (math 18% / reading 29%, grade F, #533 of 667 statewide, top 80%, 1,896 students, 61% FRL) — zoned schools at 61% FRL track the district average.
- Zoned-school proficiency averages 24% at this address vs 48% district-wide (-25 pts) — the specific schools serving this property underperform the Lee average; the district grade overstates school quality for this exact location.
- Market conditions: Rents soft (-1.4%/yr); 668 active listings in the ZIP; 20 comparable units currently listed for rent nearby; rentals at typical pace (median 24d on market — plan ~3-4 weeks tenant-placement turnaround); solid renter incomes; 15,411 units permitted in Lee County in 2024 (4,686 in 5+ unit buildings).
- At $5,265/mo this rent would consume 62% of the median local household income ($103k/yr) (locally 606% of renters already pay >50% of income on rent) — very limited rent-growth headroom before tenants either downsize or default.
Forward outlook
- Local home prices are declining (-3.0%/yr); year-one equity from $3k of loan paydown is wiped out by about $13k of value loss. Plan a longer hold.
- Lee County population projected at +44% by 2050 — long-run rental-demand tailwind backs the buy-and-hold thesis.
Negotiation context
- It's been on market 49 days — a 3% lower offer ($436k) is reasonable based on typical stale-listing flexibility.
Risks & watch-outs
- Climate carrying-cost: severe wind risk, 99% chance of damaging wind over 30y; major wildfire risk; extreme-heat days projected 7→27/yr by 2055 (HVAC capex compounding) — expect insurance premiums to compound above CPI over the hold.
Questions for the listing agent
- It's been on market 49 days. Have you received any prior offers? Is the seller open to a 3% concession, seller financing, or rate buy-down credit?
- What does the HOA fee cover, when was the last increase, and are there any pending special assessments or reserve-fund shortfalls?
- Is there a deadline driving the sale (1031 exchange, divorce, estate, relocation)? That informs how much negotiation room exists.
- Schools are A-rated — typically a magnet for longer-tenancy family renters. What's the average tenant stay here, and is there a school-zone premium baked into asking?
- What's the average days-on-market for RENTAL listings here right now (not sales)? A rising rental-DOM trend means longer vacancies and softer asking-rent achievability than the comps imply.
- What's the recent tenant-quality profile in this submarket — average credit score on applications, eviction rate, late-payment / NSF rate, and stable-employment percentage? A property-management company in the area should have these aggregated.
- How much new for-sale + rental construction is in the pipeline within 1–3 miles? Heavy new supply typically softens prices + rents 12–24 months out; constrained supply supports both.
Investment metrics
- 1% rule
- 1.17% ✓
- Cap rate
- 8.94%
- Cash-on-cash
- 9.45%
- DSCR
- 1.42
- GRM
- 7.1
CMA / ARV
- ARV (on-the-fly)
- $486,750
- Comps found
- 5
Show comp detail 5 sales within ~0.75 mi
| Address | Dist | Beds/Ba | Sqft | Sold | Price | $/sf | Match |
|---|---|---|---|---|---|---|---|
| 20604 Pebble Glen Dr | 0.05mi | 3/2.0 | 1,655 (+0%) | 19mo | $439,735 | $266 | 82 |
| 18297 Ridgeline Dr | 0.30mi | 3/2.0 | 1,677 (+2%) | 9mo | $445,000 | $265 | 76 |
| 20590 Pebble Glen Dr | 0.04mi | 2/2.0 (-1) | 1,405 (-15%) | 3mo | $437,000 | $311 | 66 |
| 20564 Pebble Glen Dr | 0.06mi | 2/2.0 (-1) | 1,405 (-15%) | 8mo | $440,000 | $313 | 61 |
| 20506 Pebble Glen Dr | 0.20mi | 2/2.0 (-1) | 1,405 (-15%) | 14mo | $415,000 | $295 | 49 |
Match score weights: distance 35% · size 25% · config 20% · recency 20%. Top-matched comps best support the ARV.
Projected returns pro-forma
-3.0% appreciation · 0.0% rent growth · sell at horizon
- IRR
- -5.5%
- Equity multiple
- 0.80×
- Total profit
- $-25,014
- Equity at exit
- $66,947
- IRR
- 0.0%
- Equity multiple
- 1.00×
- Total profit
- $269
- Equity at exit
- $38,821
Cash invested: $125,720 (down + closing). Projections, not guarantees.
Landlord ↔ Tenant lean methodology
- Overall (STATE)
- 87 Strongly Landlord-Friendly
- State Florida
- 87 Strongly Landlord-Friendly · R+3
- County
- — inherits STATE
- City
- — inherits STATE
ZIP-level market 33928
- Rents YoY
- -1.4%
- Active inventory
- 668
- Price-to-rent
- 7.1×
Monthly cashflow live
- Estimated rent
- $5,265 high interval (Pro) →
- Mortgage (P&I)
- −$2,355
- Tax from tax record
- −$251 /mo · $3,007/yr
- Insurance
- −$187
- HOA
- −$377
- Vacancy / Maint / Mgmt
- −$1,106
- Net cashflow
- $990
Break-even live
UW: 25.0% down · 7.5% · 30yr · 1.5% tax · 5.0% vac · 8.0% maint · 8.0% mgmt
Financing live
Cash to close
- Down payment
- $112,250
- Closing costs
- $13,470
- Reserves months
- —
- Total cash needed
- —
Loan-product check · same deal, 3 products live
Conventional
25% down · 7.5% · 30yr
- Down + closing
- —
- Monthly P&I
- —
- Monthly cashflow
- —
- DSCR
- —
- Eligible?
- —
Personal DTI + credit; lowest rate.
DSCR
20% down · 8.5% · 30yr
- Down + closing
- —
- Monthly P&I
- —
- Monthly cashflow
- —
- DSCR
- —
- Eligible?
- —
No personal income docs; deal must DSCR.
Hard money
10% down · 12.0% · 12mo
- Down + closing
- —
- Monthly P&I
- —
- Monthly cashflow
- —
- DSCR
- —
- Eligible?
- —
Short-term bridge; refi at stabilization.
Rent comps 20 comps
| Address | Beds | Baths | Sqft | Rent | $/sqft | DOM | Units | Dist |
|---|---|---|---|---|---|---|---|---|
| 20530 Pebble Glen Dr Estero, FL | 3.0 | 3.0 | 2099 | $5,950 | $2.83 | 24d | 1 | 0.15mi |
| 20514 Pebble Glen Dr Estero, FL | 2.0 | 2.0 | 1670 | $5,700 | $3.41 | 24d | 1 | 0.19mi |
| 18546 Ives Dr Estero, FL | 4.0 | 3.0 | 2032 | $8,250 | $4.06 | 24d | 1 | 0.23mi |
| 18315 Ridgeline Dr Estero, FL | 3.0 | 3.0 | 2202 | $3,750 | $1.70 | 16d | 1 | 0.29mi |
| 20419 Pebble Glen Dr Estero, FL | 3.0 | 2.0 | 2088 | $6,490 | $3.11 | 24d | 1 | 0.45mi |
| 20285 Napa Loop Estero, FL | 3.0 | 3.0 | 2133 | $6,200 | $2.91 | 24d | 1 | 0.48mi |
| 18282 Parksville Dr Estero, FL | 3.0 | 3.0 | 2126 | $10,000 | $4.70 | 24d | 1 | 0.63mi |
| 19278 Hinkley Dr Estero, FL | 3.0 | 3.0 | 2201 | $3,395 | $1.54 | 3d | 1 | 0.65mi |
| 18262 Parksville Dr Estero, FL | 4.0 | 3.0 | 2098 | $3,700 | $1.76 | 24d | 1 | 0.65mi |
| 20492 Verawood Loop Estero, FL | 4.0 | 3.0 | 2032 | $3,250 | $1.60 | 24d | 1 | 0.72mi |
| 20492 Verawood Loop Estero, FL | 4.0 | 3.0 | 2032 | $3,250 | $1.60 | 10d | 1 | 0.72mi |
| 19218 Hinkley Dr Estero, FL | 3.0 | 2.0 | 1655 | $3,000 | $1.81 | 14d | 1 | 0.79mi |
| 20024 Hartford Blvd Estero, FL | 3.0 | 2.0 | 2081 | $6,950 | $3.34 | 24d | 1 | 0.83mi |
| 20047 Napa Loop Estero, FL | 3.0 | 3.0 | 2202 | $9,000 | $4.09 | 3d | 1 | 0.83mi |
| 20015 Napa Loop Estero, FL | 3.0 | 3.0 | 2202 | $8,000 | $3.63 | 24d | 1 | 0.85mi |
| 21110 Verawood Loop Estero, FL | 4.0 | 3.0 | 2032 | $3,300 | $1.62 | 24d | 1 | 0.99mi |
| 19228 Gentry Pl Estero, FL | 4.0 | 3.0 | 2032 | $3,300 | $1.62 | 24d | 1 | 1.02mi |
| 19232 Gentry Pl Estero, FL | 3.0 | 3.0 | 2202 | $3,800 | $1.73 | 24d | 1 | 1.03mi |
| 19712 Deming Ln Estero, FL | 3.0 | 3.0 | 2091 | $8,500 | $4.07 | 21d | 1 | 1.36mi |
| 19701 Deming Ln Estero, FL | 4.0 | 3.0 | 2032 | $6,500 | $3.20 | 24d | 1 | 1.40mi |
HOA detail
- Monthly dues
- $377 · $4,524/yr
- Likely covers
- waterpool
Listing history 14 events
-
2026-06-17days on market $449,000 Active 49 DOM
-
2026-06-16days on market $449,000 Active 48 DOM
-
2026-06-15days on market $449,000 Active 47 DOM
-
2026-06-13days on market $449,000 Active 45 DOM
-
2026-06-10days on market $449,000 Active 42 DOM
-
2026-06-09days on market $449,000 Active 41 DOM
-
2026-06-08days on market $449,000 Active 40 DOM
-
2026-06-07days on market $449,000 Active 39 DOM
-
2026-06-03days on market $449,000 Active 35 DOM
-
2026-06-02days on market $449,000 Active 34 DOM
-
2026-06-01days on market $449,000 Active 33 DOM
-
2026-05-31days on market $449,000 Active 32 DOM
-
2026-04-29$449,000 Active
-
2024-04-01soldstatus $3,970,800
ⓘ Source: listings_history table (triggers on properties + properties_extension) + one-shot
backfill from property_details.listing_events for pre-trigger history.
Tax reassessment forecast FL · Resets to sale price
- Current annual tax
- $3,007 · $251/mo
- Projected year-2 tax
- $3,727 · $311/mo
- Expected delta
- +$720/yr (+$60/mo · 24.0%)
ⓘ Screening estimate from a state-policy table — verify with the county assessor before closing.
Climate risk First Street
- Flood 1/10 Low FEMA zone X (unshaded) · 0% chance over 30 yrs
- Wildfire 6/10 Major
- Heat 9/10 Extreme 7 d/yr ≥108°F today · 27 d/yr by 30 yrs out
- Wind 10/10 Extreme 99% chance of damaging wind over 30 yrs
- Air quality 2/10 Low 1 unhealthy d/yr today · 1 by 30 yrs out
Nearby sold comps map
Loading sold comps map…
Walkable amenities ~0.75 mi
Loading nearby amenities…
Taxation est. · year 1
- Rental income
- $63,178
- − Mortgage interest
- −$25,151
- − Property taxes
- −$3,007
- − Insurance
- −$2,245
- − Repairs & maintenance
- −$5,054
- − Management
- −$5,054
- − HOA
- −$4,524
- − Depreciation
- −$13,062
- Taxable income
- $5,081
- Est. tax owed @ 24.0%
- −$1,219
- After-tax cash flow
- $10,660/yr
For passive investors: Depreciation is non-cash, so a rental often shows a tax loss while cash-flowing — sheltering income. Rental losses are passive: they offset passive income freely, and up to $25,000/yr can offset ordinary (W-2) income if you actively participate and your MAGI is under $100k (phasing out to $0 by $150k); unused losses carry forward. On sale, claimed depreciation is recaptured at up to 25%, and gains may owe capital-gains tax (a 1031 exchange can defer both). Figures are a year-1 estimate at your 24.0% rate — not tax advice; consult a CPA.
Condition & rehab AI · 12 photos
This move-in ready home offers stunning waterfront views and modern amenities, making it an excellent investment opportunity.
Value-add opportunities
- Both Landscaping and curb appeal improvements — Enhances the home's curb appeal and can attract more buyers or renters.
- Both Custom pool or fence installation — Can increase the home's appeal and value for both buyers and renters.
- Both Add smart home features — Can increase the home's appeal and value for both buyers and renters by enhancing convenience and energy efficiency.
Renovation cost estimate screening
Value-add ROI direction
- Both Landscaping and curb appeal improvements — Enhances the home's curb appeal and can attract more buyers or renters. ↑
- Both Custom pool or fence installation — Can increase the home's appeal and value for both buyers and renters. ↑
- Both Add smart home features — Can increase the home's appeal and value for both buyers and renters by enhancing convenience and energy efficiency. ↑
ⓘ Cost ranges are severity-bucket heuristics (US national rule-of-thumb). Get contractor quotes + a written scope before underwriting a rehab budget.
Schools (NCES district)
- District
- Lee
- NCES district ID
- 1201080
- Math proficiency
- 47% ▼ -11.00%
- Reading proficiency
- 50% ▼ -4.00%
- Median HH income
- $49,518
- Composite
- 41.49/100
- National rank
- #3458
- State rank
- #42 of 73 in FL
Livability — Estero
- Score
- 79/100
- State rank
- #149
- US rank
- #2242
Category grades
Schools grade is shown separately in the Schools card above.
Census & demographics
- County
- Lee County · 788,662 people
- City population
- 130,638
- Metro
- Cape Coral-Fort Myers, FL
- Population (ZIP)
- 31,926
- Household income
- $102,624
- Rent vs Own
- Severe rent burden
- 606.0
Population outlook (Lee County) Hauer SSP2
- Today (2025)
- 871,946 people
- By 2030
- 955,468 · +9.6%
- By 2040
- 1,113,587 · +27.7%
- By 2050
- 1,256,891 · +44.1%
- By 2075
- 1,560,270 · +78.9%
- By 2100
- 1,726,848 · +98.0%
Race, ethnicity, and origin ACS 2023
- Neighborhood character
- Predominantly White (85%)
- Race & ethnicity
- White 85% Hispanic / Latino 8% Two or more races 7% Asian 3% Black 1%
- Hispanic origin (detail)
- Mexican 2% Puerto Rican 2% Cuban 1%
- Common ancestry
- Romanian 5% Lithuanian 3% Slovak 2%
- Foreign-born
- 11% · Canada, China, Jamaica
- Languages at home
- 90% English-only · Spanish 5% Other Indo-European 1% French/Haitian/Cajun 1%
Political lean MEDSL · Lee
- 2024 margin
- Strong R (+28.4) · D 35.5% · R 63.9%
- 2008→2024 swing
- -18.0pp toward R · 2008: -10.4pp · 2024: -28.4pp
- All cycles
- 2024: R+28.4 2020: R+19.2 2016: R+20.4 2012: R+16.6 2008: R+10.4
Not yet ingested
- Civics
- —
Market trends
- HPI YoY
- ▼ -109.49%
- Current HPI
- 197.5913
- Rent YoY
- ▼ -1.42%
- Metro
- Cape Coral-Fort Myers, FL
- State GDP YoY
- ▲ 3.28%
- F500 in state
- 36
Industry mix (Fortune 500 HQ in FL)
| Industry | F500 HQs | Revenue |
|---|---|---|
| Industrial Technology | 2 | $29B |
|
||
| Insurance | 2 | $17B |
|
||
| Retail | 1 | $60B |
|
||
| Technology Distribution | 1 | $58B |
|
||
| Homebuilding | 1 | $35B |
|
||
| Technology Manufacturing | 1 | $35B |
|
||
Price history
-88.7% since first listed2 events — show timeline
- 2026-04-29 Listed $449,000 NAPLESMLS
- 2024-04-01 Sold (Public Records) $3,970,800 Public Records
Property tax history
+25.5%/yrLatest (2025): $3,007 · +30.3% YoY. Source: county tax records.
Cash-flow waterfall
monthlySold comps — $/sqft
last 12 mo · ≤1 miLoading sold comps…