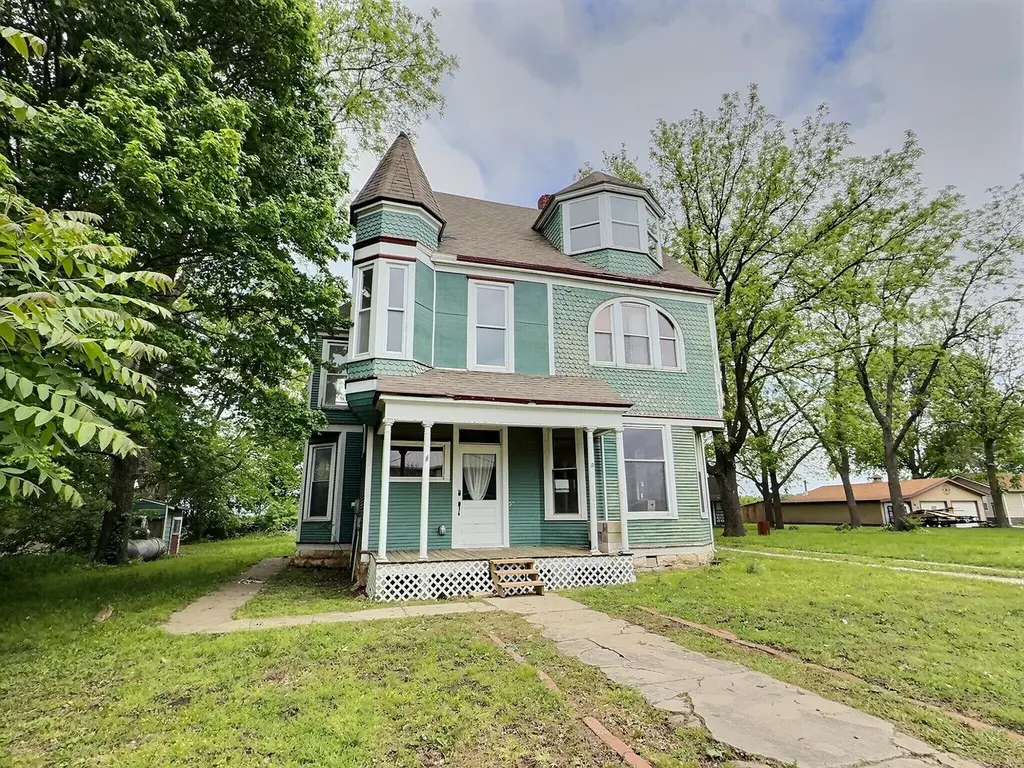
408 Vassar St · Bunceton, MO
Flood risk 1/10 · Minimal
- FEMA flood zone
- X (unshaded)
- Chance of flooding over 30 yrs
- 0.0%
- Est. flood insurance / yr
- $507 – $1,088
Fire risk 1/10 · Minimal
- Est. fire insurance / yr
- $1,054 – $1,958
Heat risk 4/10 · Minor
- Hot days now (above 106°F)
- 7 days/yr
- Hot days in 30 yrs
- 18 days/yr
Wind risk 2/10 · Minimal
- Chance of severe wind over 30 yrs
- —
Air-quality risk 2/10 · Minimal
- Unhealthy air days now
- 0 days/yr
- Unhealthy air days in 30 yrs
- 1 days/yr
Risk factors via First Street. Map © Google.
Why this score? — see what drove the D grade
The composite is a weighted blend of 9 inputs, each scored 0–100. Each bar is that input's sub-score; the figure is the points it added to the 100-point composite (weight × sub-score).
- Cash flow +13.5/30.0
- ARV discount +7.5/15.0
- Appreciation +4.8/10.0
- DSCR +4.1/10.0
- Livability +2.9/5.0
- Schools +2.8/10.0
- 1% rule +2.7/10.0
- Rent growth +2.5/5.0
- Condition / age +2.5/5.0
$125,000
🖨 Deal sheet 📄 Offer letter ✓ Due diligence
Listing remarks MLS
Circa 1888 Queen Anne Style Home sitting on a large (160x143 ft. ) level lot. Beautiful architectural design with four bedrooms, two bathrooms, formal dining room, and full basement. Beautiful wood floors and trim. Two utility buildings. Needs TLC , but could be SOOO pretty again. Selling ''AS IS''
Key facts
- 0.53 acre lot
- Built 1880
- Listed 50 days
Property features AI
Exterior
- Parking: No garage
- Utilities: Public water
- Home design: Single family residence; Residential property
- Construction: Composition roof
- Exterior features: Deck; Front porch; Composition roof
Interior
- Kitchen: Electric range
- Bedrooms: 2 total rooms
- Flooring: Wood; Vinyl
- Bathrooms: 2 full bathrooms
- Heating & cooling: Electric heating; Window air conditioning units
- Interior features: Electric range; Wood and vinyl flooring; Basement with sump pump
Neighborhood map
What this means for you Summary
Snapshot
- This is a 3-bed/2.0-bath other listed at $125k.
Deal economics
- At list price, monthly cash flow is $6 ($67/yr) — positive.
- The deal already cash-flows at list — no discount required.
- To meet the 1% rule (rent ≥ 1% of price), the offer needs to be $96k (23.5% below list).
- Recommended offer: $96k (23.5% below list) — sets the bar for 1% rule.
Location & tenants
- Location reads 57/100 on livability (#635 in MO) — a working-class tenant base; expect higher turnover. Strengths: cost of living A+, housing A+; Watch: crime F, amenities F, commute F.
- Cooper County R-IV (rural): math 20% / reading 40% proficiency, ranked #456 of 535 in MO (top 85%) — families likely to look elsewhere, expect single-tenant / working-renter base with shorter leases.
- Zoned schools: Bunceton Elem. (math 30% / reading 30%, grade F, #808 of 1,115 statewide, top 73%, 51 students, 94% FRL); Bunceton High (math 10% / reading 10%, grade F, #501 of 521 statewide, top 97%, 41 students, 93% FRL) — zoned schools average 93% FRL vs 53% district-wide (40 pts higher); higher-poverty schools than district average — tighter screening recommended.
- Market conditions: 2 active listings in the ZIP; 10 units permitted in Cooper County in 2024 (0 in 5+ unit buildings).
Forward outlook
- In year one you build about $424 of equity ($864 loan paydown + $-440 appreciation (-0.3% local appreciation)).
- Cooper County population projected to shrink 4% by 2050 — rents likely to lag national; underwrite the cash flow, not the appreciation.
Negotiation context
- It's been on market 50 days — a 3% lower offer ($121k) is reasonable based on typical stale-listing flexibility.
- 7 sale attempts since 9y ago with the ask held roughly flat each time — persistent listings suggest the price (not the market) is what's stuck; bring a comps-based counter.
Risks & watch-outs
- Watch-outs: built in 1880 — expect roof / HVAC / electrical / plumbing capex.
Questions for the listing agent
- It's been on market 50 days. Have you received any prior offers? Is the seller open to a 23% concession, seller financing, or rate buy-down credit?
- Built in 1880 — when were the roof, HVAC, electrical panel, plumbing, and water heater last replaced?
- Is there a deadline driving the sale (1031 exchange, divorce, estate, relocation)? That informs how much negotiation room exists.
- Schools are D-rated, which usually means shorter tenancies and higher turnover. Who's the typical renter profile here, and what's been the actual vacancy rate?
- Crime grade is F in this area — have there been break-ins, vandalism, or insurance claims at this property in the last 3 years? What carrier currently insures it and at what premium?
- The area grade is low — what's the realistic commute time and amenity access for the typical tenant pool here? Any planned neighborhood developments (good or bad) we should know about?
- What's the average days-on-market for RENTAL listings here right now (not sales)? A rising rental-DOM trend means longer vacancies and softer asking-rent achievability than the comps imply.
- What's the recent tenant-quality profile in this submarket — average credit score on applications, eviction rate, late-payment / NSF rate, and stable-employment percentage? A property-management company in the area should have these aggregated.
- How much new for-sale + rental construction is in the pipeline within 1–3 miles? Heavy new supply typically softens prices + rents 12–24 months out; constrained supply supports both.
Investment metrics
- 1% rule
- 0.77% ✗
- Cap rate
- 6.35%
- Cash-on-cash
- 0.19%
- DSCR
- 1.01
- GRM
- 10.9
CMA / ARV
- ARV (median comp)
- $65,389
- List price
- $125,000
- Delta
- 91.16%
- Verdict
- OVERPRICED
- Comps
- 1 within 2.0 mi
Projected returns pro-forma
-0.35% appreciation · 3.0% rent growth · sell at horizon
- IRR
- -3.4%
- Equity multiple
- 0.85×
- Total profit
- $-5,411
- Equity at exit
- $34,113
- IRR
- 2.7%
- Equity multiple
- 1.28×
- Total profit
- $9,635
- Equity at exit
- $39,302
Cash invested: $35,000 (down + closing). Projections, not guarantees.
Landlord ↔ Tenant lean methodology
- Overall (STATE)
- 81 Strongly Landlord-Friendly
- State Missouri
- 81 Strongly Landlord-Friendly · R+10
- County
- — inherits STATE
- City
- — inherits STATE
ZIP-level market 65237
- Home prices YoY
- -0.4%
- Active inventory
- 2
- Price-to-rent
- 10.9×
Monthly cashflow live
- Estimated rent
- $956 medium interval (Pro) →
- Mortgage (P&I)
- −$656
- Tax from tax record
- −$42 /mo · $508/yr
- Insurance
- −$52
- HOA
- −$0
- Vacancy / Maint / Mgmt
- −$201
- Net cashflow
- $6
Break-even live
UW: 25.0% down · 7.5% · 30yr · 1.5% tax · 5.0% vac · 8.0% maint · 8.0% mgmt
Financing live
Cash to close
- Down payment
- $31,250
- Closing costs
- $3,750
- Reserves months
- —
- Total cash needed
- —
Loan-product check · same deal, 3 products live
Conventional
25% down · 7.5% · 30yr
- Down + closing
- —
- Monthly P&I
- —
- Monthly cashflow
- —
- DSCR
- —
- Eligible?
- —
Personal DTI + credit; lowest rate.
DSCR
20% down · 8.5% · 30yr
- Down + closing
- —
- Monthly P&I
- —
- Monthly cashflow
- —
- DSCR
- —
- Eligible?
- —
No personal income docs; deal must DSCR.
Hard money
10% down · 12.0% · 12mo
- Down + closing
- —
- Monthly P&I
- —
- Monthly cashflow
- —
- DSCR
- —
- Eligible?
- —
Short-term bridge; refi at stabilization.
Listing history 33 events
-
2026-06-18days on market $125,000 Active 50 DOM
-
2026-06-17days on market $125,000 Active 49 DOM
-
2026-06-16days on market $125,000 Active 48 DOM
-
2026-06-15days on market $125,000 Active 47 DOM
-
2026-06-13days on market $125,000 Active 45 DOM
-
2026-06-12days on market $125,000 Active 44 DOM
-
2026-06-09days on market $125,000 Active 41 DOM
-
2026-06-08days on market $125,000 Active 40 DOM
-
2026-06-07days on market $125,000 Active 39 DOM
-
2026-06-05days on market $125,000 Active 37 DOM
-
2026-06-04days on market $125,000 Active 35 DOM
-
2026-06-02days on market $125,000 Active 34 DOM
-
2026-06-01days on market $125,000 Active 33 DOM
-
2026-05-31days on market $125,000 Active 32 DOM
-
2026-04-29$128,000 Active 775-char remark
-
2026-02-17status Pending
-
2025-12-08status Active
-
2025-11-24historical
-
2025-10-25price $130,000
-
2025-10-10price $150,000
-
2025-09-19price $155,000
-
2025-08-06price $162,000
-
2025-06-13$168,000 Active
-
2025-06-02historical
-
2023-10-02soldstatus
-
2023-09-06soldstatus Closed
Show marketing remark (300 chars)
Circa 1888 Queen Anne Style Home sitting on a large (160x143 ft. ) level lot. Beautiful architectural design with four bedrooms, two bathrooms, formal dining room, and full basement. Beautiful wood floors and trim. Two utility buildings. Needs TLC , but could be SOOO pretty again. Selling ''AS IS''
-
2023-08-04status Pending
Show marketing remark (300 chars)
Circa 1888 Queen Anne Style Home sitting on a large (160x143 ft. ) level lot. Beautiful architectural design with four bedrooms, two bathrooms, formal dining room, and full basement. Beautiful wood floors and trim. Two utility buildings. Needs TLC , but could be SOOO pretty again. Selling ''AS IS''
-
2023-08-02$79,900 Active
Show marketing remark (300 chars)
Circa 1888 Queen Anne Style Home sitting on a large (160x143 ft. ) level lot. Beautiful architectural design with four bedrooms, two bathrooms, formal dining room, and full basement. Beautiful wood floors and trim. Two utility buildings. Needs TLC , but could be SOOO pretty again. Selling ''AS IS''
-
2022-12-12soldstatus
-
2022-12-09soldstatus Closed
-
2022-08-03$65,000
-
2021-12-13$73,000
-
2017-03-28$79,500
ⓘ Source: listings_history table (triggers on properties + properties_extension) + one-shot
backfill from property_details.listing_events for pre-trigger history.
Tax reassessment forecast MO · Resets to sale price
- Current annual tax
- $508 · $42/mo
- Projected year-2 tax
- $1,212 · $101/mo
- Expected delta
- +$705/yr (+$59/mo · 138.9%)
ⓘ Screening estimate from a state-policy table — verify with the county assessor before closing.
Climate risk First Street
- Flood 1/10 Low FEMA zone X (unshaded) · 0% chance over 30 yrs
- Wildfire 1/10 Low
- Heat 4/10 Moderate 7 d/yr ≥106°F today · 18 d/yr by 30 yrs out
- Wind 2/10 Low
- Air quality 2/10 Low 0 unhealthy d/yr today · 1 by 30 yrs out
Nearby sold comps map
Loading sold comps map…
Walkable amenities ~0.75 mi
Loading nearby amenities…
Taxation est. · year 1
- Rental income
- $11,475
- − Mortgage interest
- −$7,002
- − Property taxes
- −$508
- − Insurance
- −$625
- − Repairs & maintenance
- −$918
- − Management
- −$918
- − Depreciation
- −$3,636
- Taxable loss
- −$2,132
- Est. tax savings @ 24.0%
- +$512
- After-tax cash flow
- $578/yr
For passive investors: Depreciation is non-cash, so a rental often shows a tax loss while cash-flowing — sheltering income. Rental losses are passive: they offset passive income freely, and up to $25,000/yr can offset ordinary (W-2) income if you actively participate and your MAGI is under $100k (phasing out to $0 by $150k); unused losses carry forward. On sale, claimed depreciation is recaptured at up to 25%, and gains may owe capital-gains tax (a 1031 exchange can defer both). Figures are a year-1 estimate at your 24.0% rate — not tax advice; consult a CPA.
Schools (NCES district)
- District
- Cooper County R-IV
- NCES district ID
- 2906150
- Math proficiency
- 20% ▬ 0.00%
- Reading proficiency
- 40% ▲ 10.00%
- Median HH income
- $42,115
- Composite
- 28.25/100
- National rank
- #12167
- State rank
- #456 of 535 in MO
Livability — Bunceton
- Score
- 57/100
- State rank
- #635
- US rank
- #21635
Category grades
Schools grade is shown separately in the Schools card above.
Census & demographics
- Census place
- Bunceton, MO
- Population (ZIP)
- 798
Population outlook (Cooper County) Hauer SSP2
- Today (2025)
- 17,611 people
- By 2030
- 17,665 · +0.3%
- By 2040
- 17,445 · -0.9%
- By 2050
- 16,916 · -3.9%
- By 2075
- 15,807 · -10.2%
- By 2100
- 13,148 · -25.3%
Race, ethnicity, and origin ACS 2023
- Neighborhood character
- Predominantly White (94%)
- Race & ethnicity
- White 94% Black 4% Two or more races 2%
- Common ancestry
- Serbian 2% Portuguese 1% Lithuanian 1%
Political lean MEDSL · Cooper
- 2024 margin
- Solid R (+45.8) · D 26.6% · R 72.4% · Other 1.1%
- 2008→2024 swing
- -22.1pp toward R · 2008: -23.8pp · 2024: -45.8pp
- All cycles
- 2024: R+45.8 2020: R+46.3 2016: R+46.3 2012: R+32.1 2008: R+23.8
Not yet ingested
- Civics
- —
Market trends
- HPI YoY
- ▼ -0.35%
- Current HPI
- 95.4125
- Rent YoY
- —
- Metro
- —
- State GDP YoY
- ▲ 1.84%
- F500 in state
- 20
Industry mix (Fortune 500 HQ in MO)
| Industry | F500 HQs | Revenue |
|---|---|---|
| Healthcare | 1 | $163B |
|
||
| Insurance | 1 | $21B |
|
||
| Industrial Technology | 1 | $17B |
|
||
| Retail | 1 | $16B |
|
||
| Industrial Distribution | 1 | $10B |
|
||
| Utilities | 1 | $9B |
|
||
Price history
+57.2% since first listed20 events — show timeline
- 2026-05-30 Price Changed $125,000 CBORMLS
- 2026-04-29 Listed $128,000 CBORMLS
- 2026-02-17 Pending — CBORMLS
- 2025-12-08 Relisted — CBORMLS
- 2025-11-24 Delisted — CBORMLS
- 2025-10-25 Price Changed $130,000 CBORMLS
- 2025-10-10 Price Changed $150,000 CBORMLS
- 2025-09-19 Price Changed $155,000 CBORMLS
- 2025-08-06 Price Changed $162,000 CBORMLS
- 2025-06-13 Listed $168,000 CBORMLS
- 2025-06-02 Coming Soon — CBORMLS
- 2023-10-02 Sold (Public Records) — Public Records
- 2023-09-06 Sold (MLS) — CMBR
- 2023-08-04 Pending — CMBR
- 2023-08-02 Listed $79,900 CMBR
- 2022-12-12 Sold (Public Records) — Public Records
- 2022-12-09 Sold (MLS) — CMBR
- 2022-08-03 Listed $65,000 CMBR
- 2021-12-13 Listed $73,000 CBORMLS
- 2017-03-28 Listed $79,500 LOBR
Property tax history
+2.4%/yrLatest (2025): $508 · +7.0% YoY. Source: county tax records.
Cash-flow waterfall
monthlySold comps — $/sqft
last 12 mo · ≤1 miLoading sold comps…