 Duplex
3140 Asbury St · Indianapolis city (balance), IN
Flood risk 1/10 · Minimal
- FEMA flood zone
- X (unshaded)
- Chance of flooding over 30 yrs
- 0.0%
- Est. flood insurance / yr
- $507 – $1,088
Fire risk 1/10 · Minimal
- Est. fire insurance / yr
- $717 – $1,331
Heat risk 3/10 · Minor
- Hot days now (above 101°F)
- 7 days/yr
- Hot days in 30 yrs
- 19 days/yr
Wind risk 2/10 · Minimal
- Chance of severe wind over 30 yrs
- 1.0%
Air-quality risk 3/10 · Minor
- Unhealthy air days now
- 2 days/yr
- Unhealthy air days in 30 yrs
- 3 days/yr
Risk factors via First Street. Map © Google.
Why this score? — see what drove the B- grade
The composite is a weighted blend of 9 inputs, each scored 0–100. Each bar is that input's sub-score; the figure is the points it added to the 100-point composite (weight × sub-score).
- Cash flow +28.7/30.0
- DSCR +10.0/10.0
- 1% rule +9.4/10.0
- ARV discount +7.5/15.0
- Rent growth +3.4/5.0
- Livability +2.5/5.0
- Condition / age +2.5/5.0
- Schools +1.4/10.0
- Appreciation +0.0/10.0
$179,000
🖨 Deal sheet 📄 Offer letter ✓ Due diligence
Multi-family units
County records classify this as Multi-Family (2-4 Unit). Listing-text estimate: 2 units. confirmed
Listing remarks MLS
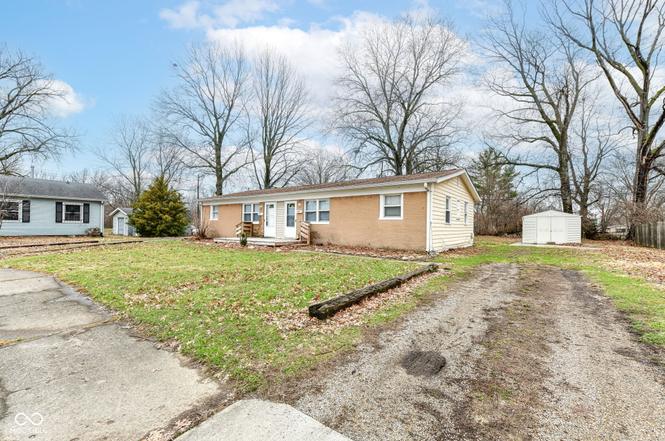
Recently renovated duplex in Perry Township, minutes away from downtown. Each side features two bedrooms, a well-appointed bathroom, and the added convenience of in-unit laundry. The home backs up to mature trees with a one car garage and a shed. Conveniently located in proximity to shopping, dining, and more!
Key facts
- Private garage
- Newer vanity
- Large storage shed
Tags
Property features AI
Finance
- Financial info: Two units total; Gross income and expenses reported as 0
Exterior
- Parking: Detached 1-car garage
- Security: Smoke detector(s)
- Utilities: Municipal water and sewer; Municipal solid waste service
- Home design: Residential income property configured as a duplex; Single-story structure; Not a conversion
- Construction: Vinyl siding with brick accents; Shingle roof; Crawl space foundation; Property gross area approximately 1,456 sq ft; Lot about 0.3 acres
- Exterior features: Exterior storage; Corner lot with mature trees, curbs, street lights and irregular lot shape; Asphalt road frontage
Interior
- Kitchen: Each unit has a 9 x 7 kitchen
- Bedrooms: Two 2-bedroom units (each on one level)
- Heating & cooling: Forced air heating; Central air conditioning
- Interior features: Smoke detectors installed
- Laundry & utility: Laundry connections available; Main-level laundry
Neighborhood map
What this means for you Summary
Snapshot
- This is a 2 × 2-bed/1.0-bath units multifamily listed at $179k.
Deal economics
- At list price, monthly cash flow is $597 ($7k/yr) — positive. Per door: $298/mo.
- The deal already cash-flows at list — no discount required.
- Meets the 1% rule at list price ($3k rent vs $179k).
- Cap rate 10.3% vs local median 4.4% in Indianapolis city (balance) — top-decile yield for the area; either an underpriced asset or a hidden risk that comps aren't pricing in. Stress-test before assuming the spread holds.
Location & tenants
- Location reads: area grade B — affects rentability + tenant quality, not the cash-flow math above.
- Indianapolis Public Schools (urban): math 14% / reading 20% proficiency, ranked #286 of 301 in IN (top 95%) — low school quality limits family demand, transient renter base, plan for 1-2y turnover; 77% free/reduced lunch — lower-income household profile, screen leases tightly.
- Market conditions: Rents rising (+3.8%/yr); 261 active listings in the ZIP; 28 comparable units currently listed for rent nearby; rentals leasing fast (median 12d on market — plan ~1-2 weeks tenant-placement turnaround); solid renter incomes; 1,906 units permitted in Marion County in 2024 (621 in 5+ unit buildings).
- This rent runs 39% of the median local income ($79k/yr) — at the standard rent-burdened threshold; future hikes will face affordability resistance.
Forward outlook
- Local home prices are declining (-3.0%/yr); year-one equity from $1k of loan paydown is wiped out by about $5k of value loss. Plan a longer hold.
- Marion County population projected at +18% by 2050 — long-run rental-demand tailwind backs the buy-and-hold thesis.
- At projected returns (-3.0% appreciation + 3.8% rent growth), your $50k cash investment doubles in ~8 years — after that, you're playing with house money.
Negotiation context
- Only 2 days on market — expect competitive offers; lowballing is unlikely to land.
- 6 sale attempts since 3y ago with the ask held roughly flat each time — persistent listings suggest the price (not the market) is what's stuck; bring a comps-based counter.
Risks & watch-outs
- Watch-outs: property tax is 2.8% of price.
Questions for the listing agent
- Can we see the unit-by-unit rent roll, current vacancy, and any below-market leases? What's the average tenancy length?
- What capital expenditures (roof, boiler, parking lot, exteriors) have been made in the last 5 years, and what's planned in the next 2?
- Built in 1960 — when were the roof, HVAC, electrical panel, plumbing, and water heater last replaced?
- Property tax is high relative to price — has the assessment been appealed recently, and will the sale trigger a re-assessment?
- Is there a deadline driving the sale (1031 exchange, divorce, estate, relocation)? That informs how much negotiation room exists.
- What's the average days-on-market for RENTAL listings here right now (not sales)? A rising rental-DOM trend means longer vacancies and softer asking-rent achievability than the comps imply.
- What's the recent tenant-quality profile in this submarket — average credit score on applications, eviction rate, late-payment / NSF rate, and stable-employment percentage? A property-management company in the area should have these aggregated.
- How much new apartment / multifamily construction is in the pipeline within 1–3 miles? Heavy new supply (>2% of stock underway) typically softens rents 12–24 months out; light construction supports rent growth.
Investment metrics
- 1% rule
- 1.44% ✓
- Cap rate
- 10.29%
- Cash-on-cash
- 14.29%
- DSCR
- 1.64
- GRM
- 5.8
CMA / ARV
No comps found within radius.
Projected returns pro-forma
-3.0% appreciation · 3.78% rent growth · sell at horizon
- IRR
- 5.7%
- Equity multiple
- 1.22×
- Total profit
- $11,197
- Equity at exit
- $26,689
- IRR
- 15.9%
- Equity multiple
- 2.35×
- Total profit
- $67,818
- Equity at exit
- $15,477
Cash invested: $50,120 (down + closing). Projections, not guarantees.
Landlord ↔ Tenant lean methodology
- Overall (STATE)
- 90 Strongly Landlord-Friendly
- State Indiana
- 90 Strongly Landlord-Friendly · R+11
- County
- — inherits STATE
- City
- — inherits STATE
ZIP-level market 46237
- Rents YoY
- 3.8%
- Active inventory
- 261
- Price-to-rent
- 11.6×
Monthly cashflow live
- Estimated rent
- $2,570 medium interval (Pro) →
- Mortgage (P&I)
- −$939
- Tax from tax record
- −$420 /mo · $5,043/yr
- Insurance
- −$75
- HOA
- −$0
- Vacancy / Maint / Mgmt
- −$540
- Net cashflow
- $597
Break-even live
2-unit breakdown (identical units grouped — click to expand)
| Units | Beds | Baths | Est. rent |
|---|---|---|---|
| 2× units | 2 | 1 | $2,570 |
| #1 | 2 | 1 | $1,285 |
| #2 | 2 | 1 | $1,285 |
| Total (2 units) | $2,570 | ||
UW: 25.0% down · 7.5% · 30yr · 1.5% tax · 5.0% vac · 8.0% maint · 8.0% mgmt
Financing live
Cash to close
- Down payment
- $44,750
- Closing costs
- $5,370
- Reserves months
- —
- Total cash needed
- —
Loan-product check · same deal, 3 products live
Conventional
25% down · 7.5% · 30yr
- Down + closing
- —
- Monthly P&I
- —
- Monthly cashflow
- —
- DSCR
- —
- Eligible?
- —
Personal DTI + credit; lowest rate.
DSCR
20% down · 8.5% · 30yr
- Down + closing
- —
- Monthly P&I
- —
- Monthly cashflow
- —
- DSCR
- —
- Eligible?
- —
No personal income docs; deal must DSCR.
Hard money
10% down · 12.0% · 12mo
- Down + closing
- —
- Monthly P&I
- —
- Monthly cashflow
- —
- DSCR
- —
- Eligible?
- —
Short-term bridge; refi at stabilization.
Rent comps 28 comps
| Address | Beds | Baths | Sqft | Rent | $/sqft | DOM | Units | Dist |
|---|---|---|---|---|---|---|---|---|
| 3146 Asbury St Indianapolis, IN | 2.0 | 1.0 | 728 | $850 | $1.17 | 7d | 1 | 0.01mi |
| 3765 S State Ave Indianapolis, IN | 2.0 | 1.0 | 700 | $995 | $1.42 | 23d | 1 | 0.52mi |
| 2948 Shelby St Unit D Indianapolis, IN | 2.0 | 1.0 | 750 | $1,025 | $1.37 | 43d | 1 | 0.61mi |
| 2469 Dawson St Indianapolis, IN | 2.0 | 1.0 | 700 | $949 | $1.36 | 3d | 4 | 0.88mi |
| 2555 Shelby St Unit 2559 Indianapolis, IN | 1.0 | 1.0 | 717 | $1,250 | $1.74 | 43d | 1 | 0.91mi |
| 2525 Shelby St Unit 1 Indianapolis, IN | 1.0 | 1.0 | 600 | $865 | $1.44 | 3d | 1 | 0.97mi |
| 2525 Shelby St Unit 4 Indianapolis, IN | 1.0 | 1.0 | 600 | $775 | $1.29 | 23d | 1 | 0.97mi |
| 1604 E Kelly St Indianapolis, IN | 2.0 | 1.0 | 750 | $1,025 | $1.37 | 17d | 1 | 1.13mi |
| 2830 S East St Indianapolis, IN | 2.0 | 1.0 | 656 | $1,200 | $1.83 | 43d | 1 | 1.16mi |
| 1409 E Tabor St Indianapolis, IN | 1.0 | 1.0 | 528 | $775 | $1.47 | 23d | 1 | 1.20mi |
| 2913 E Hanna Ave Indianapolis, IN | 1.0–2.0 | 1.0 | 717 | $1,200 | $1.67 | 23d | 1 | 1.25mi |
| 360 Sandra Ln Unit 209-B34 Indianapolis, IN | 1.0 | 1.0 | 503 | $758 | $1.51 | 20d | 1 | 1.27mi |
| 360 Sandra Ln Unit 319-D126 Indianapolis, IN | 2.0 | 1.0 | 621 | $960 | $1.55 | 3d | 1 | 1.27mi |
| 360 Sandra Ln Unit 219-B53 Indianapolis, IN | 1.0 | 1.0 | 503 | $707 | $1.41 | 23d | 1 | 1.27mi |
| 360 Sandra Ln Unit 339-C70 Indianapolis, IN | 1.0 | 1.0 | 503 | $749 | $1.49 | 4d | 1 | 1.27mi |
| 360 Sandra Ln Unit 215-B43 Indianapolis, IN | 1.0 | 1.0 | 503 | $756 | $1.50 | 23d | 1 | 1.27mi |
| 360 Sandra Ln Unit 110-062 Indianapolis, IN | 2.0 | 1.0 | 621 | $949 | $1.53 | 7d | 1 | 1.27mi |
| 360 Sandra Ln Unit 213-B38 Indianapolis, IN | 1.0 | 1.0 | 503 | $758 | $1.51 | 23d | 1 | 1.27mi |
| 360 Sandra Ln Unit 109-013 Indianapolis, IN | 2.0 | 1.0 | 621 | $1,029 | $1.66 | 4d | 1 | 1.27mi |
| 360 Sandra Ln Unit 115-044 Indianapolis, IN | 2.0 | 1.0 | 621 | $999 | $1.61 | 3d | 1 | 1.27mi |
| 360 Sandra Ln Unit 110-064 Indianapolis, IN | 2.0 | 1.0 | 621 | $961 | $1.55 | 3d | 1 | 1.27mi |
| 360 Sandra Ln Unit 320-C10 Indianapolis, IN | 1.0 | 1.0 | 503 | $808 | $1.61 | 23d | 1 | 1.27mi |
| 360 Sandra Ln Unit 314-D59 Indianapolis, IN | 2.0 | 1.0 | 621 | $1,011 | $1.63 | 3d | 1 | 1.27mi |
| 360 Sandra Ln Indianapolis, IN | 1.0–2.0 | 1.0 | 562 | $1,494 | $2.66 | 11d | 9 | 1.27mi |
| 920 E Markwood Ave Indianapolis, IN | 1.0–2.0 | 1.0 | 838 | $949 | $1.13 | 7d | 2 | 1.28mi |
| 3714 Bartlett Ave Indianapolis, IN | 1.0 | 1.0 | 576 | $969 | $1.68 | 4d | 4 | 1.36mi |
| 265 E Southern Ave Indianapolis, IN | 1.0–2.0 | 1.0 | 800 | $1,150 | $1.44 | 2d | 2 | 1.37mi |
| 272 Hoefgen St Unit 1336809P Indianapolis, IN | 2.0 | 1.0 | 592 | $2,055 | $3.47 | 2d | 1 | 1.45mi |
Listing history 3 events
-
2026-06-18days on market $179,000 Active 2 DOM
-
2026-06-16remarks 699-char remark
-
2026-06-16$179,000 Active 1 DOM
ⓘ Source: listings_history table (triggers on properties + properties_extension) + one-shot
backfill from property_details.listing_events for pre-trigger history.
Tax reassessment forecast IN · Partial reset (capped growth)
- Current annual tax
- $5,043 · $420/mo
- Projected year-2 tax
- $5,043 · $420/mo
- Expected delta
- $0/yr ($0/mo · 0.0%)
ⓘ Screening estimate from a state-policy table — verify with the county assessor before closing.
Climate risk First Street
- Flood 1/10 Low FEMA zone X (unshaded) · 0% chance over 30 yrs
- Wildfire 1/10 Low
- Heat 3/10 Moderate 7 d/yr ≥101°F today · 19 d/yr by 30 yrs out
- Wind 2/10 Low 100% chance of damaging wind over 30 yrs
- Air quality 3/10 Moderate 2 unhealthy d/yr today · 3 by 30 yrs out
Nearby sold comps map
Loading sold comps map…
Walkable amenities ~0.75 mi
Loading nearby amenities…
Taxation est. · year 1
- Rental income
- $30,840
- − Mortgage interest
- −$10,027
- − Property taxes
- −$5,043
- − Insurance
- −$895
- − Repairs & maintenance
- −$2,467
- − Management
- −$2,467
- − Depreciation
- −$5,207
- Taxable income
- $4,734
- Est. tax owed @ 24.0%
- −$1,136
- After-tax cash flow
- $6,026/yr
For passive investors: Depreciation is non-cash, so a rental often shows a tax loss while cash-flowing — sheltering income. Rental losses are passive: they offset passive income freely, and up to $25,000/yr can offset ordinary (W-2) income if you actively participate and your MAGI is under $100k (phasing out to $0 by $150k); unused losses carry forward. On sale, claimed depreciation is recaptured at up to 25%, and gains may owe capital-gains tax (a 1031 exchange can defer both). Figures are a year-1 estimate at your 24.0% rate — not tax advice; consult a CPA.
Schools (NCES district)
- District
- Indianapolis Public Schools
- NCES district ID
- 1804770
- Math proficiency
- 14% ▼ -7.00%
- Reading proficiency
- 20% ▼ -3.00%
- Median HH income
- $32,034
- Composite
- 13.69/100
- National rank
- #9499
- State rank
- #286 of 301 in IN
Livability — Indianapolis city (balance)
No livability data for this city. (Only ~50 U.S. cities are tracked.)
Census & demographics
- Census place
- Indianapolis city (balance), IN
- County
- Marion County · 998,460 people
- City population
- 881,119
- Metro
- Indianapolis-Carmel-Anderson, IN
- Population (ZIP)
- 43,473
- Household income
- $79,078
- Rent vs Own
- Severe rent burden
- 1245.0
Population outlook (Marion County) Hauer SSP2
- Today (2025)
- 1,025,572 people
- By 2030
- 1,065,727 · +3.9%
- By 2040
- 1,141,577 · +11.3%
- By 2050
- 1,208,920 · +17.9%
- By 2075
- 1,367,288 · +33.3%
- By 2100
- 1,438,201 · +40.2%
Race, ethnicity, and origin ACS 2023
- Neighborhood character
- Predominantly White (71%)
- Race & ethnicity
- White 71% Asian 13% Hispanic / Latino 7% Two or more races 6% Black 5%
- Hispanic origin (detail)
- Mexican 6%
- Common ancestry
- Italian 2% Lithuanian 2% Romanian 2%
- Foreign-born
- 12% · Canada, Philippines
- Languages at home
- 84% English-only · Other Asian/Pacific 5% Spanish 5% Other Indo-European 4%
Political lean MEDSL · Marion
- 2024 margin
- Strong D (+27.7) · D 63.0% · R 35.3% · Other 1.7%
- 2008→2024 swing
- -0.7pp no change · 2008: 28.4pp · 2024: 27.7pp
- All cycles
- 2024: D+27.7 2020: D+29.1 2016: D+22.8 2012: D+22.2 2008: D+28.4
Not yet ingested
- Civics
- —
Market trends
- HPI YoY
- ▼ -180.33%
- Current HPI
- 238.9661
- Rent YoY
- ▲ 3.78%
- Metro
- Indianapolis-Carmel-Anderson, IN
- State GDP YoY
- ▲ 2.90%
- F500 in state
- 18
Industry mix (Fortune 500 HQ in IN)
| Industry | F500 HQs | Revenue |
|---|---|---|
| Industrial Machinery | 2 | $37B |
|
||
| Healthcare | 1 | $177B |
|
||
| Pharmaceuticals | 1 | $45B |
|
||
| Metals / Steel | 1 | $18B |
|
||
| Agriculture | 1 | $17B |
|
||
| Packaging | 1 | $12B |
|
||
Price history
+11.9% since first listed16 events — show timeline
- 2026-06-16 Listed $179,000 MIBOR as Distributed by MLS Grid
- 2025-07-28 Pending — MIBOR as Distributed by MLS Grid
- 2025-05-09 Listing Removed — MIBOR as Distributed by MLS Grid
- 2025-05-09 Listing Removed — MIBOR as Distributed by MLS Grid
- 2025-03-13 Price Changed $194,900 MIBOR as Distributed by MLS Grid
- 2025-02-26 Relisted — MIBOR as Distributed by MLS Grid
- 2025-02-11 Pending — MIBOR as Distributed by MLS Grid
- 2025-01-31 Listed $199,900 MIBOR as Distributed by MLS Grid
- 2024-12-11 Rental Removed $999 MIBOR
- 2024-10-12 Listed for Rent $999 MIBOR
- 2024-04-26 Rental Removed $899 MIBOR
- 2024-04-05 Price Changed $899 MIBOR
- 2024-02-03 Listed for Rent $999 MIBOR
- 2023-09-21 Sold (MLS) $160,000 MIBOR as Distributed by MLS Grid
- 2023-08-20 Pending — MIBOR as Distributed by MLS Grid
- 2023-08-17 Listed $160,000 MIBOR as Distributed by MLS Grid
Property tax history
+6.6%/yrLatest (2025): $5,043 · +13.4% YoY. Source: county tax records.
Cash-flow waterfall
monthlySold comps — $/sqft
last 12 mo · ≤1 miLoading sold comps…