15607 Sheldon Ridge Way · Sheldon, TX
Flood risk 8/10 · Major
- FEMA flood zone
- X (unshaded)
- Chance of flooding over 30 yrs
- 0.99%
- Est. flood insurance / yr
- $507 – $1,088
Fire risk 5/10 · Moderate
- Est. fire insurance / yr
- $1,222 – $2,270
Heat risk 9/10 · Severe
- Hot days now (above 109°F)
- 7 days/yr
- Hot days in 30 yrs
- 25 days/yr
Wind risk 9/10 · Severe
- Chance of severe wind over 30 yrs
- 99.0%
Air-quality risk 2/10 · Minimal
- Unhealthy air days now
- 2 days/yr
- Unhealthy air days in 30 yrs
- 2 days/yr
Risk factors via First Street. Map © Google.
Why this score? — see what drove the D- grade
The composite is a weighted blend of 9 inputs, each scored 0–100. Each bar is that input's sub-score; the figure is the points it added to the 100-point composite (weight × sub-score).
- ARV discount +15.0/15.0
- Cash flow +6.2/30.0
- Appreciation +4.2/10.0
- Livability +3.3/5.0
- 1% rule +3.2/10.0
- Rent growth +2.7/5.0
- Condition / age +2.5/5.0
- Schools +2.0/10.0
- DSCR +0.5/10.0
$279,000
🖨 Deal sheet 📄 Offer letter ✓ Due diligence
Listing remarks MLS
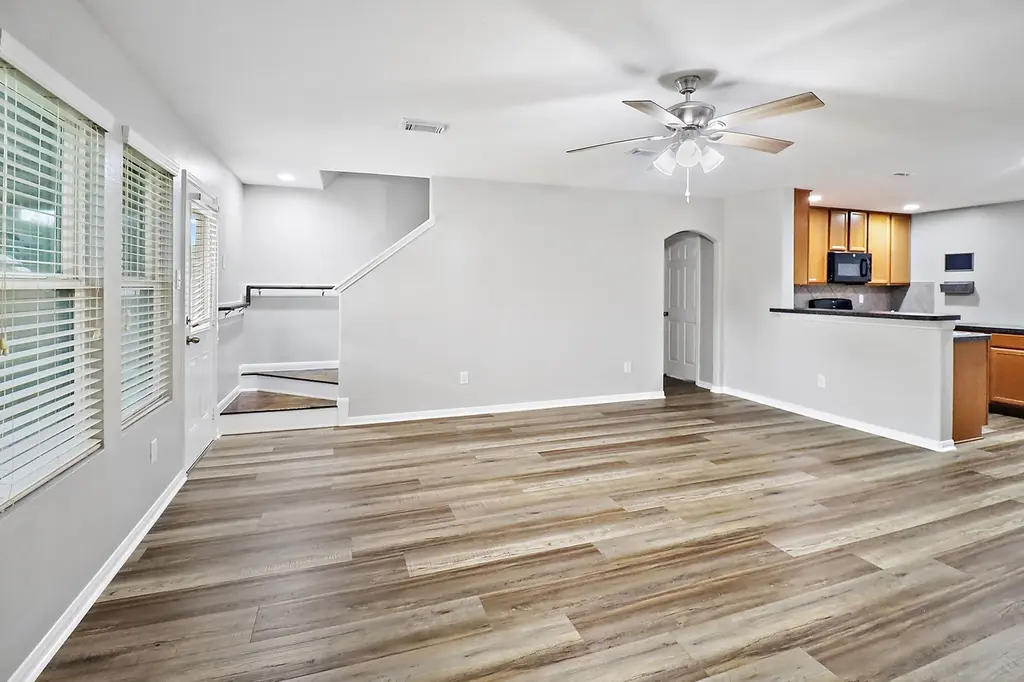
Open island kitchen with lots of counter space, tile back splash. Master suite is downstairs and includes an over sized shower with double vanity sinks. Radiant barrier/tech shield roof decking, 2' inch faux wood blinds, vinyl double pane tilt out windows, covered concrete patio, and much more!!!!! READY NOW!!
Key facts
- New flooring
- Updated home
- Wood stairs
Tags
Property features AI
Finance
- Other: Seller indicates lease not considered
- HOA & community: Sheldon Ridge HOA with annual fee of $345
Exterior
- Parking: Attached garage; 2 garage spaces
- Security: Smoke detectors
- Utilities: Public water; Public sewer
- Home design: Residential property; Built in 2016; Slab foundation; Composition roof
- Construction: Brick and cement siding exterior
- Exterior features: Fenced backyard; Subdivision lot
Interior
- Kitchen: Dishwasher; Disposal; Gas oven; Gas range; Microwave; Refrigerator
- Bedrooms: Primary bedroom on first floor (13x14); Bedroom on second floor (13x17); Bedroom on second floor (11x13); Bedroom on second floor (11x12); Game room on second floor (12x19) — can function as additional bedroom/bonus space
- Flooring: Carpet; Tile
- Bathrooms: 2 full bathrooms; 1 half bathroom
- Heating & cooling: Central heating (gas); Central air conditioning (electric)
- Interior features: Double vanity; Kitchen/family room combo; Primary bathroom; Pantry; Soaking tub; Separate shower; Ceiling fans; Kitchen/dining combo
- Laundry & utility: Washer hookup; Electric dryer hookup; Gas dryer hookup
Neighborhood map
What this means for you Summary
Snapshot
- This is a 4-bed/2.5-bath single-family listed at $279k.
Deal economics
- At list price, monthly cash flow is $-572 ($-7k/yr) — negative.
- To cash-flow at today's rent, offer at most $178k (36.2% below list).
- To meet the 1% rule (rent ≥ 1% of price), the offer needs to be $230k (17.6% below list).
- Recommended offer: $178k (36.2% below list) — sets the bar for cash-flow.
Location & tenants
- Location reads 66/100 on livability (#605 in TX) — a middle-class / working-renter tenant base. Strengths: cost of living A+, housing A+, crime B+; Watch: amenities F, commute F.
- Sheldon ISD (suburban): math 19% / reading 25% proficiency, ranked #746 of 826 in TX (top 90%) — low school quality limits family demand, transient renter base, plan for 1-2y turnover; 72% free/reduced lunch — lower-income household profile, screen leases tightly.
- Zoned schools: Michael R Null Middle (math 15% / reading 23%, grade F, #1,466 of 1,662 statewide, top 89%, 1,164 students, 89% FRL) — zoned schools average 89% FRL vs 72% district-wide (17 pts higher); higher-poverty schools than district average — tighter screening recommended.
- Market conditions: Rents flat; 337 active listings in the ZIP; solid renter incomes; 29,883 units permitted in Harris County in 2024 (8,621 in 5+ unit buildings).
Forward outlook
- Local home prices are declining (-1.6%/yr); year-one equity from $2k of loan paydown is wiped out by about $4k of value loss. Plan a longer hold.
- Harris County population projected at +47% by 2050 — long-run rental-demand tailwind backs the buy-and-hold thesis.
Negotiation context
- It's been on market 36 days — a 3% lower offer ($271k) is reasonable based on typical stale-listing flexibility.
- 3 sale attempts since 10y ago with the ask held roughly flat each time — persistent listings suggest the price (not the market) is what's stuck; bring a comps-based counter.
Risks & watch-outs
- Watch-outs: property tax is 3.1% of price; flood insurance adds $66/mo.
- Climate carrying-cost: severe flood risk; severe wind risk, 99% chance of damaging wind over 30y; moderate wildfire risk; extreme-heat days projected 7→25/yr by 2055 (HVAC capex compounding) — expect insurance premiums to compound above CPI over the hold.
Questions for the listing agent
- What do current leases actually rent for vs. the listed asking? Can we see a recent rent roll and the last 12 months of T-12 income?
- It's been on market 36 days. Have you received any prior offers? Is the seller open to a 36% concession, seller financing, or rate buy-down credit?
- Property tax is high relative to price — has the assessment been appealed recently, and will the sale trigger a re-assessment?
- What's the actual annual flood-insurance premium (NFIP or private), and is the property in a SFHA with mandatory coverage?
- What does the HOA fee cover, when was the last increase, and are there any pending special assessments or reserve-fund shortfalls?
- Is there a deadline driving the sale (1031 exchange, divorce, estate, relocation)? That informs how much negotiation room exists.
- Schools are F-rated, which usually means shorter tenancies and higher turnover. Who's the typical renter profile here, and what's been the actual vacancy rate?
- The area grade is low — what's the realistic commute time and amenity access for the typical tenant pool here? Any planned neighborhood developments (good or bad) we should know about?
- What's the average days-on-market for RENTAL listings here right now (not sales)? A rising rental-DOM trend means longer vacancies and softer asking-rent achievability than the comps imply.
- What's the recent tenant-quality profile in this submarket — average credit score on applications, eviction rate, late-payment / NSF rate, and stable-employment percentage? A property-management company in the area should have these aggregated.
- How much new for-sale + rental construction is in the pipeline within 1–3 miles? Heavy new supply typically softens prices + rents 12–24 months out; constrained supply supports both.
Investment metrics
- 1% rule
- 0.82% ✗
- Cap rate
- 4.12%
- Cash-on-cash
- -7.76%
- DSCR
- 0.65
- GRM
- 10.1
CMA / ARV
- ARV (median comp)
- $346,825
- List price
- $279,000
- Delta
- -19.56%
- Verdict
- UNDERPRICED
- Comps
- 20 within 1.0 mi
Show comp detail 12 sales within ~0.75 mi
| Address | Dist | Beds/Ba | Sqft | Sold | Price | $/sf | Match |
|---|---|---|---|---|---|---|---|
| 11346 Cascading Stream Way | 0.34mi | 4/2.5 | 2,378 (+2%) | 2mo | $282,500 | $119 | 78 |
| 11307 Brandy Ln | 0.18mi | 3/2.5 (-1) | 2,334 (+1%) | 9mo | $459,900 | $197 | 78 |
| 15826 Sheldon Ridge Way | 0.25mi | 4/2.5 | 2,374 (+2%) | 11mo | $243,000 | $102 | 75 |
| 11026 E Early Dusk Cir | 0.06mi | 4/2.5 | 1,999 (-14%) | 10mo | $219,000 | $110 | 66 |
| 15239 Statice Trl | 0.32mi | 4/3.5 | 2,489 (+7%) | 9mo | $368,990 | $148 | 61 |
| 15319 Meandering Post Trl | 0.43mi | 4/2.5 | 2,559 (+10%) | 6mo | $260,000 | $102 | 58 |
| 15307 Meandering Post Trl | 0.45mi | 5/3.5 (+1) | 2,469 (+6%) | 2mo | $325,000 | $132 | 57 |
| 11107 Snapdragon Field Dr | 0.32mi | 3/2.5 (-1) | 2,117 (-9%) | 13mo | $333,990 | $158 | 55 |
| 11111 Snapdragon Field Dr | 0.31mi | 3/2.5 (-1) | 2,659 (+15%) | 11mo | $377,175 | $142 | 47 |
| 11127 Gardenia Creek Dr | 0.50mi | 5/3.5 (+1) | 2,532 (+9%) | 11mo | $383,085 | $151 | 44 |
| 15323 Statice Trl | 0.27mi | 5/4.0 (+1) | 2,657 (+14%) | 15mo | $416,575 | $157 | 40 |
| 15235 Statice Trl | 0.40mi | 3/2.5 (-1) | 2,657 (+14%) | 15mo | $398,175 | $150 | 40 |
Match score weights: distance 35% · size 25% · config 20% · recency 20%. Top-matched comps best support the ARV.
Projected returns pro-forma
-1.59% appreciation · 0.92% rent growth · sell at horizon
- IRR
- -22.7%
- Equity multiple
- 0.12×
- Total profit
- $-69,118
- Equity at exit
- $59,586
- IRR
- -19.9%
- Equity multiple
- -0.39×
- Total profit
- $-108,940
- Equity at exit
- $56,172
Cash invested: $78,120 (down + closing). Projections, not guarantees.
Landlord ↔ Tenant lean methodology
- Overall (STATE)
- 87 Strongly Landlord-Friendly
- State Texas
- 87 Strongly Landlord-Friendly · R+5
- County
- — inherits STATE
- City
- — inherits STATE
ZIP-level market 77044
- Home prices YoY
- -0.7%
- Rents YoY
- 0.9%
- Active inventory
- 337
- Price-to-rent
- 10.1×
Monthly cashflow live
- Estimated rent
- $2,299 medium interval (Pro) →
- Mortgage (P&I)
- −$1,463
- Tax from tax record
- −$713 /mo · $8,561/yr
- Insurance
- −$116
- Flood insurance flood zone
- −$66 /mo · $798/yr
- HOA
- −$29
- Vacancy / Maint / Mgmt
- −$483
- Net cashflow
- $-572
Break-even live
UW: 25.0% down · 7.5% · 30yr · 1.5% tax · 5.0% vac · 8.0% maint · 8.0% mgmt
Financing live
Cash to close
- Down payment
- $69,750
- Closing costs
- $8,370
- Reserves months
- —
- Total cash needed
- —
Loan-product check · same deal, 3 products live
Conventional
25% down · 7.5% · 30yr
- Down + closing
- —
- Monthly P&I
- —
- Monthly cashflow
- —
- DSCR
- —
- Eligible?
- —
Personal DTI + credit; lowest rate.
DSCR
20% down · 8.5% · 30yr
- Down + closing
- —
- Monthly P&I
- —
- Monthly cashflow
- —
- DSCR
- —
- Eligible?
- —
No personal income docs; deal must DSCR.
Hard money
10% down · 12.0% · 12mo
- Down + closing
- —
- Monthly P&I
- —
- Monthly cashflow
- —
- DSCR
- —
- Eligible?
- —
Short-term bridge; refi at stabilization.
HOA detail
- Monthly dues
- $29 · $348/yr
Listing history 19 events
-
2026-06-18days on market $279,000 Active 36 DOM
-
2026-06-17days on market $279,000 Active 35 DOM
-
2026-06-16days on market $279,000 Active 34 DOM
-
2026-06-15days on market $279,000 Active 33 DOM
-
2026-06-13days on market $279,000 Active 31 DOM
-
2026-06-09days on market $279,000 Active 27 DOM
-
2026-06-08days on market $279,000 Active 26 DOM
-
2026-06-07days on market $279,000 Active 25 DOM
-
2026-06-04days on market $279,000 Active 22 DOM
-
2026-06-03days on market $279,000 Active 21 DOM
-
2026-06-02days on market $279,000 Active 20 DOM
-
2026-06-01days on market $279,000 Active 19 DOM
-
2026-05-31days on market $279,000 Active 18 DOM
-
2026-05-13historical
-
2026-05-13$279,000 Active 644-char remark
-
2026-04-02$289,900 Active
-
2016-09-29soldstatus Sold
Show marketing remark (311 chars)
Open island kitchen with lots of counter space, tile back splash. Master suite is downstairs and includes an over sized shower with double vanity sinks. Radiant barrier/tech shield roof decking, 2' inch faux wood blinds, vinyl double pane tilt out windows, covered concrete patio, and much more!!!!! READY NOW!!
-
2016-09-14status Pending
Show marketing remark (311 chars)
Open island kitchen with lots of counter space, tile back splash. Master suite is downstairs and includes an over sized shower with double vanity sinks. Radiant barrier/tech shield roof decking, 2' inch faux wood blinds, vinyl double pane tilt out windows, covered concrete patio, and much more!!!!! READY NOW!!
-
2016-07-07$186,406 Active
Show marketing remark (311 chars)
Open island kitchen with lots of counter space, tile back splash. Master suite is downstairs and includes an over sized shower with double vanity sinks. Radiant barrier/tech shield roof decking, 2' inch faux wood blinds, vinyl double pane tilt out windows, covered concrete patio, and much more!!!!! READY NOW!!
ⓘ Source: listings_history table (triggers on properties + properties_extension) + one-shot
backfill from property_details.listing_events for pre-trigger history.
Tax reassessment forecast TX · Resets to sale price
- Current annual tax
- $8,561 · $713/mo
- Projected year-2 tax
- $8,561 · $713/mo
- Expected delta
- $0/yr ($0/mo · 0.0%)
ⓘ Screening estimate from a state-policy table — verify with the county assessor before closing.
Climate risk First Street
- Flood 8/10 Severe FEMA zone X (unshaded) · 99% chance over 30 yrs
- Wildfire 5/10 Major
- Heat 9/10 Extreme 7 d/yr ≥109°F today · 25 d/yr by 30 yrs out
- Wind 9/10 Extreme 99% chance of damaging wind over 30 yrs
- Air quality 2/10 Low 2 unhealthy d/yr today · 2 by 30 yrs out
Nearby sold comps map
Loading sold comps map…
Walkable amenities ~0.75 mi
Loading nearby amenities…
Taxation est. · year 1
- Rental income
- $27,591
- − Mortgage interest
- −$15,628
- − Property taxes
- −$8,561
- − Insurance
- −$2,192
- − Repairs & maintenance
- −$2,207
- − Management
- −$2,207
- − HOA
- −$348
- − Depreciation
- −$8,116
- Taxable loss
- −$11,669
- Est. tax savings @ 24.0%
- +$2,801
- After-tax cash flow
- $-4,061/yr
For passive investors: Depreciation is non-cash, so a rental often shows a tax loss while cash-flowing — sheltering income. Rental losses are passive: they offset passive income freely, and up to $25,000/yr can offset ordinary (W-2) income if you actively participate and your MAGI is under $100k (phasing out to $0 by $150k); unused losses carry forward. On sale, claimed depreciation is recaptured at up to 25%, and gains may owe capital-gains tax (a 1031 exchange can defer both). Figures are a year-1 estimate at your 24.0% rate — not tax advice; consult a CPA.
Schools (NCES district)
- District
- Sheldon ISD
- NCES district ID
- 4839990
- Math proficiency
- 19% ▼ -18.00%
- Reading proficiency
- 25% ▼ -10.00%
- Median HH income
- $49,443
- Composite
- 19.5/100
- National rank
- #8772
- State rank
- #746 of 826 in TX
Livability — Sheldon
- Score
- 66/100
- State rank
- #605
- US rank
- #11469
Category grades
Schools grade is shown separately in the Schools card above.
Census & demographics
- County
- Harris County · 4,702,590 people
- Metro
- Houston-The Woodlands-Sugar Land, TX
- Population (ZIP)
- 58,347
- Household income
- $95,000
- Rent vs Own
- Severe rent burden
- 1332.0
Population outlook (Harris County) Hauer SSP2
- Today (2025)
- 5,571,493 people
- By 2030
- 6,089,821 · +9.3%
- By 2040
- 7,142,806 · +28.2%
- By 2050
- 8,185,864 · +46.9%
- By 2075
- 10,574,329 · +89.8%
- By 2100
- 12,109,958 · +117.4%
Race, ethnicity, and origin ACS 2023
- Neighborhood character
- Diverse neighborhood (Simpson 0.66)
- Race & ethnicity
- Hispanic / Latino 44% Black 32% White 19% Two or more races 18% Native American 2% Asian 1%
- Hispanic origin (detail)
- Mexican 36%
- Common ancestry
- Lithuanian 1% Romanian 1% Iranian 1%
- Foreign-born
- 18% · Canada
- Languages at home
- 61% English-only · Spanish 35% French/Haitian/Cajun 1% Other Indo-European 1%
Political lean MEDSL · Harris
- 2024 margin
- Lean D (+5.5) · D 52.0% · R 46.4% · Other 1.6%
- 2008→2024 swing
- +3.9pp toward D · 2008: 1.6pp · 2024: 5.5pp
- All cycles
- 2024: D+5.5 2020: D+13.3 2016: D+12.4 2012: D+0.1 2008: D+1.6
Not yet ingested
- Civics
- —
Market trends
- HPI YoY
- ▼ -1.59%
- Current HPI
- 215.5736
- Rent YoY
- ▲ 0.92%
- Metro
- Houston-The Woodlands-Sugar Land, TX
- State GDP YoY
- ▲ 3.95%
- F500 in state
- 110
Industry mix (Fortune 500 HQ in TX)
| Industry | F500 HQs | Revenue |
|---|---|---|
| Energy | 16 | $1,198B |
|
||
| Technology | 5 | $198B |
|
||
| Engineering / Construction | 4 | $72B |
|
||
| Energy Services | 3 | $60B |
|
||
| Utilities | 3 | $41B |
|
||
| Healthcare | 2 | $330B |
|
||
Price history
+49.7% since first listed6 events — show timeline
- 2026-05-13 Listed $279,000 HARMLS
- 2026-05-13 Listing Removed — HARMLS
- 2026-04-02 Listed $289,900 HARMLS
- 2016-09-29 Sold (MLS) — HARMLS
- 2016-09-14 Pending — HARMLS
- 2016-07-07 Listed $186,406 HARMLS
Property tax history
+3.6%/yrLatest (2025): $8,561 · +1.4% YoY. Source: county tax records.
Cash-flow waterfall
monthlySold comps — $/sqft
last 12 mo · ≤1 miLoading sold comps…