1522 Hibiscus St · Columbia, SC
Flood risk 6/10 · Moderate
- FEMA flood zone
- X
- Chance of flooding over 30 yrs
- 0.98%
- Est. flood insurance / yr
- $435 – $905
Fire risk 2/10 · Minimal
- Est. fire insurance / yr
- $783 – $1,453
Heat risk 7/10 · Major
- Hot days now (above threshold)
- 7 days/yr
- Hot days in 30 yrs
- 16 days/yr
Wind risk No data
- Chance of severe wind over 30 yrs
- —
Air-quality risk No data
- Unhealthy air days now
- —
- Unhealthy air days in 30 yrs
- —
Risk factors via First Street. Map © Google.
Why this score? — see what drove the C grade
The composite is a weighted blend of 9 inputs, each scored 0–100. Each bar is that input's sub-score; the figure is the points it added to the 100-point composite (weight × sub-score).
- Cash flow +16.4/30.0
- ARV discount +15.0/15.0
- DSCR +5.1/10.0
- Appreciation +5.0/10.0
- Livability +3.9/5.0
- 1% rule +3.2/10.0
- Schools +2.6/10.0
- Rent growth +2.5/5.0
- Condition / age +2.5/5.0
$170,000
🖨 Deal sheet 📄 Offer letter ✓ Due diligence
Listing remarks
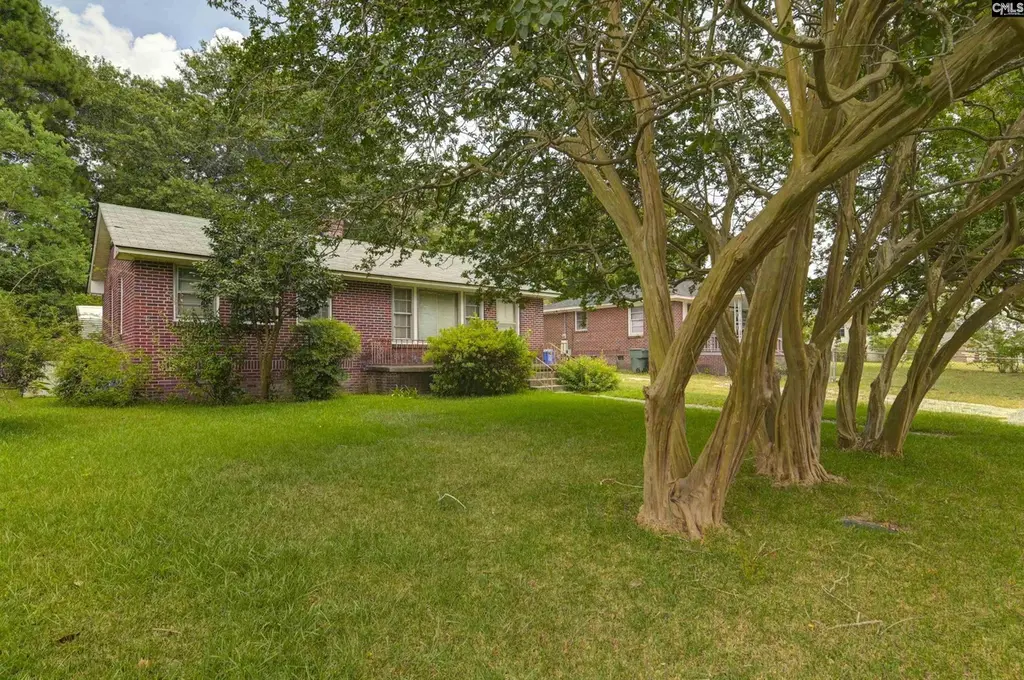
Back on the market! No fault of Seller or Home. Investor's dream in the heart of Rosewood! This charming all-brick bungalow offers timeless appeal, flexible living space, and excellent location in and established, well-kept neighborhood zoned for Richland One Schools including Dreher High School, Kilbourn Elementary and Hand Middle. with 2 bedrooms and a flex room that can serve as a third bedroom, den, dining room or home office this 1,110 square foot home adapts easily to your lifestyle or rental needs. Features include electric heat and air, storm windows & doors, cable TV available and a new roof for peace of mind. Fresh Paint in bathroom and two bedrooms. The home sits on a fla
Key facts
- Flat rear fenced lot
- Excellent location
- All brick bungalow
Tags
Property features AI
Finance
- Other: Cable TV available
Exterior
- Parking: 4 parking spaces
- Utilities: Public water; Septic with public sewer available
- Home design: Single-story home; House faces north
- Construction: Brick exterior on all sides above the foundation; Crawlspace foundation
- Exterior features: Uncovered front porch; Covered back porch; Chain-link fencing in rear
Interior
- Kitchen: Eat-in kitchen; Pantry; Formica countertops; Wood cabinets (other); Backsplash (other)
- Bedrooms: Main-level master bedroom with private closet and carpeted floors; Main-level second bedroom with private closet, shared bath and carpeted floors; Main-level third bedroom with private closet, shared bath and carpeted floors
- Flooring: Carpet in bedrooms and great room; Other flooring in kitchen
- Bathrooms: One full bathroom on the main level
- Heating & cooling: Central air conditioning; Electric heating
- Interior features: Ceiling fan in the great room; Refrigerator included; Electric water heater; Free-standing range
- Laundry & utility: Main-level laundry on an unheated porch
Neighborhood map
What this means for you Summary
Snapshot
- This is a 2-bed/1.0-bath single-family listed at $170k.
Deal economics
- At list price, monthly cash flow is $96 ($1k/yr) — positive.
- The deal already cash-flows at list — no discount required.
- To meet the 1% rule (rent ≥ 1% of price), the offer needs to be $140k (17.7% below list).
- Recommended offer: $140k (17.7% below list) — sets the bar for 1% rule.
- Cap rate 7.0% vs local median 5.0% in Columbia — top-decile yield for the area; either an underpriced asset or a hidden risk that comps aren't pricing in. Stress-test before assuming the spread holds.
Location & tenants
- Location reads 78/100 on livability (#18 in SC, #2,436 nationally) — a middle-class / working-renter tenant base. Strengths: amenities A+, commute A+, cost of living A+; Watch: employment D, crime F.
- Richland 01 (urban): math 26% / reading 36% proficiency, ranked #54 of 80 in SC (top 68%) — families likely to look elsewhere, expect single-tenant / working-renter base with shorter leases; 64% free/reduced lunch — lower-income household profile, screen leases tightly.
- Zoned schools: South Kilbourne Elementary (math 12% / reading 17%, grade F, #553 of 597 statewide, top 95%, 296 students, 100% FRL); Dreher High (math 47% / reading 92%, grade B, #60 of 196 statewide, top 32%, 1,150 students, 100% FRL) — zoned schools average 100% FRL vs 64% district-wide (36 pts higher); higher-poverty schools than district average — tighter screening recommended.
- Market conditions: 1 active listings in the ZIP; 31 comparable units currently listed for rent nearby; rentals at typical pace (median 24d on market — plan ~3-4 weeks tenant-placement turnaround); 3,472 units permitted in Richland County in 2024 (1,096 in 5+ unit buildings).
Forward outlook
- In year one you build about $6k of equity ($1k loan paydown + $5k appreciation (3.0% local appreciation)).
- Richland County population projected at +30% by 2050 — long-run rental-demand tailwind backs the buy-and-hold thesis.
- At projected returns (3.0% appreciation + 3.0% rent growth), your $48k cash investment doubles in ~6 years — after that, you're playing with house money.
- By year 6, paydown + projected appreciation supports a ~$33k cash-out refi (75% LTV) — recoverable capital for the next deal without selling this one.
Negotiation context
- Only 13 days on market — expect competitive offers; lowballing is unlikely to land.
- 3 sale attempts with the ask held roughly flat each time — persistent listings suggest the price (not the market) is what's stuck; bring a comps-based counter.
Risks & watch-outs
- Watch-outs: built in 1955 — expect roof / HVAC / electrical / plumbing capex.
- Climate carrying-cost: major flood risk; extreme-heat days projected 7→16/yr by 2055 (HVAC capex compounding) — expect insurance premiums to compound above CPI over the hold.
Questions for the listing agent
- Built in 1955 — when were the roof, HVAC, electrical panel, plumbing, and water heater last replaced?
- Is there a deadline driving the sale (1031 exchange, divorce, estate, relocation)? That informs how much negotiation room exists.
- Schools are D-rated, which usually means shorter tenancies and higher turnover. Who's the typical renter profile here, and what's been the actual vacancy rate?
- Crime grade is F in this area — have there been break-ins, vandalism, or insurance claims at this property in the last 3 years? What carrier currently insures it and at what premium?
- What's the average days-on-market for RENTAL listings here right now (not sales)? A rising rental-DOM trend means longer vacancies and softer asking-rent achievability than the comps imply.
- What's the recent tenant-quality profile in this submarket — average credit score on applications, eviction rate, late-payment / NSF rate, and stable-employment percentage? A property-management company in the area should have these aggregated.
- How much new for-sale + rental construction is in the pipeline within 1–3 miles? Heavy new supply typically softens prices + rents 12–24 months out; constrained supply supports both.
Investment metrics
- 1% rule
- 0.82% ✗
- Cap rate
- 6.97%
- Cash-on-cash
- 2.43%
- DSCR
- 1.11
- GRM
- 10.1
CMA / ARV
- ARV (on-the-fly)
- $241,980
- Comps found
- 1
Show comp detail 1 sale within ~0.75 mi
| Address | Dist | Beds/Ba | Sqft | Sold | Price | $/sf | Match |
|---|---|---|---|---|---|---|---|
| 1207 Chevis St | 0.35mi | 2/2.0 | 1,116 (+0%) | 2mo | $243,000 | $218 | 78 |
Match score weights: distance 35% · size 25% · config 20% · recency 20%. Top-matched comps best support the ARV.
Projected returns pro-forma
3.0% appreciation · 3.0% rent growth · sell at horizon
- IRR
- 9.7%
- Equity multiple
- 1.56×
- Total profit
- $26,531
- Equity at exit
- $76,439
- IRR
- 12.1%
- Equity multiple
- 2.80×
- Total profit
- $85,769
- Equity at exit
- $117,802
Cash invested: $47,600 (down + closing). Projections, not guarantees.
Landlord ↔ Tenant lean methodology
- Overall (STATE)
- 90 Strongly Landlord-Friendly
- State South Carolina
- 90 Strongly Landlord-Friendly · R+6
- County
- — inherits STATE
- City
- — inherits STATE
ZIP-level market 29205-4716
- Active inventory
- 1
- Price-to-rent
- 10.1×
Monthly cashflow live
- Estimated rent
- $1,400 high interval (Pro) →
- Mortgage (P&I)
- −$891
- Tax from tax record
- −$47 /mo · $565/yr
- Insurance
- −$71
- HOA
- −$0
- Vacancy / Maint / Mgmt
- −$294
- Net cashflow
- $96
Break-even live
UW: 25.0% down · 7.5% · 30yr · 1.5% tax · 5.0% vac · 8.0% maint · 8.0% mgmt
Financing live
Cash to close
- Down payment
- $42,500
- Closing costs
- $5,100
- Reserves months
- —
- Total cash needed
- —
Loan-product check · same deal, 3 products live
Conventional
25% down · 7.5% · 30yr
- Down + closing
- —
- Monthly P&I
- —
- Monthly cashflow
- —
- DSCR
- —
- Eligible?
- —
Personal DTI + credit; lowest rate.
DSCR
20% down · 8.5% · 30yr
- Down + closing
- —
- Monthly P&I
- —
- Monthly cashflow
- —
- DSCR
- —
- Eligible?
- —
No personal income docs; deal must DSCR.
Hard money
10% down · 12.0% · 12mo
- Down + closing
- —
- Monthly P&I
- —
- Monthly cashflow
- —
- DSCR
- —
- Eligible?
- —
Short-term bridge; refi at stabilization.
Rent comps 31 comps
| Address | Beds | Baths | Sqft | Rent | $/sqft | DOM | Units | Dist |
|---|---|---|---|---|---|---|---|---|
| 3626 Hydrangea St Columbia, SC | 2.0 | 1.0 | 800 | $1,040 | $1.30 | 21d | 1 | 0.07mi |
| 1324 Deerwood St Unit 1 Columbia, SC | 2.0 | 2.0 | 1030 | $1,350 | $1.31 | 23d | 1 | 0.38mi |
| 3732 Hickory St Columbia, SC | 2.0 | 1.5 | 840 | $1,350 | $1.61 | 23d | 1 | 0.47mi |
| 1649 S Beltline Blvd Columbia, SC | 2.0 | 1.0 | 900 | $1,250 | $1.39 | 23d | 1 | 0.47mi |
| 1 Tempo Ct Columbia, SC | 3.0 | 1.5 | 1032 | $1,745 | $1.69 | 23d | 1 | 0.53mi |
| 21 Tempo Ct Columbia, SC | 3.0 | 1.5 | 1032 | $1,498 | $1.45 | 11d | 1 | 0.56mi |
| 823 S Kilbourne Rd Columbia, SC | 2.0 | 1.0 | 743 | $1,100 | $1.48 | 23d | 1 | 0.61mi |
| 914 Chevis St Columbia, SC | 3.0 | 2.0 | 1280 | $2,100 | $1.64 | 23d | 1 | 0.61mi |
| 23 Cavalier Ct Unit A Columbia, SC | 2.0 | 1.0 | 871 | $1,300 | $1.49 | 23d | 1 | 0.64mi |
| 1840 Tall Pines Cir Columbia, SC | 3.0 | 1.5 | 1021 | $1,350 | $1.32 | 14d | 1 | 0.65mi |
| 13 Acme St Columbia, SC | 3.0 | 1.0 | 900 | $1,300 | $1.44 | 23d | 1 | 0.66mi |
| 828 Suber St Unit E Columbia, SC | 2.0 | 1.0 | 1100 | $995 | $0.90 | 11d | 1 | 0.67mi |
| 1908 Tall Pines Cir Unit 4 Columbia, SC | 1.0 | 1.0 | 750 | $900 | $1.20 | 23d | 1 | 0.69mi |
| 3901 Bright Ave Columbia, SC | 3.0 | 1.0 | 1047 | $1,380 | $1.32 | 14d | 1 | 0.71mi |
| 3425 Manor Ave Columbia, SC | 3.0 | 2.0 | 1200 | $2,100 | $1.75 | 11d | 1 | 0.77mi |
| 721 Deerwood St Columbia, SC | 2.0 | 1.0 | 1000 | $1,150 | $1.15 | 14d | 1 | 0.81mi |
| 3840 Overbrook Dr Columbia, SC | 2.0 | 2.0 | 900 | $1,595 | $1.77 | 23d | 1 | 0.89mi |
| 2725 Kingswood Dr Columbia, SC | 3.0 | 1.0 | 940 | $1,500 | $1.60 | 23d | 1 | 0.99mi |
| 524 S Beltline Blvd Columbia, SC | 2.0 | 1.0 | 1050 | $1,300 | $1.24 | 23d | 1 | 1.01mi |
| 19 Graymont Cir Unit NA Columbia, SC | 3.0 | 2.0 | 1250 | $2,400 | $1.92 | 23d | 1 | 1.10mi |
| 114 Easy St Columbia, SC | 2.0 | 2.0 | 1100 | $1,500 | $1.36 | 11d | 1 | 1.12mi |
| 1 Graymont Cir Columbia, SC | 3.0 | 2.5 | 1400 | $2,175 | $1.55 | 23d | 1 | 1.12mi |
| 320 S Beltline Blvd Columbia, SC | 2.0 | 1.0 | 800 | $1,048 | $1.31 | 23d | 5 | 1.19mi |
| 501 Pelham Dr Columbia, SC | 1.0–2.0 | 1.0–2.0 | 805 | $1,625 | $2.02 | 2d | 24 | 1.20mi |
| 500 Gills Creek Pkwy Columbia, SC | 1.0–2.0 | 1.0–2.0 | 807 | $1,375 | $1.70 | 11d | 27 | 1.24mi |
| 317 Beltline Blvd Unit 1 Columbia, SC | 3.0 | 1.0 | 1150 | $1,200 | $1.04 | 23d | 1 | 1.36mi |
| 3125 Heyward St Unit B Columbia, SC | 2.0 | 1.0 | 1100 | $1,600 | $1.45 | 23d | 1 | 1.39mi |
| 3125 Heyward St Unit A Columbia, SC | 3.0 | 1.0 | 1200 | $2,400 | $2.00 | 23d | 1 | 1.39mi |
| 222 Prospect St Unit 224 Columbia, SC | 2.0 | 1.0 | 750 | $1,250 | $1.67 | 23d | 1 | 1.42mi |
| 4319 Wilmot Ave Columbia, SC | 3.0 | 1.0 | 1000 | $1,650 | $1.65 | 23d | 1 | 1.44mi |
| 318 S Woodrow St Columbia, SC | 2.0 | 1.0 | 1103 | $1,700 | $1.54 | 23d | 1 | 1.46mi |
Listing history 10 events
-
2026-06-18days on market $170,000 Active 13 DOM
-
2026-06-17days on market $170,000 Active 12 DOM
-
2026-06-16days on market $170,000 Active 11 DOM
-
2026-06-15days on market $170,000 Active 10 DOM
-
2026-06-14days on market $170,000 Active 8 DOM
-
2026-06-10days on market $170,000 Active 5 DOM
-
2026-06-09days on market $170,000 Active 4 DOM
-
2026-06-08days on market $170,000 Active 3 DOM
-
2026-06-07remarks 695-char remark
-
2026-06-07$170,000 Active 2 DOM
ⓘ Source: listings_history table (triggers on properties + properties_extension) + one-shot
backfill from property_details.listing_events for pre-trigger history.
Tax reassessment forecast SC · Resets to sale price
- Current annual tax
- $565 · $47/mo
- Projected year-2 tax
- $969 · $81/mo
- Expected delta
- +$404/yr (+$34/mo · 71.5%)
ⓘ Screening estimate from a state-policy table — verify with the county assessor before closing.
Climate risk First Street
- Flood 6/10 Major FEMA zone X · 98% chance over 30 yrs
- Wildfire 2/10 Low
- Heat 7/10 Severe
Nearby sold comps map
Loading sold comps map…
Walkable amenities ~0.75 mi
Loading nearby amenities…
Taxation est. · year 1
- Rental income
- $16,795
- − Mortgage interest
- −$9,523
- − Property taxes
- −$565
- − Insurance
- −$850
- − Repairs & maintenance
- −$1,344
- − Management
- −$1,344
- − Depreciation
- −$4,945
- Taxable loss
- −$1,775
- Est. tax savings @ 24.0%
- +$426
- After-tax cash flow
- $1,581/yr
For passive investors: Depreciation is non-cash, so a rental often shows a tax loss while cash-flowing — sheltering income. Rental losses are passive: they offset passive income freely, and up to $25,000/yr can offset ordinary (W-2) income if you actively participate and your MAGI is under $100k (phasing out to $0 by $150k); unused losses carry forward. On sale, claimed depreciation is recaptured at up to 25%, and gains may owe capital-gains tax (a 1031 exchange can defer both). Figures are a year-1 estimate at your 24.0% rate — not tax advice; consult a CPA.
Schools (NCES district)
- District
- Richland 01
- NCES district ID
- 4503360
- Math proficiency
- 26% ▼ -7.00%
- Reading proficiency
- 36% ▼ -5.00%
- Median HH income
- $38,931
- Composite
- 25.94/100
- National rank
- #7335
- State rank
- #54 of 80 in SC
Livability — Columbia
- Score
- 78/100
- State rank
- #18
- US rank
- #2436
Category grades
Schools grade is shown separately in the Schools card above.
Census & demographics
- Census place
- Columbia, SC
Population outlook (Richland County) Hauer SSP2
- Today (2025)
- 459,667 people
- By 2030
- 487,524 · +6.1%
- By 2040
- 542,035 · +17.9%
- By 2050
- 595,371 · +29.5%
- By 2075
- 732,998 · +59.5%
- By 2100
- 820,415 · +78.5%
Not yet ingested
- Political lean
- —
- Race & ethnicity
- —
- Common origin
- —
- Civics
- —
Market trends
- HPI YoY
- —
- Current HPI
- —
- Rent YoY
- —
- Metro
- —
- State GDP YoY
- ▲ 4.51%
- F500 in state
- 2
Industry mix (Fortune 500 HQ in SC)
| Industry | F500 HQs | Revenue |
|---|---|---|
| Packaging | 1 | $7B |
|
||
Price history
-10.5% since first listed6 events — show timeline
- 2026-06-05 Listed $170,000 Consolidated MLS
- 2026-03-20 Pending — Consolidated MLS
- 2025-10-09 Relisted — Consolidated MLS
- 2025-09-03 Pending — Consolidated MLS
- 2025-08-29 Price Changed $170,000 Consolidated MLS
- 2025-07-01 Listed $190,000 Consolidated MLS
Property tax history
+8.3%/yrLatest (2025): $565 · +182.5% YoY. Source: county tax records.
Cash-flow waterfall
monthlySold comps — $/sqft
last 12 mo · ≤1 miLoading sold comps…