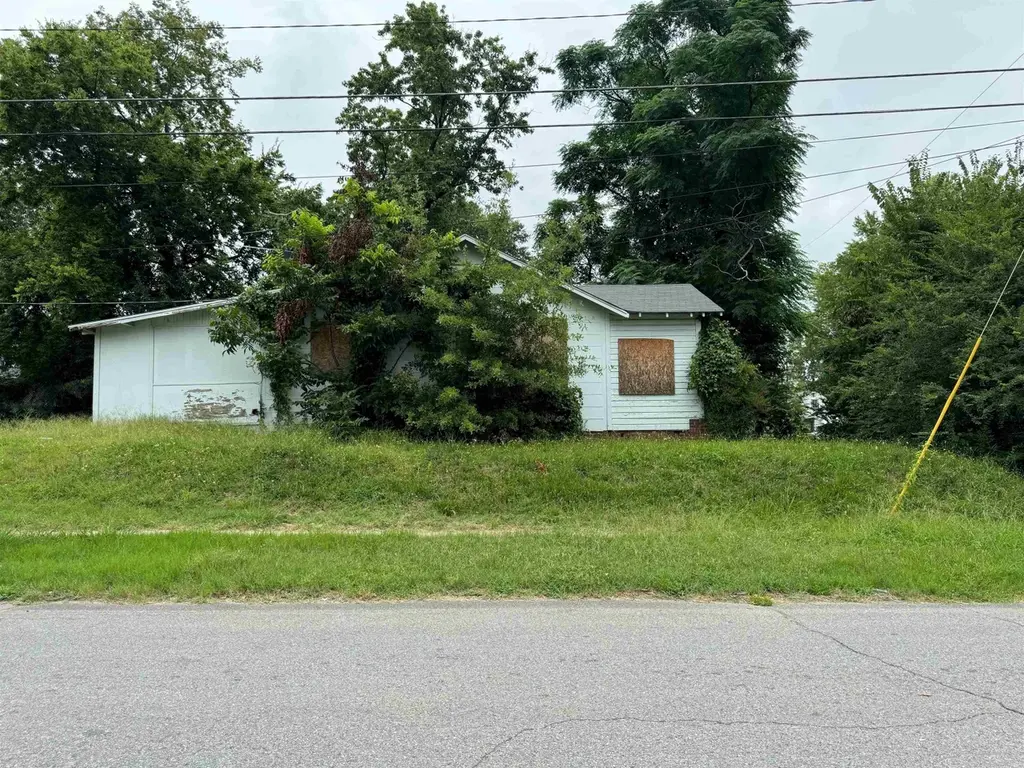
1801 N Poplar St · North Little Rock, AR
Flood risk 5/10 · Moderate
- FEMA flood zone
- X (unshaded)
- Chance of flooding over 30 yrs
- 0.24%
- Est. flood insurance / yr
- $507 – $1,088
Fire risk 2/10 · Minimal
- Est. fire insurance / yr
- $1,499 – $2,785
Heat risk 7/10 · Major
- Hot days now (above 111°F)
- 7 days/yr
- Hot days in 30 yrs
- 19 days/yr
Wind risk 4/10 · Minor
- Chance of severe wind over 30 yrs
- 10.0%
Air-quality risk 2/10 · Minimal
- Unhealthy air days now
- 1 days/yr
- Unhealthy air days in 30 yrs
- 1 days/yr
Risk factors via First Street. Map © Google.
Why this score? — see what drove the A- grade
The composite is a weighted blend of 9 inputs, each scored 0–100. Each bar is that input's sub-score; the figure is the points it added to the 100-point composite (weight × sub-score).
- Cash flow +30.0/30.0
- ARV discount +15.0/15.0
- 1% rule +10.0/10.0
- DSCR +10.0/10.0
- Livability +3.7/5.0
- Appreciation +3.6/10.0
- Rent growth +3.3/5.0
- Condition / age +2.5/5.0
- Schools +2.0/10.0
$50,000
🖨 Deal sheet 📄 Offer letter ✓ Due diligence
Listing remarks MLS
Great investment opportunity in downtown North Little Rock!
Key facts
- 7,405 sq ft lot
- Built 1940
- Listed 673 days
Neighborhood map
What this means for you Summary
Snapshot
- This is a 2-bed/1.0-bath single-family listed at $50k.
Deal economics
- At list price, monthly cash flow is $465 ($6k/yr) — positive.
- The deal already cash-flows at list — no discount required.
- Meets the 1% rule at list price ($1k rent vs $50k).
- Recommended offer: $44k (12.0% below list) — sets the bar for market timing.
- Cap rate 17.4% vs local median 5.1% in North Little Rock — top-decile yield for the area; either an underpriced asset or a hidden risk that comps aren't pricing in. Stress-test before assuming the spread holds.
Location & tenants
- Location reads 73/100 on livability (#24 in AR) — a middle-class / working-renter tenant base. Strengths: commute A+, cost of living A+, housing A+; Watch: schools D+, crime F, amenities F.
- N. Little Rock School District (urban): math 21% / reading 26% proficiency, ranked #191 of 238 in AR (top 80%) — low school quality limits family demand, transient renter base, plan for 1-2y turnover; 66% free/reduced lunch — lower-income household profile, screen leases tightly.
- Market conditions: Rents rising (+3.1%/yr); 67 active listings in the ZIP; 40 comparable units currently listed for rent nearby; rentals lingering (median 44d on market — plan ~5-8 weeks vacancy on turnover, expect pricing pressure); 70% of comp listings sitting > 30 days — soft ceiling on asking rent; lower-income renter base — watch delinquency; 1,006 units permitted in Pulaski County in 2024 (0 in 5+ unit buildings).
- This rent runs 43% of the median local income ($30k/yr) — at the standard rent-burdened threshold; future hikes will face affordability resistance.
Forward outlook
- Local home prices are declining (-2.7%/yr); year-one equity from $346 of loan paydown is wiped out by about $1k of value loss. Plan a longer hold.
- Pulaski County population projected at +6% by 2050 — modest demand growth; plan on rents tracking national, not racing it.
- At projected returns (-2.7% appreciation + 3.1% rent growth), your $14k cash investment doubles in ~3 years — after that, you're playing with house money.
Negotiation context
- It's been on market 673 days — a 12% lower offer ($44k) is reasonable based on typical stale-listing flexibility.
- 2 sale attempts since 3y ago with the ask held roughly flat each time — persistent listings suggest the price (not the market) is what's stuck; bring a comps-based counter.
Risks & watch-outs
- Watch-outs: property tax is 2.6% of price; built in 1940 — expect roof / HVAC / electrical / plumbing capex.
- Climate carrying-cost: moderate flood risk; extreme-heat days projected 7→19/yr by 2055 (HVAC capex compounding) — expect insurance premiums to compound above CPI over the hold.
Questions for the listing agent
- It's been on market 673 days. Have you received any prior offers? Is the seller open to a 12% concession, seller financing, or rate buy-down credit?
- Built in 1940 — when were the roof, HVAC, electrical panel, plumbing, and water heater last replaced?
- Property tax is high relative to price — has the assessment been appealed recently, and will the sale trigger a re-assessment?
- Why hasn't it sold? Are there any deal-killer items the seller is aware of (foundation, flood, title, zoning, code violations)?
- Is there a deadline driving the sale (1031 exchange, divorce, estate, relocation)? That informs how much negotiation room exists.
- Schools are D-rated, which usually means shorter tenancies and higher turnover. Who's the typical renter profile here, and what's been the actual vacancy rate?
- Crime grade is F in this area — have there been break-ins, vandalism, or insurance claims at this property in the last 3 years? What carrier currently insures it and at what premium?
- What's the average days-on-market for RENTAL listings here right now (not sales)? A rising rental-DOM trend means longer vacancies and softer asking-rent achievability than the comps imply.
- What's the recent tenant-quality profile in this submarket — average credit score on applications, eviction rate, late-payment / NSF rate, and stable-employment percentage? A property-management company in the area should have these aggregated.
- How much new for-sale + rental construction is in the pipeline within 1–3 miles? Heavy new supply typically softens prices + rents 12–24 months out; constrained supply supports both.
Investment metrics
- 1% rule
- 2.17% ✓
- Cap rate
- 17.45%
- Cash-on-cash
- 39.84%
- DSCR
- 2.77
- GRM
- 3.8
CMA / ARV
- ARV (median comp)
- $69,619
- List price
- $50,000
- Delta
- -28.18%
- Verdict
- UNDERPRICED
- Comps
- 20 within 1.0 mi
Show comp detail 12 sales within ~0.75 mi
| Address | Dist | Beds/Ba | Sqft | Sold | Price | $/sf | Match |
|---|---|---|---|---|---|---|---|
| 1709 N Poplar St | 0.05mi | 2/1.0 | 1,116 (+3%) | 2mo | $69,000 | $62 | 91 |
| 2021 N Poplar St | 0.18mi | 2/1.0 | 1,108 (+2%) | 3mo | $70,000 | $63 | 85 |
| 1711 N Poplar St | 0.04mi | 2/1.0 | 1,247 (+15%) | 2mo | $69,000 | $55 | 72 |
| 400 E 12th St | 0.44mi | 2/1.0 | 1,056 (-3%) | 8mo | $22,500 | $21 | 69 |
| 1507 Marion St | 0.64mi | 2/1.0 | 1,072 (-1%) | 0mo | $65,000 | $61 | 68 |
| 1710 N Magnolia | 0.11mi | 3/1.5 (+1) | 1,230 (+13%) | 7mo | $48,000 | $39 | 60 |
| 100 Melrose Dv | 0.73mi | 2/1.0 | 1,104 (+2%) | 8mo | $200,000 | $181 | 57 |
| 623 W 17th St | 0.45mi | 2/1.5 | 1,198 (+10%) | 9mo | $135,000 | $113 | 52 |
| 816 W 20th St | 0.64mi | 2/1.0 | 994 (-8%) | 7mo | $18,000 | $18 | 50 |
| 705 W 22nd St | 0.61mi | 2/1.0 | 952 (-12%) | 5mo | $38,000 | $40 | 46 |
| 817 Maple St | 0.69mi | 2/2.0 | 1,206 (+11%) | 3mo | $215,000 | $178 | 43 |
| 1700 Schaer | 0.63mi | 3/2.0 (+1) | 1,216 (+12%) | 7mo | $135,000 | $111 | 36 |
Match score weights: distance 35% · size 25% · config 20% · recency 20%. Top-matched comps best support the ARV.
Projected returns pro-forma
-2.7% appreciation · 3.14% rent growth · sell at horizon
- IRR
- 36.9%
- Equity multiple
- 2.59×
- Total profit
- $22,315
- Equity at exit
- $8,113
- IRR
- 43.2%
- Equity multiple
- 5.21×
- Total profit
- $58,893
- Equity at exit
- $5,462
Cash invested: $14,000 (down + closing). Projections, not guarantees.
Landlord ↔ Tenant lean methodology
- Overall (STATE)
- 92 Strongly Landlord-Friendly
- State Arkansas
- 92 Strongly Landlord-Friendly · R+14
- County
- — inherits STATE
- City
- — inherits STATE
ZIP-level market 72114
- Home prices YoY
- -2.2%
- Rents YoY
- 3.1%
- Active inventory
- 67
- Price-to-rent
- 3.8×
Monthly cashflow live
- Estimated rent
- $1,085 high interval (Pro) →
- Mortgage (P&I)
- −$262
- Tax from tax record
- −$110 /mo · $1,316/yr
- Insurance
- −$21
- HOA
- −$0
- Vacancy / Maint / Mgmt
- −$228
- Net cashflow
- $465
Break-even live
UW: 25.0% down · 7.5% · 30yr · 1.5% tax · 5.0% vac · 8.0% maint · 8.0% mgmt
Financing live
Cash to close
- Down payment
- $12,500
- Closing costs
- $1,500
- Reserves months
- —
- Total cash needed
- —
Loan-product check · same deal, 3 products live
Conventional
25% down · 7.5% · 30yr
- Down + closing
- —
- Monthly P&I
- —
- Monthly cashflow
- —
- DSCR
- —
- Eligible?
- —
Personal DTI + credit; lowest rate.
DSCR
20% down · 8.5% · 30yr
- Down + closing
- —
- Monthly P&I
- —
- Monthly cashflow
- —
- DSCR
- —
- Eligible?
- —
No personal income docs; deal must DSCR.
Hard money
10% down · 12.0% · 12mo
- Down + closing
- —
- Monthly P&I
- —
- Monthly cashflow
- —
- DSCR
- —
- Eligible?
- —
Short-term bridge; refi at stabilization.
Rent comps 40 comps
| Address | Beds | Baths | Sqft | Rent | $/sqft | DOM | Units | Dist |
|---|---|---|---|---|---|---|---|---|
| 1913 N Magnolia St North Little Rock, AR | 2.0 | 1.0 | 816 | $675 | $0.83 | 43d | 1 | 0.13mi |
| 1600 N Olive St North Little Rock, AR | 3.0 | 1.0 | 1100 | $900 | $0.82 | 43d | 1 | 0.19mi |
| 1524 Orange St North Little Rock, AR | 3.0 | 2.0 | 1350 | $1,000 | $0.74 | 23d | 1 | 0.22mi |
| 1416 Willow St North Little Rock, AR | 2.0 | 1.0 | 995 | $1,999 | $2.01 | 43d | 1 | 0.32mi |
| 1508 Sycamore St North Little Rock, AR | 2.0 | 1.0 | 1320 | $1,175 | $0.89 | 43d | 1 | 0.36mi |
| 1601 Rockwater Blvd North Little Rock, AR | 1.0 | 1.0 | 724 | $1,024 | $1.41 | 14d | 10 | 0.37mi |
| 600 W 18th St North Little Rock, AR | 3.0 | 1.0 | 1157 | $895 | $0.77 | 14d | 1 | 0.41mi |
| 128 College Park Cir Unit 1 North Little Rock, AR | 2.0 | 1.0 | 975 | $550 | $0.56 | 43d | 1 | 0.45mi |
| 1600 Chandler St North Little Rock, AR | 1.0 | 1.0 | 890 | $595 | $0.67 | 43d | 1 | 0.52mi |
| 1603 Chandler St North Little Rock, AR | 2.0 | 1.0 | 1080 | $895 | $0.83 | 43d | 1 | 0.55mi |
| 134 Melrose Cir North Little Rock, AR | 3.0 | 2.0 | 1322 | $1,750 | $1.32 | 21d | 1 | 0.62mi |
| 124 Melrose Cir North Little Rock, AR | 2.0 | 2.0 | 1200 | $1,950 | $1.62 | 14d | 1 | 0.64mi |
| 823 W 20th St North Little Rock, AR | 3.0 | 2.0 | 1250 | $1,470 | $1.18 | 23d | 1 | 0.68mi |
| 800 N Olive St North Little Rock, AR | 2.0 | 1.5 | 1142 | $1,500 | $1.31 | 43d | 1 | 0.70mi |
| 712 N Magnolia St Ste B North Little Rock, AR | 1.0 | 1.0 | 1200 | $1,750 | $1.46 | 43d | 1 | 0.72mi |
| 712 N Olive St North Little Rock, AR | 1.0 | 1.0 | 776 | $1,250 | $1.61 | 43d | 1 | 0.73mi |
| 127 Crestview Dr Unit 3 North Little Rock, AR | 2.0 | 1.0 | 880 | $825 | $0.94 | 43d | 1 | 0.80mi |
| 300 Cherry Hill Dr Unit 5 North Little Rock, AR | 2.0 | 1.0 | 880 | $825 | $0.94 | 43d | 1 | 0.82mi |
| 117 Link Rd North Little Rock, AR | 3.0 | 2.0 | 1407 | $1,600 | $1.14 | 43d | 1 | 0.87mi |
| 306 W 6th St North Little Rock, AR | 2.0 | 2.0 | 1100 | $1,750 | $1.59 | 44d | 1 | 0.87mi |
| 1317 W 16th St North Little Rock, AR | 2.0 | 1.0 | 864 | $675 | $0.78 | 43d | 1 | 0.89mi |
| 1100 W 24th St North Little Rock, AR | 3.0 | 1.0 | 1036 | $1,295 | $1.25 | 18d | 1 | 0.90mi |
| 2004 Franklin St Apt A North Little Rock, AR | 1.0 | 1.0 | 850 | $450 | $0.53 | 43d | 1 | 0.91mi |
| 111 E 4th St North Little Rock, AR | 1.0–2.0 | 1.0–2.0 | 883 | $1,320 | $1.49 | 14d | 6 | 0.94mi |
| 1308 W 21st St North Little Rock, AR | 2.0 | 1.0 | 944 | $945 | $1.00 | 43d | 1 | 0.97mi |
| 2320 Franklin St North Little Rock, AR | 2.0 | 2.0 | 932 | $750 | $0.80 | 23d | 1 | 0.99mi |
| 408 W 4th St North Little Rock, AR | 2.0 | 1.5 | 1360 | $1,395 | $1.03 | 43d | 1 | 0.99mi |
| 1519 W 15th St North Little Rock, AR | 3.0 | 2.0 | 1250 | $1,470 | $1.18 | 43d | 1 | 1.02mi |
| 218 W 33rd Pl North Little Rock, AR | 2.0 | 1.0 | 792 | $800 | $1.01 | 43d | 1 | 1.03mi |
| 3403 Ridge Rd North Little Rock, AR | 2.0 | 1.0 | 714 | $895 | $1.25 | 43d | 1 | 1.04mi |
| 1603 W Long 17th St Unit B North Little Rock, AR | 3.0 | 1.0 | 1036 | $650 | $0.63 | 43d | 1 | 1.05mi |
| 407 W 33rd St North Little Rock, AR | 3.0 | 2.0 | 1472 | $1,025 | $0.70 | 43d | 1 | 1.05mi |
| 1236 W 10th St North Little Rock, AR | 3.0 | 1.0 | 1185 | $795 | $0.67 | 43d | 1 | 1.07mi |
| 1300 W 10th St North Little Rock, AR | 2.0 | 1.0 | 852 | $895 | $1.05 | 43d | 1 | 1.09mi |
| 1019 Frank St Unit B North Little Rock, AR | 2.0 | 1.0 | 806 | $850 | $1.05 | 43d | 1 | 1.12mi |
| 508 W 35th St North Little Rock, AR | 2.0 | 1.0 | 876 | $850 | $0.97 | 23d | 1 | 1.18mi |
| 75 Riverfront Dr Little Rock, AR | 1.0–2.0 | 1.0–2.0 | 1089 | $1,546 | $1.42 | 14d | 24 | 1.20mi |
| 509 W 35th St North Little Rock, AR | 2.0 | 1.0 | 740 | $800 | $1.08 | 43d | 1 | 1.20mi |
| 400 Parker St North Little Rock, AR | 1.0 | 1.0 | 782 | $1,300 | $1.66 | 43d | 1 | 1.20mi |
| 515 W 35th St North Little Rock, AR | 1.0 | 1.0 | 880 | $695 | $0.79 | 23d | 1 | 1.21mi |
Listing history 21 events
-
2026-06-18days on market $50,000 Active 673 DOM
-
2026-06-17days on market $50,000 Active 672 DOM
-
2026-06-16days on market $50,000 Active 671 DOM
-
2026-06-15days on market $50,000 Active 670 DOM
-
2026-06-14days on market $50,000 Active 668 DOM
-
2026-06-13days on market $50,000 Active 667 DOM
-
2026-06-10days on market $50,000 Active 665 DOM
-
2026-06-09days on market $50,000 Active 664 DOM
-
2026-06-08days on market $50,000 Active 663 DOM
-
2026-06-07days on market $50,000 Active 662 DOM
-
2026-06-05days on market $50,000 Active 659 DOM
-
2026-06-03days on market $50,000 Active 658 DOM
-
2026-06-02days on market $50,000 Active 657 DOM
-
2026-06-01days on market $50,000 Active 656 DOM
-
2026-05-31days on market $50,000 Active 655 DOM
-
2026-05-31days on market $50,000 Active 654 DOM
-
2024-08-14$50,000 New Listing 59-char remark
Show marketing remark (59 chars)
Great investment opportunity in downtown North Little Rock!
-
2023-03-25historical
-
2023-01-24$39,900 New Listing
-
2021-04-02soldstatus $131,500
-
2011-06-22soldstatus $9,000
ⓘ Source: listings_history table (triggers on properties + properties_extension) + one-shot
backfill from property_details.listing_events for pre-trigger history.
Tax reassessment forecast AR · Resets to sale price
- Current annual tax
- $1,316 · $110/mo
- Projected year-2 tax
- $1,316 · $110/mo
- Expected delta
- $0/yr ($0/mo · 0.0%)
ⓘ Screening estimate from a state-policy table — verify with the county assessor before closing.
Climate risk First Street
- Flood 5/10 Major FEMA zone X (unshaded) · 24% chance over 30 yrs
- Wildfire 2/10 Low
- Heat 7/10 Severe 7 d/yr ≥111°F today · 19 d/yr by 30 yrs out
- Wind 4/10 Moderate 10% chance of damaging wind over 30 yrs
- Air quality 2/10 Low 1 unhealthy d/yr today · 1 by 30 yrs out
Nearby sold comps map
Loading sold comps map…
Walkable amenities ~0.75 mi
Loading nearby amenities…
Taxation est. · year 1
- Rental income
- $13,025
- − Mortgage interest
- −$2,801
- − Property taxes
- −$1,316
- − Insurance
- −$250
- − Repairs & maintenance
- −$1,042
- − Management
- −$1,042
- − Depreciation
- −$1,455
- Taxable income
- $5,119
- Est. tax owed @ 24.0%
- −$1,229
- After-tax cash flow
- $4,348/yr
For passive investors: Depreciation is non-cash, so a rental often shows a tax loss while cash-flowing — sheltering income. Rental losses are passive: they offset passive income freely, and up to $25,000/yr can offset ordinary (W-2) income if you actively participate and your MAGI is under $100k (phasing out to $0 by $150k); unused losses carry forward. On sale, claimed depreciation is recaptured at up to 25%, and gains may owe capital-gains tax (a 1031 exchange can defer both). Figures are a year-1 estimate at your 24.0% rate — not tax advice; consult a CPA.
Schools (NCES district)
- District
- N. Little Rock School District
- NCES district ID
- 0510680
- Math proficiency
- 21% ▼ -11.00%
- Reading proficiency
- 26% ▼ -9.00%
- Median HH income
- $38,325
- Composite
- 19.69/100
- National rank
- #8728
- State rank
- #191 of 238 in AR
Livability — North Little Rock
- Score
- 73/100
- State rank
- #24
- US rank
- #5452
Category grades
Schools grade is shown separately in the Schools card above.
Census & demographics
- Census place
- North Little Rock, AR
- County
- Pulaski County · 372,764 people
- City population
- 55,470
- Metro
- Little Rock-North Little Rock-Conway, AR
- Population (ZIP)
- 10,093
- Household income
- $30,175
- Rent vs Own
- Severe rent burden
- 995.0
Population outlook (Pulaski County) Hauer SSP2
- Today (2025)
- 415,378 people
- By 2030
- 423,720 · +2.0%
- By 2040
- 435,182 · +4.8%
- By 2050
- 440,904 · +6.1%
- By 2075
- 445,521 · +7.3%
- By 2100
- 419,173 · +0.9%
Race, ethnicity, and origin ACS 2023
- Neighborhood character
- Predominantly Black (70%)
- Race & ethnicity
- Black 70% White 23% Hispanic / Latino 4% Two or more races 3%
- Common ancestry
- Slovak 1% Serbian 1%
- Foreign-born
- 3% · Canada, South Korea
- Languages at home
- 96% English-only · Spanish 2% Other Indo-European 1% Other Asian/Pacific 0%
Political lean MEDSL · Pulaski
- 2024 margin
- Strong D (+22.1) · D 59.8% · R 37.7% · Other 2.5%
- 2008→2024 swing
- +10.6pp toward D · 2008: 11.6pp · 2024: 22.1pp
- All cycles
- 2024: D+22.1 2020: D+22.5 2016: D+17.9 2012: D+11.4 2008: D+11.6
Not yet ingested
- Civics
- —
Market trends
- HPI YoY
- ▼ -2.70%
- Current HPI
- 121.4243
- Rent YoY
- ▲ 3.14%
- Metro
- Little Rock-North Little Rock-Conway, AR
- State GDP YoY
- ▲ 3.80%
- F500 in state
- 10
Industry mix (Fortune 500 HQ in AR)
| Industry | F500 HQs | Revenue |
|---|---|---|
| Retail | 1 | $681B |
|
||
| Food / Agriculture | 1 | $53B |
|
||
| Retail / Energy | 1 | $22B |
|
||
| Transportation / Logistics | 1 | $12B |
|
||
| Energy | 1 | $4B |
|
||
Price history
+455.6% since first listed5 events — show timeline
- 2024-08-14 Listed $50,000 CARMLS
- 2023-03-25 Listing Removed — CARMLS
- 2023-01-24 Listed $39,900 CARMLS
- 2021-04-02 Sold (Public Records) $131,500 Public Records
- 2011-06-22 Sold (Public Records) $9,000 Public Records
Property tax history
+8.0%/yrLatest (2025): $1,316 · +38.9% YoY. Source: county tax records.
Cash-flow waterfall
monthlySold comps — $/sqft
last 12 mo · ≤1 miLoading sold comps…