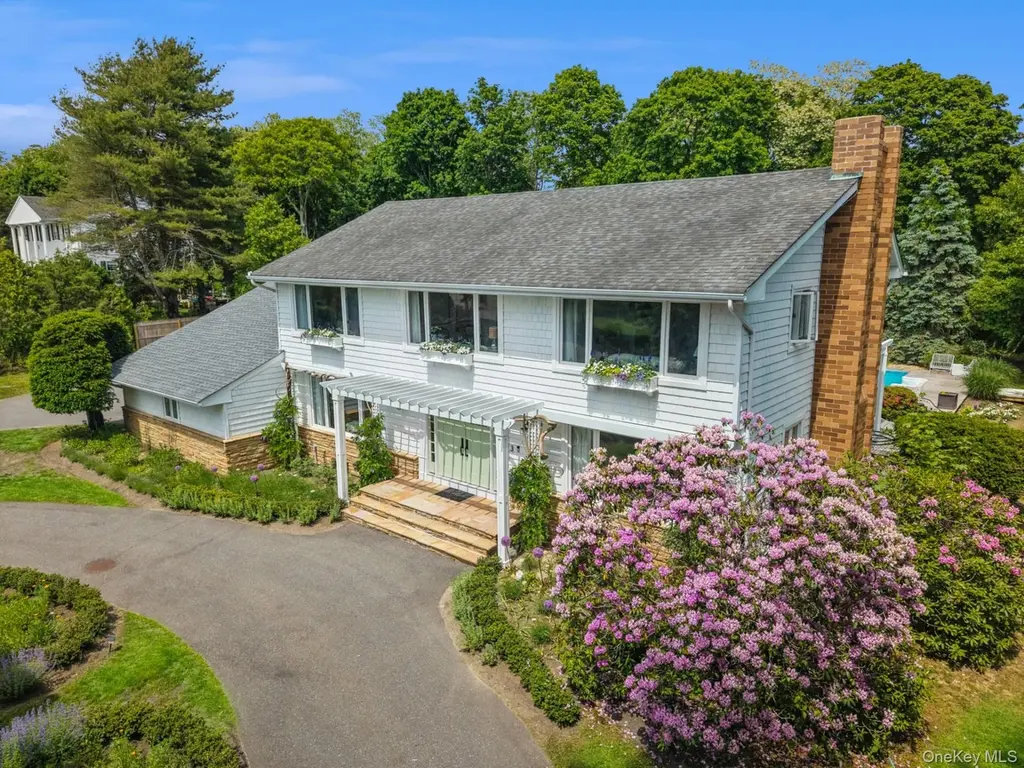
3 Mooring Dr · Brookhaven, NY
Flood risk 1/10 · Minimal
- FEMA flood zone
- X (unshaded)
- Chance of flooding over 30 yrs
- 0.0%
- Est. flood insurance / yr
- $473 – $860
Fire risk 2/10 · Minimal
- Est. fire insurance / yr
- $691 – $1,283
Heat risk 4/10 · Minor
- Hot days now (above 92°F)
- 7 days/yr
- Hot days in 30 yrs
- 17 days/yr
Wind risk 8/10 · Major
- Chance of severe wind over 30 yrs
- 80.0%
Air-quality risk 4/10 · Minor
- Unhealthy air days now
- 3 days/yr
- Unhealthy air days in 30 yrs
- 5 days/yr
Risk factors via First Street. Map © Google.
Why this score? — see what drove the C- grade
The composite is a weighted blend of 9 inputs, each scored 0–100. Each bar is that input's sub-score; the figure is the points it added to the 100-point composite (weight × sub-score).
- Cash flow +21.5/30.0
- DSCR +6.8/10.0
- ARV discount +6.2/15.0
- Schools +4.5/10.0
- 1% rule +4.4/10.0
- Livability +3.2/5.0
- Rent growth +2.5/5.0
- Condition / age +2.5/5.0
- Appreciation +0.0/10.0
$1,995,000
🖨 Deal sheet 📄 Offer letter ✓ Due diligence
Listing remarks
Completely reimagined, 3 Mooring Drive has undergone an extensive top-to-bottom renovation, transforming the home from its 1980s origins into a refined modern residence with warmth and character. Major upgrades include a new chef’s kitchen centered around a professional ILVE 8-burner gas range, updated flooring throughout, redesigned fireplaces, custom moldings, a dramatic staircase transformation, renovated bathrooms, and significant interior improvements throughout. The bathrooms bring a distinct point of view, featuring Morrison tile, hand-painted ceilings, and a touch of whimsy for buyers who appreciate character-driven design. Outside, the property has been extensively landscaped
Key facts
- Upgraded pool heater
- Separate outbuilding
- Deer-proofed grounds
Tags
Property features AI
Finance
- Other: Private outdoor inground pool with electric heat
Exterior
- Parking: Driveway; 2-car garage
- Utilities: Cesspool sewer; Natural gas available and connected
- Home design: Single family residence; Two-story; Living area reported from public records
- Construction: Frame construction; Vinyl siding; Shingle roof information not provided; Partial unfinished basement (foundation details not provided); Year built not provided
- Exterior features: Garden; Back yard; Front yard; Landscaped; Shed(s)
Interior
- Kitchen: Gas range; Range; Microwave; Dishwasher; Refrigerator; Stainless steel appliances
- Bedrooms: Two levels (total rooms: 8)
- Bathrooms: 3 full bathrooms; 1 half bathroom
- Heating & cooling: Forced air heating (oil); Central air conditioning
- Interior features: Entrance foyer; Formal dining room; Open floorplan; Open kitchen; Pantry; Primary bathroom; Walk-in closet(s); First-floor full bath; Library/Den; Partial unfinished basement; Partial attic; Deck; Patio
- Laundry & utility: Washer; Dryer
Neighborhood map
What this means for you Summary
Snapshot
- This is a 4-bed/3.5-bath single-family listed at $2.00M.
Deal economics
- At list price, monthly cash flow is $3k ($36k/yr) — positive.
- The deal already cash-flows at list — no discount required.
- To meet the 1% rule (rent ≥ 1% of price), the offer needs to be $1.89M (5.5% below list).
- Recommended offer: $1.89M (5.5% below list) — sets the bar for 1% rule.
Location & tenants
- Location reads 65/100 on livability (#681 in NY) — a middle-class / working-renter tenant base. Strengths: crime A+, employment A+, housing B+; Watch: amenities F, commute F, cost of living F.
- South Country Central School District (suburban): math 50% / reading 44% proficiency, ranked #460 of 755 in NY (top 61%) — families likely to look elsewhere, expect single-tenant / working-renter base with shorter leases.
- Zoned schools: Brookhaven Elementary School (506 students, 41% FRL); Bellport Middle School (math 64% / reading 54%, grade B, #161 of 729 statewide, top 24%, 838 students, 56% FRL); Bellport Senior High School (math 86% / reading 64%, grade A-, #630 of 1,100 statewide, top 57%, 1,392 students, 52% FRL).
- Zoned-school proficiency averages 67% at this address vs 47% district-wide (+20 pts) — the actual schools serving this property are materially stronger than the South Country Central School District average implies; a family-tenant draw the district grade alone would hide.
- Market conditions: 57 active listings in the ZIP; 2 comparable units currently listed for rent nearby; 1,366 units permitted in Suffolk County in 2024 (216 in 5+ unit buildings).
Forward outlook
- Local home prices are declining (-3.0%/yr); year-one equity from $14k of loan paydown is wiped out by about $60k of value loss. Plan a longer hold.
- Suffolk County population projected to shrink 5% by 2050 — rents likely to lag national; underwrite the cash flow, not the appreciation.
Negotiation context
- Only 12 days on market — expect competitive offers; lowballing is unlikely to land.
- 3 sale attempts since 2y ago with the ask held roughly flat each time — persistent listings suggest the price (not the market) is what's stuck; bring a comps-based counter.
- Current owner paid $940k; list at $2.00M implies a 112% gain — meaningful room to come down on a strong offer.
Risks & watch-outs
- Climate carrying-cost: severe wind risk, 80% chance of damaging wind over 30y — expect insurance premiums to compound above CPI over the hold.
Questions for the listing agent
- Built in 1975 — when were the roof, HVAC, electrical panel, plumbing, and water heater last replaced?
- Is there a deadline driving the sale (1031 exchange, divorce, estate, relocation)? That informs how much negotiation room exists.
- Schools are B-rated — typically a magnet for longer-tenancy family renters. What's the average tenant stay here, and is there a school-zone premium baked into asking?
- What's the average days-on-market for RENTAL listings here right now (not sales)? A rising rental-DOM trend means longer vacancies and softer asking-rent achievability than the comps imply.
- What's the recent tenant-quality profile in this submarket — average credit score on applications, eviction rate, late-payment / NSF rate, and stable-employment percentage? A property-management company in the area should have these aggregated.
- How much new for-sale + rental construction is in the pipeline within 1–3 miles? Heavy new supply typically softens prices + rents 12–24 months out; constrained supply supports both.
Investment metrics
- 1% rule
- 0.94% ✗
- Cap rate
- 8.09%
- Cash-on-cash
- 6.40%
- DSCR
- 1.28
- GRM
- 8.8
CMA / ARV
- ARV (on-the-fly)
- $1,940,004
- Comps found
- 3
Show comp detail 3 sales within ~0.75 mi
| Address | Dist | Beds/Ba | Sqft | Sold | Price | $/sf | Match |
|---|---|---|---|---|---|---|---|
| 7 Buscher Ct | 0.28mi | 5/2.5 (+1) | 3,284 (+1%) | 10mo | $1,375,000 | $419 | 69 |
| 11 1st St | 0.46mi | 3/3.5 (-1) | 3,114 (-5%) | 1mo | $1,850,000 | $594 | 65 |
| 178 S Country Rd | 0.48mi | 4/2.5 | 2,776 (-15%) | 20mo | $2,050,000 | $738 | 32 |
Match score weights: distance 35% · size 25% · config 20% · recency 20%. Top-matched comps best support the ARV.
Projected returns pro-forma
-3.0% appreciation · 3.0% rent growth · sell at horizon
- IRR
- -6.5%
- Equity multiple
- 0.76×
- Total profit
- $-134,315
- Equity at exit
- $297,461
- IRR
- 3.1%
- Equity multiple
- 1.22×
- Total profit
- $123,950
- Equity at exit
- $172,491
Cash invested: $558,600 (down + closing). Projections, not guarantees.
Landlord ↔ Tenant lean methodology
- Overall (STATE)
- 15 Strongly Tenant-Friendly
- State New York
- 15 Strongly Tenant-Friendly · D+10
- County
- — inherits STATE
- City
- — inherits STATE
ZIP-level market 11713
- Home prices YoY
- -26.0%
- Active inventory
- 57
- Price-to-rent
- 8.8×
Monthly cashflow live
- Estimated rent
- $18,851 medium interval (Pro) →
- Mortgage (P&I)
- −$10,462
- Tax from tax record
- −$618 /mo · $7,421/yr
- Insurance
- −$831
- HOA
- −$0
- Vacancy / Maint / Mgmt
- −$3,959
- Net cashflow
- $2,980
Break-even live
UW: 25.0% down · 7.5% · 30yr · 1.5% tax · 5.0% vac · 8.0% maint · 8.0% mgmt
Financing live
Cash to close
- Down payment
- $498,750
- Closing costs
- $59,850
- Reserves months
- —
- Total cash needed
- —
Loan-product check · same deal, 3 products live
Conventional
25% down · 7.5% · 30yr
- Down + closing
- —
- Monthly P&I
- —
- Monthly cashflow
- —
- DSCR
- —
- Eligible?
- —
Personal DTI + credit; lowest rate.
DSCR
20% down · 8.5% · 30yr
- Down + closing
- —
- Monthly P&I
- —
- Monthly cashflow
- —
- DSCR
- —
- Eligible?
- —
No personal income docs; deal must DSCR.
Hard money
10% down · 12.0% · 12mo
- Down + closing
- —
- Monthly P&I
- —
- Monthly cashflow
- —
- DSCR
- —
- Eligible?
- —
Short-term bridge; refi at stabilization.
Rent comps 2 comps
| Address | Beds | Baths | Sqft | Rent | $/sqft | DOM | Units | Dist |
|---|---|---|---|---|---|---|---|---|
| 11 1st St Bellport, NY | 3.0 | 3.5 | 3114 | $17,000 | $5.46 | 1d | 1 | 0.45mi |
| 5 Thorn Hedge Rd Bellport, NY | 3.0 | 2.5 | 3500 | $25,000 | $7.14 | 1d | 1 | 1.46mi |
Listing history 10 events
-
2026-06-18days on market $1,995,000 Active 12 DOM
-
2026-06-17days on market $1,995,000 Active 11 DOM
-
2026-06-16days on market $1,995,000 Active 10 DOM
-
2026-06-15days on market $1,995,000 Active 9 DOM
-
2026-06-13days on market $1,995,000 Active 7 DOM
-
2026-06-13days on market $1,995,000 Active 6 DOM
-
2026-06-09days on market $1,995,000 Active 3 DOM
-
2026-06-08days on market $1,995,000 Active 2 DOM
-
2026-06-07remarks 693-char remark
-
2026-06-07$1,995,000 Active 1 DOM
ⓘ Source: listings_history table (triggers on properties + properties_extension) + one-shot
backfill from property_details.listing_events for pre-trigger history.
Tax reassessment forecast NY · Partial reset (capped growth)
- Current annual tax
- $7,421 · $618/mo
- Projected year-2 tax
- $20,568 · $1,714/mo
- Expected delta
- +$13,147/yr (+$1,096/mo · 177.1%)
ⓘ Screening estimate from a state-policy table — verify with the county assessor before closing.
Climate risk First Street
- Flood 1/10 Low FEMA zone X (unshaded) · 0% chance over 30 yrs
- Wildfire 2/10 Low
- Heat 4/10 Moderate 7 d/yr ≥92°F today · 17 d/yr by 30 yrs out
- Wind 8/10 Severe 80% chance of damaging wind over 30 yrs
- Air quality 4/10 Moderate 3 unhealthy d/yr today · 5 by 30 yrs out
Nearby sold comps map
Loading sold comps map…
Walkable amenities ~0.75 mi
Loading nearby amenities…
Taxation est. · year 1
- Rental income
- $226,210
- − Mortgage interest
- −$111,751
- − Property taxes
- −$7,421
- − Insurance
- −$9,975
- − Repairs & maintenance
- −$18,097
- − Management
- −$18,097
- − Depreciation
- −$58,036
- Taxable income
- $2,833
- Est. tax owed @ 24.0%
- −$680
- After-tax cash flow
- $35,086/yr
For passive investors: Depreciation is non-cash, so a rental often shows a tax loss while cash-flowing — sheltering income. Rental losses are passive: they offset passive income freely, and up to $25,000/yr can offset ordinary (W-2) income if you actively participate and your MAGI is under $100k (phasing out to $0 by $150k); unused losses carry forward. On sale, claimed depreciation is recaptured at up to 25%, and gains may owe capital-gains tax (a 1031 exchange can defer both). Figures are a year-1 estimate at your 24.0% rate — not tax advice; consult a CPA.
Schools (NCES district)
- District
- South Country Central School District
- NCES district ID
- 3600008
- Math proficiency
- 50% ▲ 4.00%
- Reading proficiency
- 44% ▲ 4.00%
- Median HH income
- $74,049
- Composite
- 44.75/100
- National rank
- #5960
- State rank
- #460 of 755 in NY
Livability — Brookhaven
- Score
- 65/100
- State rank
- #681
- US rank
- #12842
Category grades
Schools grade is shown separately in the Schools card above.
Census & demographics
- Census place
- Brookhaven, NY
- City population
- 9,236
- Population (ZIP)
- 9,236
Population outlook (Suffolk County) Hauer SSP2
- Today (2025)
- 1,505,262 people
- By 2030
- 1,498,318 · -0.5%
- By 2040
- 1,471,101 · -2.3%
- By 2050
- 1,424,848 · -5.3%
- By 2075
- 1,337,157 · -11.2%
- By 2100
- 1,217,720 · -19.1%
Race, ethnicity, and origin ACS 2023
- Neighborhood character
- Diverse neighborhood (Simpson 0.64)
- Race & ethnicity
- White 50% Hispanic / Latino 30% Black 14% Two or more races 10% Asian 2%
- Hispanic origin (detail)
- Mexican 2% Puerto Rican 3% Dominican 1%
- Common ancestry
- Romanian 4% Italian 1% Lithuanian 1%
- Foreign-born
- 23% · Canada, Jamaica, China
- Languages at home
- 72% English-only · Spanish 23% Other Indo-European 3%
Political lean MEDSL · Suffolk
- 2024 margin
- Lean R (+10.0) · D 45.0% · R 55.0%
- 2008→2024 swing
- -16.0pp toward R · 2008: 6.0pp · 2024: -10.0pp
- All cycles
- 2024: R+10.0 2020: R+0.0 2016: R+8.2 2012: D+2.9 2008: D+6.0
Not yet ingested
- Civics
- —
Market trends
- HPI YoY
- ▼ -148.23%
- Current HPI
- 421.2165
- Rent YoY
- —
- Metro
- —
- State GDP YoY
- ▲ 2.60%
- F500 in state
- 92
Industry mix (Fortune 500 HQ in NY)
| Industry | F500 HQs | Revenue |
|---|---|---|
| Financial Services | 10 | $950B |
|
||
| Consumer Goods | 9 | $162B |
|
||
| Insurance | 4 | $225B |
|
||
| Telecommunications | 2 | $144B |
|
||
| Pharmaceuticals | 2 | $112B |
|
||
| Media / Entertainment | 2 | $69B |
|
||
Price history
+59.6% since first listed9 events — show timeline
- 2026-06-06 Listed $1,995,000 OneKey® MLS as Distributed by MLS Grid
- 2025-09-23 Sold (Public Records) $940,000 Public Records
- 2024-11-15 Listing Removed — OneKey® MLS as Distributed by MLS Grid
- 2024-09-30 Price Changed $999,000 OneKey® MLS as Distributed by MLS Grid
- 2024-09-09 Relisted — OneKey® MLS as Distributed by MLS Grid
- 2024-09-08 Listing Removed — OneKey® MLS as Distributed by MLS Grid
- 2024-08-05 Price Changed $1,100,000 OneKey® MLS as Distributed by MLS Grid
- 2024-06-21 Price Changed $1,150,000 OneKey® MLS as Distributed by MLS Grid
- 2024-04-09 Listed $1,250,000 OneKey® MLS as Distributed by MLS Grid
Property tax history
+1.6%/yrLatest (2025): $7,421 · +0.0% YoY. Source: county tax records.
Cash-flow waterfall
monthlySold comps — $/sqft
last 12 mo · ≤1 miLoading sold comps…