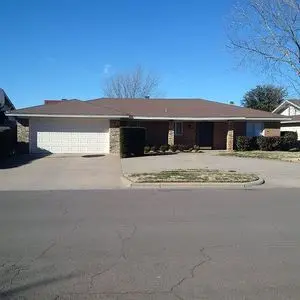
8012 Englewood Ave · Lubbock, TX
Flood risk 1/10 · Minimal
- FEMA flood zone
- X (unshaded)
- Chance of flooding over 30 yrs
- 0.0%
- Est. flood insurance / yr
- $507 – $1,088
Fire risk 1/10 · Minimal
- Est. fire insurance / yr
- $1,222 – $2,270
Heat risk 5/10 · Moderate
- Hot days now (above 99°F)
- 7 days/yr
- Hot days in 30 yrs
- 21 days/yr
Wind risk 2/10 · Minimal
- Chance of severe wind over 30 yrs
- —
Air-quality risk 2/10 · Minimal
- Unhealthy air days now
- 1 days/yr
- Unhealthy air days in 30 yrs
- 1 days/yr
Risk factors via First Street. Map © Google.
Why this score? — see what drove the D+ grade
The composite is a weighted blend of 9 inputs, each scored 0–100. Each bar is that input's sub-score; the figure is the points it added to the 100-point composite (weight × sub-score).
- Cash flow +17.6/30.0
- ARV discount +7.5/15.0
- 1% rule +5.5/10.0
- DSCR +5.5/10.0
- Livability +4.0/5.0
- Rent growth +3.2/5.0
- Schools +3.1/10.0
- Condition / age +2.5/5.0
- Appreciation +0.0/10.0
$178,000
🖨 Deal sheet 📄 Offer letter ✓ Due diligence
Listing remarks MLS
This beautifully updated home is centrally located and ready for a new owner! You will be wowed by the HUGE living room that has a stunning beamed, cathedral ceiling and brick fireplace. The kitchen has many incredible features like newer granite countertops, a tin backsplash, double ovens, and oil bronzed faucets. The master suite is large and isolated from the other two bedrooms. Each room has great walk in closets with built ins. Both of the bathrooms have been updated with beautiful tile in the tub/shower. The backyard is the absolute best. It has mature landscaping, two covered porches and a workshop with electricity and lots of natural light to be able to use for any number of purposes! Check out this home TODAY - and see all that it has to offer.
Key facts
- Built 1978
- Listed 27 days
Neighborhood map
What this means for you Summary
Snapshot
- This is a 3-bed/2.0-bath single-family listed at $178k.
Deal economics
- At list price, monthly cash flow is $140 ($2k/yr) — positive.
- The deal already cash-flows at list — no discount required.
- Meets the 1% rule at list price ($2k rent vs $178k).
- Recommended offer: $175k (1.5% below list) — sets the bar for market timing.
Location & tenants
- Location reads 80/100 on livability (#37 in TX, #1,749 nationally) — a professional / high-income tenant draw. Strengths: commute A+, cost of living A+, housing A+; Watch: employment C-, schools D+, crime F.
- Lubbock ISD (urban): math 36% / reading 39% proficiency, ranked #481 of 826 in TX (top 58%) — families likely to look elsewhere, expect single-tenant / working-renter base with shorter leases; 60% free/reduced lunch — lower-income household profile, screen leases tightly.
- Market conditions: Rents rising (+2.8%/yr); 705 active listings in the ZIP; 29 comparable units currently listed for rent nearby; rentals at typical pace (median 21d on market — plan ~3-4 weeks tenant-placement turnaround); 45% of comp listings sitting > 30 days — soft ceiling on asking rent; solid renter incomes; 2,219 units permitted in Lubbock County in 2024 (252 in 5+ unit buildings).
Forward outlook
- Local home prices are declining (-3.0%/yr); year-one equity from $1k of loan paydown is wiped out by about $5k of value loss. Plan a longer hold.
- Lubbock County population projected at +39% by 2050 — long-run rental-demand tailwind backs the buy-and-hold thesis.
Negotiation context
- It's been on market 27 days — a 2% lower offer ($175k) is reasonable based on typical stale-listing flexibility.
- 2 sale attempts since 6y ago with the ask held roughly flat each time — persistent listings suggest the price (not the market) is what's stuck; bring a comps-based counter.
Risks & watch-outs
- Climate carrying-cost: extreme-heat days projected 7→21/yr by 2055 (HVAC capex compounding) — expect insurance premiums to compound above CPI over the hold.
Questions for the listing agent
- Built in 1978 — when were the roof, HVAC, electrical panel, plumbing, and water heater last replaced?
- Is there a deadline driving the sale (1031 exchange, divorce, estate, relocation)? That informs how much negotiation room exists.
- Schools are D-rated, which usually means shorter tenancies and higher turnover. Who's the typical renter profile here, and what's been the actual vacancy rate?
- Crime grade is F in this area — have there been break-ins, vandalism, or insurance claims at this property in the last 3 years? What carrier currently insures it and at what premium?
- The area grade is low — what's the realistic commute time and amenity access for the typical tenant pool here? Any planned neighborhood developments (good or bad) we should know about?
- What's the average days-on-market for RENTAL listings here right now (not sales)? A rising rental-DOM trend means longer vacancies and softer asking-rent achievability than the comps imply.
- What's the recent tenant-quality profile in this submarket — average credit score on applications, eviction rate, late-payment / NSF rate, and stable-employment percentage? A property-management company in the area should have these aggregated.
- How much new for-sale + rental construction is in the pipeline within 1–3 miles? Heavy new supply typically softens prices + rents 12–24 months out; constrained supply supports both.
Investment metrics
- 1% rule
- 1.05% ✓
- Cap rate
- 7.24%
- Cash-on-cash
- 3.37%
- DSCR
- 1.15
- GRM
- 7.9
CMA / ARV
No comps found within radius.
Projected returns pro-forma
-3.0% appreciation · 2.75% rent growth · sell at horizon
- IRR
- -11.2%
- Equity multiple
- 0.59×
- Total profit
- $-20,294
- Equity at exit
- $26,540
- IRR
- -2.3%
- Equity multiple
- 0.85×
- Total profit
- $-7,711
- Equity at exit
- $15,390
Cash invested: $49,840 (down + closing). Projections, not guarantees.
Landlord ↔ Tenant lean methodology
- Overall (STATE)
- 87 Strongly Landlord-Friendly
- State Texas
- 87 Strongly Landlord-Friendly · R+5
- County
- — inherits STATE
- City
- — inherits STATE
ZIP-level market 79424
- Rents YoY
- 2.8%
- Active inventory
- 705
- Price-to-rent
- 7.9×
Monthly cashflow live
- Estimated rent
- $1,873 high interval (Pro) →
- Mortgage (P&I)
- −$933
- Tax from tax record
- −$332 /mo · $3,987/yr
- Insurance
- −$74
- HOA
- −$0
- Vacancy / Maint / Mgmt
- −$393
- Net cashflow
- $140
Break-even live
UW: 25.0% down · 7.5% · 30yr · 1.5% tax · 5.0% vac · 8.0% maint · 8.0% mgmt
Financing live
Cash to close
- Down payment
- $44,500
- Closing costs
- $5,340
- Reserves months
- —
- Total cash needed
- —
Loan-product check · same deal, 3 products live
Conventional
25% down · 7.5% · 30yr
- Down + closing
- —
- Monthly P&I
- —
- Monthly cashflow
- —
- DSCR
- —
- Eligible?
- —
Personal DTI + credit; lowest rate.
DSCR
20% down · 8.5% · 30yr
- Down + closing
- —
- Monthly P&I
- —
- Monthly cashflow
- —
- DSCR
- —
- Eligible?
- —
No personal income docs; deal must DSCR.
Hard money
10% down · 12.0% · 12mo
- Down + closing
- —
- Monthly P&I
- —
- Monthly cashflow
- —
- DSCR
- —
- Eligible?
- —
Short-term bridge; refi at stabilization.
Rent comps 29 comps
| Address | Beds | Baths | Sqft | Rent | $/sqft | DOM | Units | Dist |
|---|---|---|---|---|---|---|---|---|
| 5703 80th St Lubbock, TX | 3.0 | 2.0 | 2133 | $2,295 | $1.08 | 44d | 1 | 0.14mi |
| 5806 78th St Lubbock, TX | 3.0 | 2.0 | 1985 | $1,800 | $0.91 | 43d | 1 | 0.28mi |
| 5706 87th Pl Lubbock, TX | 3.0 | 2.0 | 1544 | $1,550 | $1.00 | 13d | 1 | 0.40mi |
| 5309 77th St Lubbock, TX | 4.0 | 2.5 | 2336 | $2,500 | $1.07 | 43d | 1 | 0.58mi |
| 5731 90th St Lubbock, TX | 3.0 | 2.0 | 1504 | $1,650 | $1.10 | 21d | 1 | 0.60mi |
| 5415 73rd St Lubbock, TX | 3.0 | 2.0 | 1725 | $1,849 | $1.07 | 21d | 1 | 0.65mi |
| 7911 Albany Ave Unit A Lubbock, TX | 3.0 | 2.0 | 1441 | $1,350 | $0.94 | 21d | 1 | 0.67mi |
| 7911 Albany Ave Unit B Lubbock, TX | 2.0 | 2.0 | 1441 | $1,350 | $0.94 | 13d | 1 | 0.67mi |
| 6024 74th St Lubbock, TX | 4.0 | 2.0 | 1997 | $1,999 | $1.00 | 43d | 1 | 0.69mi |
| 5560 93rd St Lubbock, TX | 3.0 | 2.0 | 1370 | $1,395 | $1.02 | 21d | 1 | 0.74mi |
| 5545 93rd St Lubbock, TX | 3.0 | 2.0 | 1370 | $1,450 | $1.06 | 43d | 1 | 0.79mi |
| 5715 69th St Lubbock, TX | 3.0 | 2.0 | 1796 | $1,725 | $0.96 | 43d | 1 | 0.79mi |
| 6904 Freeport Ave Lubbock, TX | 3.0 | 2.0 | 1820 | $2,150 | $1.18 | 43d | 1 | 0.79mi |
| 5513 95th St Lubbock, TX | 3.0 | 2.0 | 1785 | $1,575 | $0.88 | 21d | 1 | 0.92mi |
| 5732 67th St Lubbock, TX | 3.0 | 2.0 | 1700 | $1,575 | $0.93 | 13d | 1 | 0.93mi |
| 6603 Elkhart Ave Unit A Lubbock, TX | 2.0 | 1.5 | 1334 | $1,300 | $0.97 | 43d | 1 | 0.97mi |
| 5216 94th St Lubbock, TX | 3.0 | 2.0 | 1557 | $1,900 | $1.22 | 21d | 1 | 1.11mi |
| 9806 Genoa Ave Lubbock, TX | 4.0 | 2.0 | 1763 | $2,050 | $1.16 | 43d | 1 | 1.11mi |
| 5405 66th St Lubbock, TX | 1.0–3.0 | 1.0–2.0 | 874 | $1,280 | $1.46 | 21d | 19 | 1.15mi |
| 9701 Abbeville Ave Lubbock, TX | 3.0 | 2.0 | 1817 | $1,750 | $0.96 | 21d | 1 | 1.22mi |
| 5523 101st St Lubbock, TX | 3.0 | 2.0 | 1901 | $2,100 | $1.10 | 21d | 1 | 1.25mi |
| 6140 71st St Lubbock, TX | 3.0 | 2.5 | 1350 | $1,550 | $1.15 | 13d | 1 | 1.25mi |
| 9616 Kline Ave Lubbock, TX | 3.0 | 2.0 | 2198 | $2,150 | $0.98 | 44d | 1 | 1.35mi |
| 6550 85th St Lubbock, TX | 3.0 | 2.0 | 1711 | $1,700 | $0.99 | 21d | 1 | 1.36mi |
| 4822 73rd St Lubbock, TX | 3.0 | 2.0 | 1527 | $1,500 | $0.98 | 13d | 1 | 1.37mi |
| 4715 French Quarter Ct Lubbock, TX | 3.0 | 2.0 | 2386 | $2,400 | $1.01 | 43d | 1 | 1.40mi |
| 4804 76th St Unit A Lubbock, TX | 2.0 | 2.0 | 1333 | $1,350 | $1.01 | 43d | 1 | 1.42mi |
| 7616 Utica Ave Lubbock, TX | 3.0 | 2.5 | 1913 | $2,100 | $1.10 | 43d | 1 | 1.42mi |
| 6553 89th St Lubbock, TX | 3.0 | 2.0 | 1564 | $1,575 | $1.01 | 21d | 1 | 1.44mi |
Listing history 25 events
-
2026-06-18days on market $178,000 Active 27 DOM
-
2026-06-17days on market $178,000 Active 26 DOM
-
2026-06-16days on market $178,000 Active 25 DOM
-
2026-06-15days on market $178,000 Active 24 DOM
-
2026-06-14days on market $178,000 Active 22 DOM
-
2026-06-13days on market $178,000 Active 21 DOM
-
2026-06-10days on market $178,000 Active 19 DOM
-
2026-06-09days on market $178,000 Active 18 DOM
-
2026-06-08days on market $178,000 Active 17 DOM
-
2026-06-07days on market $178,000 Active 16 DOM
-
2026-06-05days on market $178,000 Active 13 DOM
-
2026-06-03days on market $178,000 Active 12 DOM
-
2026-06-02days on market $178,000 Active 11 DOM
-
2026-06-01days on market $178,000 Active 10 DOM
-
2026-05-31days on market $178,000 Active 9 DOM
-
2026-05-30days on market $178,000 Active 8 DOM
-
2026-05-23$178,000 Active
-
2020-02-24soldstatus
-
2020-02-18soldstatus 764-char remark
Show marketing remark (764 chars)
This beautifully updated home is centrally located and ready for a new owner! You will be wowed by the HUGE living room that has a stunning beamed, cathedral ceiling and brick fireplace. The kitchen has many incredible features like newer granite countertops, a tin backsplash, double ovens, and oil bronzed faucets. The master suite is large and isolated from the other two bedrooms. Each room has great walk in closets with built ins. Both of the bathrooms have been updated with beautiful tile in the tub/shower. The backyard is the absolute best. It has mature landscaping, two covered porches and a workshop with electricity and lots of natural light to be able to use for any number of purposes! Check out this home TODAY - and see all that it has to offer.
-
2020-01-06$169,900 764-char remark
Show marketing remark (764 chars)
This beautifully updated home is centrally located and ready for a new owner! You will be wowed by the HUGE living room that has a stunning beamed, cathedral ceiling and brick fireplace. The kitchen has many incredible features like newer granite countertops, a tin backsplash, double ovens, and oil bronzed faucets. The master suite is large and isolated from the other two bedrooms. Each room has great walk in closets with built ins. Both of the bathrooms have been updated with beautiful tile in the tub/shower. The backyard is the absolute best. It has mature landscaping, two covered porches and a workshop with electricity and lots of natural light to be able to use for any number of purposes! Check out this home TODAY - and see all that it has to offer.
-
2016-03-10soldstatus
-
2014-04-11soldstatus
-
2006-10-24soldstatus
-
1993-04-01soldstatus
-
1987-02-01soldstatus
ⓘ Source: listings_history table (triggers on properties + properties_extension) + one-shot
backfill from property_details.listing_events for pre-trigger history.
Tax reassessment forecast TX · Resets to sale price
- Current annual tax
- $3,987 · $332/mo
- Projected year-2 tax
- $3,987 · $332/mo
- Expected delta
- $0/yr ($0/mo · 0.0%)
ⓘ Screening estimate from a state-policy table — verify with the county assessor before closing.
Climate risk First Street
- Flood 1/10 Low FEMA zone X (unshaded) · 0% chance over 30 yrs
- Wildfire 1/10 Low
- Heat 5/10 Major 7 d/yr ≥99°F today · 21 d/yr by 30 yrs out
- Wind 2/10 Low
- Air quality 2/10 Low 1 unhealthy d/yr today · 1 by 30 yrs out
Nearby sold comps map
Loading sold comps map…
Walkable amenities ~0.75 mi
Loading nearby amenities…
Taxation est. · year 1
- Rental income
- $22,481
- − Mortgage interest
- −$9,971
- − Property taxes
- −$3,987
- − Insurance
- −$890
- − Repairs & maintenance
- −$1,798
- − Management
- −$1,798
- − Depreciation
- −$5,178
- Taxable loss
- −$1,142
- Est. tax savings @ 24.0%
- +$274
- After-tax cash flow
- $1,955/yr
For passive investors: Depreciation is non-cash, so a rental often shows a tax loss while cash-flowing — sheltering income. Rental losses are passive: they offset passive income freely, and up to $25,000/yr can offset ordinary (W-2) income if you actively participate and your MAGI is under $100k (phasing out to $0 by $150k); unused losses carry forward. On sale, claimed depreciation is recaptured at up to 25%, and gains may owe capital-gains tax (a 1031 exchange can defer both). Figures are a year-1 estimate at your 24.0% rate — not tax advice; consult a CPA.
Schools (NCES district)
- District
- Lubbock ISD
- NCES district ID
- 4828500
- Math proficiency
- 36% ▼ -8.00%
- Reading proficiency
- 39% ▼ -1.00%
- Median HH income
- $39,820
- Composite
- 31.44/100
- National rank
- #5984
- State rank
- #481 of 826 in TX
Livability — Lubbock
- Score
- 80/100
- State rank
- #37
- US rank
- #1749
Category grades
Schools grade is shown separately in the Schools card above.
Census & demographics
- Census place
- Lubbock, TX
- County
- Lubbock County · 293,542 people
- City population
- 283,030
- Metro
- Lubbock, TX
- Population (ZIP)
- 53,478
- Household income
- $97,231
- Rent vs Own
- Severe rent burden
- 1958.0
Population outlook (Lubbock County) Hauer SSP2
- Today (2025)
- 345,960 people
- By 2030
- 371,449 · +7.4%
- By 2040
- 424,539 · +22.7%
- By 2050
- 481,150 · +39.1%
- By 2075
- 633,467 · +83.1%
- By 2100
- 746,853 · +115.9%
Race, ethnicity, and origin ACS 2023
- Neighborhood character
- Predominantly White (71%)
- Race & ethnicity
- White 71% Hispanic / Latino 21% Two or more races 12% Asian 3% Black 2%
- Hispanic origin (detail)
- Mexican 17%
- Common ancestry
- Slovak 2% Italian 2% Lithuanian 1%
- Foreign-born
- 6% · Canada, China
- Languages at home
- 88% English-only · Spanish 8% Chinese 1% Tagalog/Filipino 1%
Political lean MEDSL · Lubbock
- 2024 margin
- Solid R (+39.5) · D 29.7% · R 69.2% · Other 1.0%
- 2008→2024 swing
- -2.8pp toward R · 2008: -36.7pp · 2024: -39.5pp
- All cycles
- 2024: R+39.5 2020: R+32.2 2016: R+38.4 2012: R+40.9 2008: R+36.7
Not yet ingested
- Civics
- —
Market trends
- HPI YoY
- ▼ -146.64%
- Current HPI
- 213.2155
- Rent YoY
- ▲ 2.75%
- Metro
- Lubbock, TX
- State GDP YoY
- ▲ 3.95%
- F500 in state
- 110
Industry mix (Fortune 500 HQ in TX)
| Industry | F500 HQs | Revenue |
|---|---|---|
| Energy | 16 | $1,198B |
|
||
| Technology | 5 | $198B |
|
||
| Engineering / Construction | 4 | $72B |
|
||
| Energy Services | 3 | $60B |
|
||
| Utilities | 3 | $41B |
|
||
| Healthcare | 2 | $330B |
|
||
Price history
+4.8% since first listed9 events — show timeline
- 2026-05-23 Listed $178,000 FSBO.com
- 2020-02-24 Sold (Public Records) — Public Records
- 2020-02-18 Sold (MLS) — LARMLS
- 2020-01-06 Listed $169,900 LARMLS
- 2016-03-10 Sold (Public Records) — Public Records
- 2014-04-11 Sold (Public Records) — Public Records
- 2006-10-24 Sold (Public Records) — Public Records
- 1993-04-01 Sold (Public Records) — Public Records
- 1987-02-01 Sold (Public Records) — Public Records
Property tax history
+4.0%/yrLatest (2025): $3,987 · +9.8% YoY. Source: county tax records.
Cash-flow waterfall
monthlySold comps — $/sqft
last 12 mo · ≤1 miLoading sold comps…