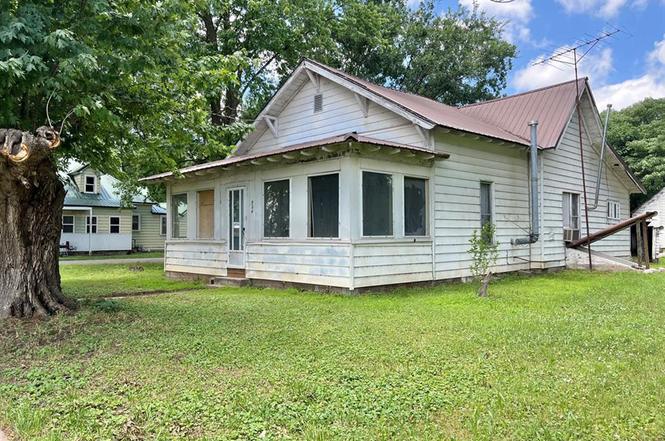
324 W Main St · Essex, MO
Flood risk 1/10 · Minimal
- FEMA flood zone
- —
- Chance of flooding over 30 yrs
- 0.0%
- Est. flood insurance / yr
- —
Fire risk 1/10 · Minimal
- Est. fire insurance / yr
- $1,054 – $1,958
Heat risk 6/10 · Moderate
- Hot days now (above 109°F)
- 7 days/yr
- Hot days in 30 yrs
- 20 days/yr
Wind risk 3/10 · Minor
- Chance of severe wind over 30 yrs
- 6.0%
Air-quality risk 1/10 · Minimal
- Unhealthy air days now
- 0 days/yr
- Unhealthy air days in 30 yrs
- 0 days/yr
Risk factors via First Street. Map © Google.
Why this score? — see what drove the B+ grade
The composite is a weighted blend of 9 inputs, each scored 0–100. Each bar is that input's sub-score; the figure is the points it added to the 100-point composite (weight × sub-score).
- Cash flow +30.0/30.0
- 1% rule +10.0/10.0
- DSCR +10.0/10.0
- ARV discount +7.5/15.0
- Schools +6.9/10.0
- Appreciation +5.0/10.0
- Livability +3.3/5.0
- Rent growth +2.5/5.0
- Condition / age +2.5/5.0
$37,500
🖨 Deal sheet 📄 Offer letter ✓ Due diligence
Listing remarks
Discover the character and charm of this spacious 3–4 bedroom home situated on a desirable corner lot in Essex. Featuring original woodwork, classic pocket doors, and hardwood flooring, this home offers timeless appeal with modern updates. The bathroom was completely renovated in 2026, and the interior has been freshly painted throughout, creating a welcoming atmosphere. Outside, you'll find a large yard with plenty of space for children, pets, gardening, or entertaining. Located in the Richland School District, this property combines small-town living with room to grow, making it an excellent choice for families of any size.
Key facts
- Classic pocket doors
- Hardwood flooring
- Large yard
Tags
Property features AI
Finance
- Other: Above-grade finished area approx. 1,400 (assessor)
- Financial info: Lease not considered
Exterior
- Parking: Driveway with tandem parking
- Utilities: Public water; Public sewer; Electricity connected (220 volts)
- Home design: Single-family residence; One story; Fixer condition; Private ownership
- Construction: Metal siding; Metal roof; Brick/mortar and pillar/post/pier foundation; House structure type; Built year per assessor
- Exterior features: Enclosed front porch; Corner lot; Asphalt road frontage; Utility building on property; Park nearby
Interior
- Kitchen: Kitchen
- Bedrooms: Three bedrooms (all on the main level)
- Flooring: Carpet
- Bathrooms: One full bathroom (main level)
- Heating & cooling: Natural gas heating; Ductless heating; Ceiling fan(s)
- Interior features: High ceilings; Cellar (basement)
- Laundry & utility: Main-level laundry room with washer and electric dryer hookups; Gas water heater
Neighborhood map
What this means for you Summary
Snapshot
- This is a 3-bed/1.0-bath other listed at $38k.
Deal economics
- At list price, monthly cash flow is $622 ($7k/yr) — positive.
- The deal already cash-flows at list — no discount required.
- Meets the 1% rule at list price ($1k rent vs $38k).
Location & tenants
- Location reads 66/100 on livability (#245 in MO) — a middle-class / working-renter tenant base. Strengths: cost of living A+, housing A+; Watch: health & safety C-, crime F, amenities F.
- Richland R-I (rural): math 80% / reading 85% proficiency, ranked #1 of 535 in MO (top 0%) — strong family-tenant draw, lease renewals of 3-5y typical.
- Zoned schools: Richland Elem. (math 77% / reading 87%, grade A+, #4 of 1,115 statewide, top 0%, 145 students, 60% FRL); Richland High (math 32% / reading 57%, grade F, #179 of 521 statewide, top 39%, 122 students, 65% FRL).
- Zoned-school proficiency averages 63% at this address vs 82% district-wide (-19 pts) — the specific schools serving this property underperform the Richland R-I average; the district grade overstates school quality for this exact location.
- Market conditions: 5 active listings in the ZIP; 17 units permitted in Stoddard County in 2024 (0 in 5+ unit buildings).
Forward outlook
- In year one you build about $1k of equity ($259 loan paydown + $1k appreciation (3.0% local appreciation)).
- Stoddard County population projected at -12% by 2050 — secular population decline; favor cash flow + early exit over multi-decade hold.
- At projected returns (3.0% appreciation + 3.0% rent growth), your $10k cash investment doubles in ~2 years — after that, you're playing with house money.
Negotiation context
- Only 3 days on market — expect competitive offers; lowballing is unlikely to land.
- 3 sale attempts with the ask held roughly flat each time — persistent listings suggest the price (not the market) is what's stuck; bring a comps-based counter.
Risks & watch-outs
- Watch-outs: built in 1920 — expect roof / HVAC / electrical / plumbing capex.
- Climate carrying-cost: extreme-heat days projected 7→20/yr by 2055 (HVAC capex compounding) — expect insurance premiums to compound above CPI over the hold.
Questions for the listing agent
- Built in 1920 — when were the roof, HVAC, electrical panel, plumbing, and water heater last replaced?
- Is there a deadline driving the sale (1031 exchange, divorce, estate, relocation)? That informs how much negotiation room exists.
- Schools are B-rated — typically a magnet for longer-tenancy family renters. What's the average tenant stay here, and is there a school-zone premium baked into asking?
- Crime grade is F in this area — have there been break-ins, vandalism, or insurance claims at this property in the last 3 years? What carrier currently insures it and at what premium?
- What's the average days-on-market for RENTAL listings here right now (not sales)? A rising rental-DOM trend means longer vacancies and softer asking-rent achievability than the comps imply.
- What's the recent tenant-quality profile in this submarket — average credit score on applications, eviction rate, late-payment / NSF rate, and stable-employment percentage? A property-management company in the area should have these aggregated.
- How much new for-sale + rental construction is in the pipeline within 1–3 miles? Heavy new supply typically softens prices + rents 12–24 months out; constrained supply supports both.
Investment metrics
- 1% rule
- 2.91% ✓
- Cap rate
- 26.20%
- Cash-on-cash
- 71.08%
- DSCR
- 4.16
- GRM
- 2.9
CMA / ARV
No comps found within radius.
Projected returns pro-forma
3.0% appreciation · 3.0% rent growth · sell at horizon
- IRR
- 75.7%
- Equity multiple
- 5.20×
- Total profit
- $44,135
- Equity at exit
- $16,862
- IRR
- 75.2%
- Equity multiple
- 10.68×
- Total profit
- $101,612
- Equity at exit
- $25,986
Cash invested: $10,500 (down + closing). Projections, not guarantees.
Landlord ↔ Tenant lean methodology
- Overall (STATE)
- 81 Strongly Landlord-Friendly
- State Missouri
- 81 Strongly Landlord-Friendly · R+10
- County
- — inherits STATE
- City
- — inherits STATE
ZIP-level market 63846
- Active inventory
- 5
- Price-to-rent
- 2.9×
Monthly cashflow live
- Estimated rent
- $1,091 medium interval (Pro) →
- Mortgage (P&I)
- −$197
- Tax from tax record
- −$28 /mo · $335/yr
- Insurance
- −$16
- HOA
- −$0
- Vacancy / Maint / Mgmt
- −$229
- Net cashflow
- $622
Break-even live
UW: 25.0% down · 7.5% · 30yr · 1.5% tax · 5.0% vac · 8.0% maint · 8.0% mgmt
Financing live
Cash to close
- Down payment
- $9,375
- Closing costs
- $1,125
- Reserves months
- —
- Total cash needed
- —
Loan-product check · same deal, 3 products live
Conventional
25% down · 7.5% · 30yr
- Down + closing
- —
- Monthly P&I
- —
- Monthly cashflow
- —
- DSCR
- —
- Eligible?
- —
Personal DTI + credit; lowest rate.
DSCR
20% down · 8.5% · 30yr
- Down + closing
- —
- Monthly P&I
- —
- Monthly cashflow
- —
- DSCR
- —
- Eligible?
- —
No personal income docs; deal must DSCR.
Hard money
10% down · 12.0% · 12mo
- Down + closing
- —
- Monthly P&I
- —
- Monthly cashflow
- —
- DSCR
- —
- Eligible?
- —
Short-term bridge; refi at stabilization.
Listing history 4 events
-
2026-06-18days on market $37,500 Active 3 DOM
-
2026-06-17days on market $37,500 Active 2 DOM
-
2026-06-16remarks 633-char remark
-
2026-06-16$37,500 Active 1 DOM
ⓘ Source: listings_history table (triggers on properties + properties_extension) + one-shot
backfill from property_details.listing_events for pre-trigger history.
Tax reassessment forecast MO · Resets to sale price
- Current annual tax
- $335 · $28/mo
- Projected year-2 tax
- $364 · $30/mo
- Expected delta
- +$28/yr (+$2/mo · 8.5%)
ⓘ Screening estimate from a state-policy table — verify with the county assessor before closing.
Climate risk First Street
- Flood 1/10 Low 0% chance over 30 yrs
- Wildfire 1/10 Low
- Heat 6/10 Major 7 d/yr ≥109°F today · 20 d/yr by 30 yrs out
- Wind 3/10 Moderate 6% chance of damaging wind over 30 yrs
- Air quality 1/10 Low 0 unhealthy d/yr today · 0 by 30 yrs out
Nearby sold comps map
Loading sold comps map…
Walkable amenities ~0.75 mi
Loading nearby amenities…
Taxation est. · year 1
- Rental income
- $13,096
- − Mortgage interest
- −$2,101
- − Property taxes
- −$335
- − Insurance
- −$188
- − Repairs & maintenance
- −$1,048
- − Management
- −$1,048
- − Depreciation
- −$1,091
- Taxable income
- $7,287
- Est. tax owed @ 24.0%
- −$1,749
- After-tax cash flow
- $5,715/yr
For passive investors: Depreciation is non-cash, so a rental often shows a tax loss while cash-flowing — sheltering income. Rental losses are passive: they offset passive income freely, and up to $25,000/yr can offset ordinary (W-2) income if you actively participate and your MAGI is under $100k (phasing out to $0 by $150k); unused losses carry forward. On sale, claimed depreciation is recaptured at up to 25%, and gains may owe capital-gains tax (a 1031 exchange can defer both). Figures are a year-1 estimate at your 24.0% rate — not tax advice; consult a CPA.
Schools (NCES district)
- District
- Richland R-I
- NCES district ID
- 2926400
- Math proficiency
- 80% ▼ -5.00%
- Reading proficiency
- 85% ▲ 5.00%
- Median HH income
- $39,073
- Composite
- 69.37/100
- National rank
- #620
- State rank
- #1 of 535 in MO
Livability — Essex
- Score
- 66/100
- State rank
- #245
- US rank
- #12094
Category grades
Schools grade is shown separately in the Schools card above.
Census & demographics
- Census place
- Essex, MO
- Population (ZIP)
- 1,110
Population outlook (Stoddard County) Hauer SSP2
- Today (2025)
- 29,096 people
- By 2030
- 28,478 · -2.1%
- By 2040
- 27,073 · -7.0%
- By 2050
- 25,512 · -12.3%
- By 2075
- 21,740 · -25.3%
- By 2100
- 17,841 · -38.7%
Race, ethnicity, and origin ACS 2023
- Neighborhood character
- Predominantly White (89%)
- Race & ethnicity
- White 89% Black 8% Hispanic / Latino 1% Two or more races 1%
- Common ancestry
- Lithuanian 3% Iranian 1% Serbian 1%
Political lean MEDSL · Stoddard
- 2024 margin
- Solid R (+73.9) · D 12.8% · R 86.7%
- 2008→2024 swing
- -34.1pp toward R · 2008: -39.8pp · 2024: -73.9pp
- All cycles
- 2024: R+73.9 2020: R+72.0 2016: R+69.3 2012: R+49.3 2008: R+39.8
Not yet ingested
- Civics
- —
Market trends
- HPI YoY
- —
- Current HPI
- —
- Rent YoY
- —
- Metro
- —
- State GDP YoY
- ▲ 1.84%
- F500 in state
- 20
Industry mix (Fortune 500 HQ in MO)
| Industry | F500 HQs | Revenue |
|---|---|---|
| Healthcare | 1 | $163B |
|
||
| Insurance | 1 | $21B |
|
||
| Industrial Technology | 1 | $17B |
|
||
| Retail | 1 | $16B |
|
||
| Industrial Distribution | 1 | $10B |
|
||
| Utilities | 1 | $9B |
|
||
Price history
+0.0% since first listed3 events — show timeline
- 2026-06-15 Listed $37,500 MARIS as Distributed by MLS Grid
- 2026-02-12 Relisted — MARIS as Distributed by MLS Grid
- 2025-11-12 Listed $37,500 MARIS as Distributed by MLS Grid
Property tax history
+3.7%/yrLatest (2025): $335 · +10.6% YoY. Source: county tax records.
Cash-flow waterfall
monthlySold comps — $/sqft
last 12 mo · ≤1 miLoading sold comps…