 Fourplex
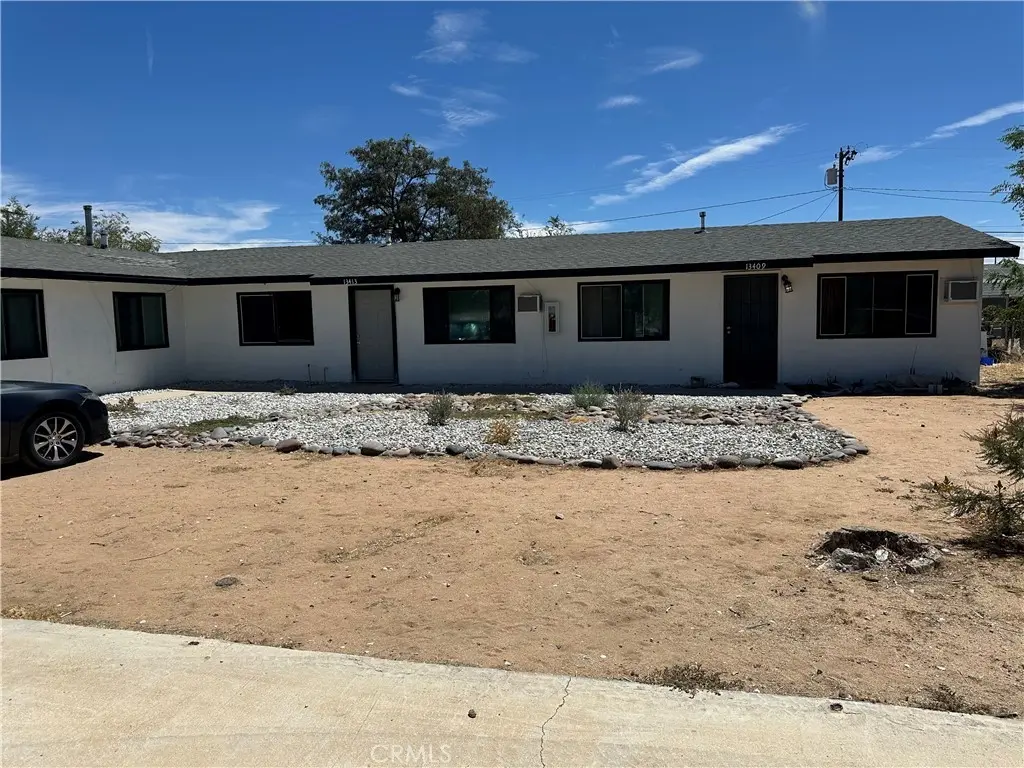
13409 Mohawk Rd · Apple Valley, CA
Flood risk 1/10 · Minimal
- FEMA flood zone
- D
- Chance of flooding over 30 yrs
- 0.0%
- Est. flood insurance / yr
- $544 – $1,084
Fire risk 5/10 · Moderate
- Est. fire insurance / yr
- $659 – $1,223
Heat risk 7/10 · Major
- Hot days now (above 100°F)
- 6 days/yr
- Hot days in 30 yrs
- 16 days/yr
Wind risk 1/10 · Minimal
- Chance of severe wind over 30 yrs
- —
Air-quality risk 10/10 · Severe
- Unhealthy air days now
- 25 days/yr
- Unhealthy air days in 30 yrs
- 30 days/yr
Risk factors via First Street. Map © Google.
Why this score? — see what drove the C+ grade
The composite is a weighted blend of 9 inputs, each scored 0–100. Each bar is that input's sub-score; the figure is the points it added to the 100-point composite (weight × sub-score).
- Cash flow +30.0/30.0
- DSCR +10.0/10.0
- 1% rule +8.8/10.0
- Rent growth +3.6/5.0
- Schools +3.1/10.0
- Livability +3.1/5.0
- Condition / age +2.5/5.0
- ARV discount +0.0/15.0
- Appreciation +0.0/10.0
$675,000
🖨 Deal sheet 📄 Offer letter ✓ Due diligence
Multi-family units
County records classify this as Multi-Family (2-4 Unit). Listing-text estimate: 4 units. confirmed
Listing remarks
Hwy 18 turn right to Kiowa Rd to Ottawa Rd. turn right to Mohawk Rd. 4-Plex in Apple Valley. Why build when you can buy for less? constructing a similar 4-plex would cost significantly more in materials, labor and time. Recent updates to this property add exceptional value making it a smart investment choice. One unit has 2 bedrooms, 2 units with 1 bedroom and one studio. 3 units have separate gas and electric meters and the studio shares meters with the laundry room is equipped with coin operated machine.
Key facts
- 0.49 acre lot
- 4 garage spots
- Built 1965
Property features AI
Finance
- Other: Lot features indicate density of 2–5 units per acre; Parcel number available
- Financial info: Total building area: 2,348; Gross scheduled income: $4,700; Gross income: $4,700; Net operating income: $4,300; Operating expenses: $400; Insurance expense: $3,500; Electric expense: $100; Trash expense: $250; Tenants pay all utilities; Number of leased units: 4
- HOA & community: Common interest: Community Apartment
Exterior
- Parking: Total of 4 parking spaces; Four garage spaces (one garage space allocated per unit)
- Utilities: Public sewer; District/public water
- Home design: Attached community apartment; Single-story building; Has a view; Entry located at street level
- Construction: One building containing all units; Year built source: Assessor
- Exterior features: No pool; Street lighting in the neighborhood
Interior
- Kitchen: Kitchens present in each unit (appliances not specified)
- Bedrooms: Four units total: two 2-bedroom units and two 1-bedroom units (unit breakdown provided under multi-unit info)
- Bathrooms: Each unit has one full bathroom
- Heating & cooling: Wall/window cooling units
- Interior features: Multi/split and one-level layout; Street-level entry; Laundry room
- Laundry & utility: On-site laundry area; Each unit has separate water, gas and electric meters (4 separate meters)
Neighborhood map
What this means for you Summary
Snapshot
- This is a 4 × 6-bed/?-bath units multifamily listed at $675k.
Deal economics
- At list price, monthly cash flow is $3k ($37k/yr) — positive. Per door: $775/mo.
- The deal already cash-flows at list — no discount required.
- Meets the 1% rule at list price ($9k rent vs $675k).
- Recommended offer: $655k (3.0% below list) — sets the bar for market timing.
- Cap rate 11.8% vs local median 3.5% in Apple Valley — top-decile yield for the area; either an underpriced asset or a hidden risk that comps aren't pricing in. Stress-test before assuming the spread holds.
Location & tenants
- Location reads 61/100 on livability (#532 in CA) — a middle-class / working-renter tenant base. Strengths: housing A+, commute B+; Watch: employment D+, schools F, crime D-.
- Apple Valley Unified (suburban): math 25% / reading 40% proficiency, ranked #955 of 1,400 in CA (top 68%) — families likely to look elsewhere, expect single-tenant / working-renter base with shorter leases; 60% free/reduced lunch — lower-income household profile, screen leases tightly.
- Market conditions: Rents rising fast (+4.3%/yr); 417 active listings in the ZIP; 5,458 units permitted in San Bernardino County in 2024 (1,500 in 5+ unit buildings).
- At $9,327/mo this rent would consume 168% of the median local household income ($67k/yr) (locally 1389% of renters already pay >50% of income on rent) — very limited rent-growth headroom before tenants either downsize or default.
Forward outlook
- Local home prices are declining (-3.0%/yr); year-one equity from $5k of loan paydown is wiped out by about $20k of value loss. Plan a longer hold.
- San Bernardino County population projected at +15% by 2050 — modest demand growth; plan on rents tracking national, not racing it.
- At projected returns (-3.0% appreciation + 4.3% rent growth), your $189k cash investment doubles in ~6 years — after that, you're playing with house money.
Negotiation context
- It's been on market 42 days — a 3% lower offer ($655k) is reasonable based on typical stale-listing flexibility.
- 14 sale attempts since 12y ago with the ask held roughly flat each time — persistent listings suggest the price (not the market) is what's stuck; bring a comps-based counter.
- Current owner paid $400k; list at $675k implies a 69% gain — meaningful room to come down on a strong offer.
Risks & watch-outs
- Climate carrying-cost: moderate wildfire risk; extreme-heat days projected 6→16/yr by 2055 (HVAC capex compounding) — expect insurance premiums to compound above CPI over the hold.
Questions for the listing agent
- It's been on market 42 days. Have you received any prior offers? Is the seller open to a 3% concession, seller financing, or rate buy-down credit?
- Can we see the unit-by-unit rent roll, current vacancy, and any below-market leases? What's the average tenancy length?
- What capital expenditures (roof, boiler, parking lot, exteriors) have been made in the last 5 years, and what's planned in the next 2?
- Built in 1965 — when were the roof, HVAC, electrical panel, plumbing, and water heater last replaced?
- Is there a deadline driving the sale (1031 exchange, divorce, estate, relocation)? That informs how much negotiation room exists.
- Schools are F-rated, which usually means shorter tenancies and higher turnover. Who's the typical renter profile here, and what's been the actual vacancy rate?
- Crime grade is D in this area — have there been break-ins, vandalism, or insurance claims at this property in the last 3 years? What carrier currently insures it and at what premium?
- What's the average days-on-market for RENTAL listings here right now (not sales)? A rising rental-DOM trend means longer vacancies and softer asking-rent achievability than the comps imply.
- What's the recent tenant-quality profile in this submarket — average credit score on applications, eviction rate, late-payment / NSF rate, and stable-employment percentage? A property-management company in the area should have these aggregated.
- How much new apartment / multifamily construction is in the pipeline within 1–3 miles? Heavy new supply (>2% of stock underway) typically softens rents 12–24 months out; light construction supports rent growth.
Investment metrics
- 1% rule
- 1.38% ✓
- Cap rate
- 11.80%
- Cash-on-cash
- 19.68%
- DSCR
- 1.88
- GRM
- 6.0
CMA / ARV
- ARV (median comp)
- $490,603
- List price
- $675,000
- Delta
- 37.59%
- Verdict
- OVERPRICED
- Comps
- 20 within 1.0 mi
Projected returns pro-forma
-3.0% appreciation · 4.3% rent growth · sell at horizon
- IRR
- 13.1%
- Equity multiple
- 1.53×
- Total profit
- $100,267
- Equity at exit
- $100,645
- IRR
- 22.9%
- Equity multiple
- 3.08×
- Total profit
- $393,138
- Equity at exit
- $58,362
Cash invested: $189,000 (down + closing). Projections, not guarantees.
Landlord ↔ Tenant lean methodology
- Overall (STATE)
- 18 Strongly Tenant-Friendly
- State California
- 18 Strongly Tenant-Friendly · D+13
- County
- — inherits STATE
- City
- — inherits STATE
ZIP-level market 92308
- Home prices YoY
- -28.8%
- Rents YoY
- 4.3%
- Active inventory
- 417
- Price-to-rent
- 24.1×
Monthly cashflow live
- Estimated rent
- $9,327 medium interval (Pro) →
- Mortgage (P&I)
- −$3,540
- Tax from tax record
- −$448 /mo · $5,377/yr
- Insurance
- −$281
- HOA
- −$0
- Vacancy / Maint / Mgmt
- −$1,959
- Net cashflow
- $3,099
Break-even live
4-unit breakdown (identical units grouped — click to expand)
| Units | Beds | Baths | Est. rent |
|---|---|---|---|
| 4× units | 6 | — | $9,328 |
| #1 | 6 | — | $2,332 |
| #2 | 6 | — | $2,332 |
| #3 | 6 | — | $2,332 |
| #4 | 6 | — | $2,332 |
| Total (4 units) | $9,327 | ||
UW: 25.0% down · 7.5% · 30yr · 1.5% tax · 5.0% vac · 8.0% maint · 8.0% mgmt
Financing live
Cash to close
- Down payment
- $168,750
- Closing costs
- $20,250
- Reserves months
- —
- Total cash needed
- —
Loan-product check · same deal, 3 products live
Conventional
25% down · 7.5% · 30yr
- Down + closing
- —
- Monthly P&I
- —
- Monthly cashflow
- —
- DSCR
- —
- Eligible?
- —
Personal DTI + credit; lowest rate.
DSCR
20% down · 8.5% · 30yr
- Down + closing
- —
- Monthly P&I
- —
- Monthly cashflow
- —
- DSCR
- —
- Eligible?
- —
No personal income docs; deal must DSCR.
Hard money
10% down · 12.0% · 12mo
- Down + closing
- —
- Monthly P&I
- —
- Monthly cashflow
- —
- DSCR
- —
- Eligible?
- —
Short-term bridge; refi at stabilization.
Listing history 50 events
-
2026-06-15days on market $675,000 Active 42 DOM
-
2026-06-13days on market $675,000 Active 40 DOM
-
2026-06-13days on market $675,000 Active 39 DOM
-
2026-06-09days on market $675,000 Active 36 DOM
-
2026-06-08days on market $675,000 Active 35 DOM
-
2026-06-07days on market $675,000 Active 34 DOM
-
2026-06-04days on market $675,000 Active 31 DOM
-
2026-06-03days on market $675,000 Active 30 DOM
-
2026-06-02days on market $675,000 Active 29 DOM
-
2026-06-01days on market $675,000 Active 28 DOM
-
2026-05-31days on market $675,000 Active 27 DOM
-
2026-05-04$675,000 Active 511-char remark
-
2026-05-04historical
-
2025-12-14$675,000 Active
-
2025-10-14historical
-
2025-08-05$675,000 Active
-
2021-12-16soldstatus $400,000 Closed Sale
-
2021-12-15soldstatus $400,000
-
2021-10-22status Pending Sale
-
2021-09-08$420,000 Active
-
2019-12-20soldstatus $330,000 Closed Sale
-
2019-12-19soldstatus $330,000
-
2019-09-26historical Active Under Contract
-
2019-08-14price $329,000
-
2019-08-08price $339,500
-
2019-07-08$349,900 Active
-
2017-06-22historical
-
2017-06-22historical
-
2017-01-15$275,000 Active
-
2017-01-13$275,000
-
2017-01-06historical
-
2017-01-06historical
-
2016-12-23price $275,000
-
2016-08-13status Active
-
2016-08-13price $259,000
-
2016-08-01historical
-
2016-05-19price $255,000
-
2016-04-19price $265,000
-
2016-01-08$275,000 Active
-
2016-01-08$275,000
-
2014-09-30soldstatus $185,000
-
2014-09-30soldstatus $185,000
-
2014-09-30soldstatus $185,000 Closed Sale
-
2014-09-30soldstatus $185,000
-
2014-09-17status Pending Sale
-
2014-08-17status Pending
-
2014-07-29price $184,000
-
2014-07-07price $185,000
-
2014-06-16status Active
-
2014-06-05status Backup Offers Accepted
ⓘ Source: listings_history table (triggers on properties + properties_extension) + one-shot
backfill from property_details.listing_events for pre-trigger history.
Tax reassessment forecast CA · Resets to sale price
- Current annual tax
- $5,377 · $448/mo
- Projected year-2 tax
- $5,377 · $448/mo
- Expected delta
- $0/yr ($0/mo · 0.0%)
ⓘ Screening estimate from a state-policy table — verify with the county assessor before closing.
Climate risk First Street
- Flood 1/10 Low FEMA zone D · 0% chance over 30 yrs
- Wildfire 5/10 Major
- Heat 7/10 Severe 6 d/yr ≥100°F today · 16 d/yr by 30 yrs out
- Wind 1/10 Low
- Air quality 10/10 Extreme 25 unhealthy d/yr today · 30 by 30 yrs out
Nearby sold comps map
Loading sold comps map…
Walkable amenities ~0.75 mi
Loading nearby amenities…
Taxation est. · year 1
- Rental income
- $111,924
- − Mortgage interest
- −$37,810
- − Property taxes
- −$5,377
- − Insurance
- −$3,375
- − Repairs & maintenance
- −$8,954
- − Management
- −$8,954
- − Depreciation
- −$19,636
- Taxable income
- $27,817
- Est. tax owed @ 24.0%
- −$6,676
- After-tax cash flow
- $30,515/yr
For passive investors: Depreciation is non-cash, so a rental often shows a tax loss while cash-flowing — sheltering income. Rental losses are passive: they offset passive income freely, and up to $25,000/yr can offset ordinary (W-2) income if you actively participate and your MAGI is under $100k (phasing out to $0 by $150k); unused losses carry forward. On sale, claimed depreciation is recaptured at up to 25%, and gains may owe capital-gains tax (a 1031 exchange can defer both). Figures are a year-1 estimate at your 24.0% rate — not tax advice; consult a CPA.
Schools (NCES district)
- District
- Apple Valley Unified
- NCES district ID
- 0600017
- Math proficiency
- 25% ▬ 0.00%
- Reading proficiency
- 40% ▬ 0.00%
- Median HH income
- $49,264
- Composite
- 30.91/100
- National rank
- #11351
- State rank
- #955 of 1400 in CA
Livability — Apple Valley
- Score
- 61/100
- State rank
- #532
- US rank
- #17800
Category grades
Schools grade is shown separately in the Schools card above.
Census & demographics
- Census place
- Apple Valley, CA
- County
- San Bernardino County · 2,030,291 people
- City population
- 83,889
- Metro
- Riverside-San Bernardino-Ontario, CA
- Population (ZIP)
- 42,709
- Household income
- $66,568
- Rent vs Own
- Severe rent burden
- 1389.0
Population outlook (San Bernardino County) Hauer SSP2
- Today (2025)
- 2,300,329 people
- By 2030
- 2,378,907 · +3.4%
- By 2040
- 2,523,137 · +9.7%
- By 2050
- 2,642,388 · +14.9%
- By 2075
- 2,880,769 · +25.2%
- By 2100
- 2,909,436 · +26.5%
Race, ethnicity, and origin ACS 2023
- Neighborhood character
- Diverse neighborhood (Simpson 0.65)
- Race & ethnicity
- White 44% Hispanic / Latino 38% Two or more races 19% Black 9% Asian 3%
- Hispanic origin (detail)
- Mexican 34%
- Common ancestry
- Italian 1% Iranian 1% Slovak 1%
- Foreign-born
- 11% · Canada, South Korea
- Languages at home
- 75% English-only · Spanish 20% Tagalog/Filipino 1% Other Asian/Pacific 1%
Political lean MEDSL · San Bernardino
- 2024 margin
- Toss-up / Even · D 47.5% · R 49.7% · Other 2.8%
- 2008→2024 swing
- -8.5pp toward R · 2008: 6.3pp · 2024: -2.1pp
- All cycles
- 2024: R+2.1 2020: D+10.7 2016: D+9.8 2012: D+5.4 2008: D+6.3
Not yet ingested
- Civics
- —
Market trends
- HPI YoY
- ▼ -145.60%
- Current HPI
- 359.2305
- Rent YoY
- ▲ 4.30%
- Metro
- Riverside-San Bernardino-Ontario, CA
- State GDP YoY
- ▲ 3.21%
- F500 in state
- 116
Industry mix (Fortune 500 HQ in CA)
| Industry | F500 HQs | Revenue |
|---|---|---|
| Technology | 27 | $1,492B |
|
||
| Financial Services | 3 | $174B |
|
||
| Retail | 3 | $44B |
|
||
| Insurance | 3 | $26B |
|
||
| Media / Entertainment | 2 | $115B |
|
||
| Pharmaceuticals / Biotech | 2 | $62B |
|
||
Price history
+575.0% since first listed44 events — show timeline
- 2026-06-14 Listing Removed — CRMLS
- 2026-05-04 Listed $675,000 CRMLS
- 2026-05-04 Listing Removed — CRMLS
- 2025-12-14 Listed $675,000 CRMLS
- 2025-10-14 Listing Removed — CRMLS
- 2025-08-05 Listed $675,000 CRMLS
- 2021-12-16 Sold (MLS) $400,000 CRMLS
- 2021-12-15 Sold (Public Records) $400,000 Public Records
- 2021-10-22 Pending — CRMLS
- 2021-09-08 Listed $420,000 CRMLS
- 2019-12-20 Sold (MLS) $330,000 CRMLS
- 2019-12-19 Sold (Public Records) $330,000 Public Records
- 2019-09-26 Contingent — CRMLS
- 2019-08-14 Price Changed $329,000 CRMLS
- 2019-08-08 Price Changed $339,500 CRMLS
- 2019-07-08 Listed $349,900 CRMLS
- 2017-06-22 Listing Removed — SDMLS
- 2017-06-22 Listing Removed — CRMLS
- 2017-01-15 Listed $275,000 CRMLS
- 2017-01-13 Listed $275,000 SDMLS
- 2017-01-06 Listing Removed — CRMLS
- 2017-01-06 Listing Removed — SDMLS
- 2016-12-23 Price Changed $275,000 CRMLS
- 2016-08-13 Relisted — CRMLS
- 2016-08-13 Price Changed $259,000 CRMLS
- 2016-08-01 Listing Removed — CRMLS
- 2016-05-19 Price Changed $255,000 CRMLS
- 2016-04-19 Price Changed $265,000 CRMLS
- 2016-01-08 Listed $275,000 CRMLS
- 2016-01-08 Listed $275,000 SDMLS
- 2014-09-30 Sold (Public Records) $185,000 Public Records
- 2014-09-30 Sold (MLS) $185,000 CRMLS
- 2014-09-30 Sold (MLS) $185,000 SDMLS
- 2014-09-30 Sold (MLS) $185,000 CRMLS
- 2014-09-17 Pending — CRMLS
- 2014-08-17 Pending — CRMLS
- 2014-07-29 Price Changed $184,000 CRMLS
- 2014-07-07 Price Changed $185,000 CRMLS
- 2014-06-16 Relisted — CRMLS
- 2014-06-05 Pending — CRMLS
- 2014-05-15 Listed $189,900 CRMLS
- 2014-05-15 Listed $185,000 CRMLS
- 2014-05-15 Listed $185,000 SDMLS
- 2011-09-19 Sold (MLS) $100,000 CRMLS
Property tax history
+8.7%/yrLatest (2025): $5,377 · +2.8% YoY. Source: county tax records.
Cash-flow waterfall
monthlySold comps — $/sqft
last 12 mo · ≤1 miLoading sold comps…