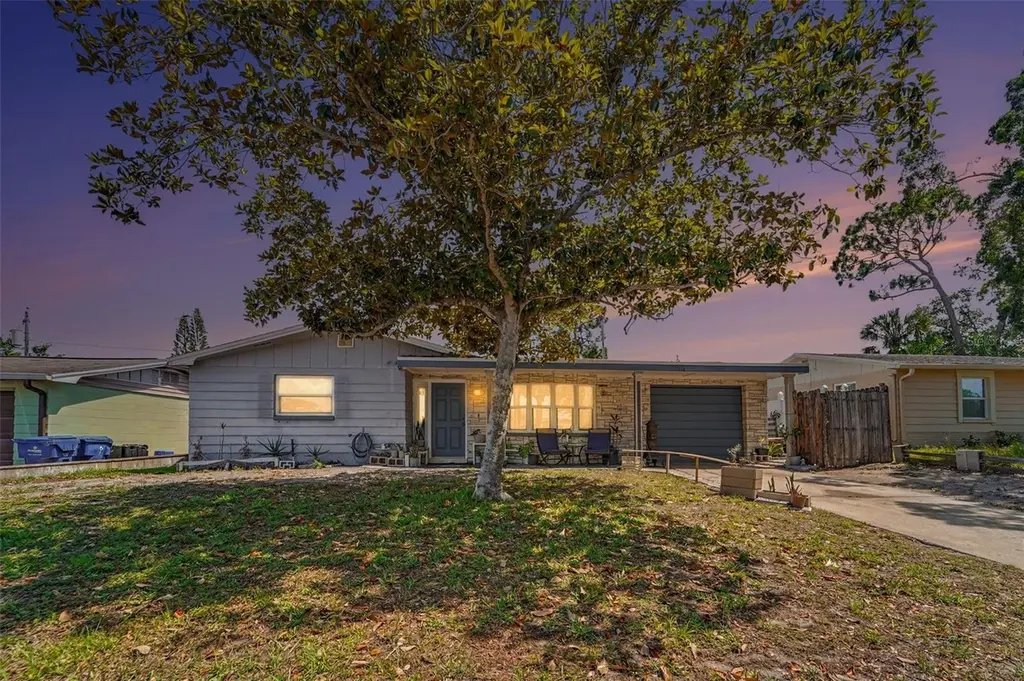
4130 Oakfield Ave · Beacon Square, FL
Flood risk 1/10 · Minimal
- FEMA flood zone
- X (unshaded)
- Chance of flooding over 30 yrs
- 0.0%
- Est. flood insurance / yr
- $507 – $1,088
Fire risk 2/10 · Minimal
- Est. fire insurance / yr
- $947 – $1,759
Heat risk 10/10 · Severe
- Hot days now (above 109°F)
- 7 days/yr
- Hot days in 30 yrs
- 28 days/yr
Wind risk 10/10 · Severe
- Chance of severe wind over 30 yrs
- 99.0%
Air-quality risk 2/10 · Minimal
- Unhealthy air days now
- 1 days/yr
- Unhealthy air days in 30 yrs
- 1 days/yr
Risk factors via First Street. Map © Google.
Why this score? — see what drove the C- grade
The composite is a weighted blend of 9 inputs, each scored 0–100. Each bar is that input's sub-score; the figure is the points it added to the 100-point composite (weight × sub-score).
- ARV discount +15.0/15.0
- Cash flow +14.4/30.0
- DSCR +4.4/10.0
- 1% rule +4.3/10.0
- Schools +4.3/10.0
- Livability +3.3/5.0
- Rent growth +3.0/5.0
- Condition / age +2.5/5.0
- Appreciation +0.0/10.0
$174,900
🖨 Deal sheet (PDF) 📄 Offer letter ✓ Due diligence
Listing remarks
Under contract-accepting backup offers. Priced to allow for your own personal touches, this 3-bedroom, 1.5-bath block home in Beacon Square is a solid opportunity in one of Pasco County's most affordable Gulf Coast communities. At just over 1,000 square feet, the layout is straightforward and functional, and the 1-car garage gives you more flexibility than most homes at this price point. Holiday is the kind of place where you're close to everything without paying for the name on the zip code. Anclote River Park and Key Vista Nature Park are just down the road, Tarpon Springs' Sponge Docks are minutes away, and Clearwater Beach is within 30 minutes. Boaters and anglers have been quietly lovi
Key facts
- Anclote key
- Anclote river park
- Clearwater beach
Tags
Property features AI
Finance
- Other: Zoning: R4
- Financial info: Lease restrictions: none indicated
- HOA & community: No association (no HOA); Pets allowed
Exterior
- Parking: Attached garage (1 car)
- Utilities: Public water; Public sewer; Electricity available; Cable available; Phone available; Broadband/High-speed internet available
- Home design: Single-family residence; One story; Faces north
- Construction: Block, concrete and stucco construction; Shingle roof; Slab foundation; Built on or before public-recorded building area of 1664 sq ft
- Exterior features: Exterior lighting; Sidewalk
Interior
- Kitchen: Dishwasher; Range; Microwave; Refrigerator
- Bedrooms: 3 bedrooms
- Flooring: Carpet; Laminate; Linoleum
- Bathrooms: 1 full bath; 1 half bath
- Heating & cooling: Central heating; Central air conditioning
- Interior features: Ceiling fans
- Laundry & utility: Washer; Dryer; Laundry area in garage
Neighborhood map
What this means for you Summary
Snapshot
- This is a 2-bed/2.0-bath single-family listed at $175k.
Deal economics
- At list price, monthly cash flow is $36 ($437/yr) — positive.
- The deal already cash-flows at list — no discount required.
- To meet the 1% rule (rent ≥ 1% of price), the offer needs to be $162k (7.4% below list).
- Recommended offer: $162k (7.4% below list) — sets the bar for 1% rule.
- Cap rate 6.5% vs local median 2.7% in Beacon Square — top-decile yield for the area; either an underpriced asset or a hidden risk that comps aren't pricing in. Stress-test before assuming the spread holds.
Location & tenants
- Location reads 66/100 on livability (#600 in FL) — a middle-class / working-renter tenant base. Strengths: cost of living A+, housing A+, health & safety B; Watch: employment D, amenities F, commute F.
- Pasco (suburban): math 50% / reading 52% proficiency, ranked #32 of 73 in FL (top 44%) — acceptable for families but not a draw, mixed tenant base, ~2y average lease.
- Zoned schools: Mittye P. Locke Elementary School (math 35% / reading 39%, grade F, #1,609 of 2,144 statewide, top 77%, 491 students, 89% FRL); Paul R. Smith Middle School (math 32% / reading 38%, grade F, #416 of 571 statewide, top 74%, 994 students, 82% FRL); Anclote High School (math 28% / reading 38%, grade F, #406 of 667 statewide, top 61%, 1,205 students, 77% FRL) — zoned schools average 83% FRL vs 48% district-wide (34 pts higher); higher-poverty schools than district average — tighter screening recommended.
- Zoned-school proficiency averages 35% at this address vs 51% district-wide (-16 pts) — the specific schools serving this property underperform the Pasco average; the district grade overstates school quality for this exact location.
- Market conditions: Rents rising (+2.0%/yr); 329 active listings in the ZIP; 40 comparable units currently listed for rent nearby; rentals at typical pace (median 17d on market — plan ~3-4 weeks tenant-placement turnaround); 6,765 units permitted in Pasco County in 2024 (1,250 in 5+ unit buildings).
- This rent runs 39% of the median local income ($50k/yr) — at the standard rent-burdened threshold; future hikes will face affordability resistance.
Forward outlook
- Local home prices are declining (-3.0%/yr); year-one equity from $1k of loan paydown is wiped out by about $5k of value loss. Plan a longer hold.
- Pasco County population projected at +29% by 2050 — long-run rental-demand tailwind backs the buy-and-hold thesis.
Negotiation context
- It's been on market 24 days — a 2% lower offer ($172k) is reasonable based on typical stale-listing flexibility.
- Current owner paid $42k; list at $175k implies a 316% gain — meaningful room to come down on a strong offer.
Risks & watch-outs
- Climate carrying-cost: severe wind risk, 99% chance of damaging wind over 30y; extreme-heat days projected 7→28/yr by 2055 (HVAC capex compounding) — expect insurance premiums to compound above CPI over the hold.
Questions for the listing agent
- Built in 1966 — when were the roof, HVAC, electrical panel, plumbing, and water heater last replaced?
- Is there a deadline driving the sale (1031 exchange, divorce, estate, relocation)? That informs how much negotiation room exists.
- Schools are F-rated, which usually means shorter tenancies and higher turnover. Who's the typical renter profile here, and what's been the actual vacancy rate?
- What's the average days-on-market for RENTAL listings here right now (not sales)? A rising rental-DOM trend means longer vacancies and softer asking-rent achievability than the comps imply.
- What's the recent tenant-quality profile in this submarket — average credit score on applications, eviction rate, late-payment / NSF rate, and stable-employment percentage? A property-management company in the area should have these aggregated.
- How much new for-sale + rental construction is in the pipeline within 1–3 miles? Heavy new supply typically softens prices + rents 12–24 months out; constrained supply supports both.
Investment metrics
- 1% rule
- 0.93% ✗
- Cap rate
- 6.54%
- Cash-on-cash
- 0.89%
- DSCR
- 1.04
- GRM
- 9.0
CMA / ARV
- ARV (on-the-fly)
- $238,680
- Comps found
- 12
Show comp detail 12 sales within ~0.75 mi
| Address | Dist | Beds/Ba | Sqft | Sold | Price | $/sf | Match |
|---|---|---|---|---|---|---|---|
| 4244 Woodfield Ave | 0.16mi | 2/1.5 | 1,006 (-7%) | 0mo | $210,000 | $209 | 79 |
| 4214 Ridgefield Ave | 0.09mi | 3/2.0 (+1) | 1,196 (+11%) | 1mo | $240,000 | $201 | 72 |
| 3542 Bedford St | 0.63mi | 2/2.0 | 1,056 (-2%) | 2mo | $155,000 | $147 | 66 |
| 3410 Pinehurst Dr | 0.29mi | 3/1.0 (+1) | 1,004 (-7%) | 1mo | $235,000 | $234 | 65 |
| 4011 Grayton Dr | 0.36mi | 2/2.0 | 1,200 (+11%) | 0mo | $140,000 | $117 | 65 |
| 3520 Overland Dr | 0.71mi | 2/2.0 | 1,068 (-1%) | 2mo | $257,000 | $241 | 64 |
| 4326 Westwood Dr | 0.41mi | 3/1.0 (+1) | 1,023 (-5%) | 1mo | $210,000 | $205 | 63 |
| 3643 Bedford St | 0.62mi | 3/2.0 (+1) | 1,024 (-5%) | 1mo | $245,000 | $239 | 57 |
| 3607 Connon Dr | 0.44mi | 2/1.5 | 956 (-12%) | 2mo | $215,000 | $225 | 57 |
| 3613 Bedford St | 0.61mi | 2/1.0 | 984 (-9%) | 0mo | $242,000 | $246 | 52 |
| 3608 Edenwood Dr | 0.58mi | 2/2.0 | 1,200 (+11%) | 2mo | $170,000 | $142 | 52 |
| 4711 Beacon Hill Dr | 0.64mi | 3/2.0 (+1) | 1,224 (+13%) | 1mo | $270,000 | $221 | 42 |
Match score weights: distance 35% · size 25% · config 20% · recency 20%. Top-matched comps best support the ARV.
Projected returns pro-forma
-3.0% appreciation · 2.05% rent growth · sell at horizon
- IRR
- -15.9%
- Equity multiple
- 0.44×
- Total profit
- $-27,511
- Equity at exit
- $26,078
- IRR
- -9.3%
- Equity multiple
- 0.45×
- Total profit
- $-26,959
- Equity at exit
- $15,122
Cash invested: $48,972 (down + closing). Projections, not guarantees.
Landlord ↔ Tenant lean methodology
- Overall (STATE)
- 87 Strongly Landlord-Friendly
- State Florida
- 87 Strongly Landlord-Friendly · R+3
- County
- — inherits STATE
- City
- — inherits STATE
ZIP-level market 34691
- Home prices YoY
- -23.9%
- Rents YoY
- 2.0%
- Active inventory
- 329
- Price-to-rent
- 9.0×
Monthly cashflow live
- Estimated rent
- $1,620 high interval (Pro) →
- Mortgage (P&I)
- −$917
- Tax from tax record
- −$253 /mo · $3,041/yr
- Insurance
- −$73
- HOA
- −$0
- Vacancy / Maint / Mgmt
- −$340
- Net cashflow
- $36
Break-even live
Sensitivity live
| Price | -10% $135 | -5% $86 | +0% $36 | +5% $-13 | +10% $-63 |
|---|---|---|---|---|---|
| Rent | -10% $-92 | -5% $-28 | +0% $36 | +5% $100 | +10% $164 |
| Rate | -1.0pp $124 | -0.5pp $81 | base $36 | +0.5pp $-9 | +1.0pp $-55 |
UW: 25.0% down · 7.5% · 30yr · 1.5% tax · 5.0% vac · 8.0% maint · 8.0% mgmt
Financing live
Cash to close
- Down payment
- $43,725
- Closing costs
- $5,247
- Reserves months
- —
- Total cash needed
- —
Loan-product check · same deal, 3 products live
Conventional
25% down · 7.5% · 30yr
- Down + closing
- —
- Monthly P&I
- —
- Monthly cashflow
- —
- DSCR
- —
- Eligible?
- —
Personal DTI + credit; lowest rate.
DSCR
20% down · 8.5% · 30yr
- Down + closing
- —
- Monthly P&I
- —
- Monthly cashflow
- —
- DSCR
- —
- Eligible?
- —
No personal income docs; deal must DSCR.
Hard money
10% down · 12.0% · 12mo
- Down + closing
- —
- Monthly P&I
- —
- Monthly cashflow
- —
- DSCR
- —
- Eligible?
- —
Short-term bridge; refi at stabilization.
Rent comps 40 comps
| Address | Beds | Baths | Sqft | Rent | $/sqft | DOM | Units | Dist |
|---|---|---|---|---|---|---|---|---|
| 3439 Clydesdale Dr Holiday, FL | 2.0 | 1.0 | 968 | $1,395 | $1.44 | 6d | 1 | 0.12mi |
| 3301 Rosefield Dr Holiday, FL | 3.0 | 2.0 | 1340 | $2,100 | $1.57 | 19d | 1 | 0.30mi |
| 4133 Grayton Dr New Port Richey, FL | 2.0 | 1.5 | 1068 | $1,727 | $1.62 | 6d | 1 | 0.31mi |
| 3421 Tricon Ln #12 Holiday, FL | 2.0 | 1.0 | 870 | $1,095 | $1.26 | 1d | 1 | 0.33mi |
| 3516 Sheryl Hill Dr Holiday, FL | 2.0 | 2.0 | 848 | $1,595 | $1.88 | 26d | 1 | 0.36mi |
| 3847 Lighthouse Way New Port Richey, FL | 2.0 | 2.0 | 1144 | $1,595 | $1.39 | 23d | 1 | 0.39mi |
| 4301 Straits Ln New Port Richey, FL | 3.0 | 1.5 | 1284 | $1,790 | $1.39 | 26d | 1 | 0.39mi |
| 3445 Wiltshire Dr Holiday, FL | 2.0 | 1.5 | 992 | $1,450 | $1.46 | 23d | 1 | 0.52mi |
| 3612 Springfield Dr Holiday, FL | 2.0 | 1.5 | 1040 | $1,450 | $1.39 | 19d | 1 | 0.52mi |
| 4031 Davit Dr New Port Richey, FL | 2.0 | 2.0 | 1144 | $1,600 | $1.40 | 19d | 1 | 0.55mi |
| 4022 Davit Dr New Port Richey, FL | 2.0 | 2.0 | 1144 | $1,600 | $1.40 | 19d | 1 | 0.58mi |
| 4221 Touchton Pl New Port Richey, FL | 2.0 | 2.0 | 888 | $1,300 | $1.46 | 25d | 1 | 0.67mi |
| 3433 Monticello St Holiday, FL | 3.0 | 1.5 | 960 | $1,650 | $1.72 | 26d | 1 | 0.68mi |
| 3431 Overland Dr Holiday, FL | 3.0 | 2.0 | 1236 | $1,850 | $1.50 | 26d | 1 | 0.73mi |
| 4834 Salem Dr New Port Richey, FL | 2.0 | 1.0 | 864 | $1,400 | $1.62 | 0d | 1 | 0.75mi |
| 4122 Hampton Dr New Port Richey, FL | 2.0 | 2.0 | 1050 | $1,795 | $1.71 | 0d | 1 | 0.76mi |
| 4348 Plaza Dr Holiday, FL | 1.0–2.0 | 1.0–2.0 | 860 | $1,499 | $1.74 | 1d | 7 | 0.77mi |
| 3511 Cambridge St New Port Richey, FL | 2.0 | 2.0 | 936 | $2,100 | $2.24 | 6d | 1 | 0.79mi |
| 4205 Jordana Way Holiday, FL | 1.0–3.0 | 1.0–2.0 | 1027 | $1,404 | $1.37 | 4d | 13 | 0.82mi |
| 4411 Rustic Dr Unit 1 New Port Richey, FL | 2.0 | 2.0 | 1050 | $1,450 | $1.38 | 14d | 1 | 0.82mi |
| 4408 Rustic Dr New Port Richey, FL | 2.0 | 1.0 | 1101 | $1,500 | $1.36 | 26d | 1 | 0.82mi |
| 3528 Rock Royal Dr Holiday, FL | 2.0 | 1.0 | 1052 | $1,700 | $1.62 | 1d | 1 | 0.88mi |
| 4124 Flamingo Dr New Port Richey, FL | 3.0 | 1.0 | 744 | $1,500 | $2.02 | 5d | 1 | 0.92mi |
| 4124 Flamingo Dr New Port Richey, FL | 3.0 | 1.0 | 744 | $1,500 | $2.02 | 16d | 1 | 0.92mi |
| 3252 Peterborough St Holiday, FL | 3.0 | 2.0 | 1290 | $1,631 | $1.26 | 6d | 1 | 1.07mi |
| 5020 Vickers Dr New Port Richey, FL | 2.0 | 1.0 | 863 | $1,495 | $1.73 | 1d | 1 | 1.09mi |
| 4723 Aegean Ave Holiday, FL | 2.0 | 1.0 | 1000 | $1,636 | $1.64 | 6d | 1 | 1.09mi |
| 4620 Tropical Ln Holiday, FL | 2.0 | 1.0 | 1276 | $1,650 | $1.29 | 3d | 1 | 1.10mi |
| 4365 Tahitian Gardens Cir Unit C Holiday, FL | 2.0 | 1.0 | 825 | $1,300 | $1.58 | 1d | 1 | 1.13mi |
| 4351 Tahitian Gardens Cir Holiday, FL | 2.0 | 1.0 | 825 | $1,150 | $1.39 | 26d | 1 | 1.15mi |
| 3742 Darlington Rd Holiday, FL | 2.0 | 1.5 | 936 | $1,800 | $1.92 | 26d | 1 | 1.17mi |
| 2610 Templewood Dr Holiday, FL | 3.0 | 1.0 | 1056 | $1,800 | $1.70 | 6d | 1 | 1.17mi |
| 4356 Tahitian Gardens Cir Unit C Holiday, FL | 2.0 | 1.0 | 825 | $1,350 | $1.64 | 26d | 1 | 1.17mi |
| 5232 Sparrow Dr Holiday, FL | 2.0 | 1.0 | 976 | $1,975 | $2.02 | 26d | 1 | 1.18mi |
| 4282 Rudder Way New Port Richey, FL | 3.0 | 2.0 | 1310 | $2,000 | $1.53 | 5d | 1 | 1.18mi |
| 4282 Rudder Way New Port Richey, FL | 3.0 | 2.0 | 1454 | $2,000 | $1.38 | 26d | 1 | 1.18mi |
| 4354 Tahitian Gardens Cir Unit F Holiday, FL | 2.0 | 1.0 | 825 | $1,500 | $1.82 | 26d | 1 | 1.18mi |
| 4645 Irene Loop New Port Richey, FL | 3.0 | 1.0 | 1158 | $1,700 | $1.47 | 1d | 1 | 1.18mi |
| 4540 Irene Loop New Port Richey, FL | 2.0 | 1.0 | 768 | $1,550 | $2.02 | 26d | 1 | 1.19mi |
| 4117 Highland Loop New Port Richey, FL | 3.0 | 2.0 | 1384 | $1,599 | $1.16 | 14d | 1 | 1.20mi |
Listing history 17 events
-
2026-06-22statusdays on market $174,900 Pending 24 DOM
-
2026-06-18days on market $174,900 Active 22 DOM
-
2026-06-17days on market $174,900 Active 21 DOM
-
2026-06-16pricedays on market $174,900 Active 20 DOM
-
2026-06-15days on market $190,000 Active 19 DOM
-
2026-06-13days on market $190,000 Active 17 DOM
-
2026-06-09days on market $190,000 Active 13 DOM
-
2026-06-08days on market $190,000 Active 12 DOM
-
2026-06-07days on market $190,000 Active 11 DOM
-
2026-06-04days on market $190,000 Active 8 DOM
-
2026-06-03days on market $190,000 Active 7 DOM
-
2026-06-02days on market $190,000 Active 6 DOM
-
2026-06-01days on market $190,000 Active 5 DOM
-
2026-05-31days on market $190,000 Active 4 DOM
-
2026-05-27$190,000 Active
-
1994-02-01soldstatus $42,000
-
1975-04-01soldstatus $25,300
ⓘ Source: listings_history table (triggers on properties + properties_extension) + one-shot
backfill from property_details.listing_events for pre-trigger history.
Tax reassessment forecast FL · Resets to sale price
- Current annual tax
- $3,041 · $253/mo
- Projected year-2 tax
- $3,041 · $253/mo
- Expected delta
- $0/yr ($0/mo · 0.0%)
ⓘ Screening estimate from a state-policy table — verify with the county assessor before closing.
Climate risk First Street
- Flood 1/10 Low FEMA zone X (unshaded) · 0% chance over 30 yrs
- Wildfire 2/10 Low
- Heat 10/10 Extreme 7 d/yr ≥109°F today · 28 d/yr by 30 yrs out
- Wind 10/10 Extreme 99% chance of damaging wind over 30 yrs
- Air quality 2/10 Low 1 unhealthy d/yr today · 1 by 30 yrs out
Nearby sold comps map
Loading sold comps map…
Walkable amenities ~0.75 mi
Loading nearby amenities…
Taxation est. · year 1
- Rental income
- $19,441
- − Mortgage interest
- −$9,797
- − Property taxes
- −$3,041
- − Insurance
- −$874
- − Repairs & maintenance
- −$1,555
- − Management
- −$1,555
- − Depreciation
- −$5,088
- Taxable loss
- −$2,470
- Est. tax savings @ 24.0%
- +$593
- After-tax cash flow
- $1,030/yr
For passive investors: Depreciation is non-cash, so a rental often shows a tax loss while cash-flowing — sheltering income. Rental losses are passive: they offset passive income freely, and up to $25,000/yr can offset ordinary (W-2) income if you actively participate and your MAGI is under $100k (phasing out to $0 by $150k); unused losses carry forward. On sale, claimed depreciation is recaptured at up to 25%, and gains may owe capital-gains tax (a 1031 exchange can defer both). Figures are a year-1 estimate at your 24.0% rate — not tax advice; consult a CPA.
Schools (NCES district)
- District
- Pasco
- NCES district ID
- 1201530
- Math proficiency
- 50% ▼ -10.00%
- Reading proficiency
- 52% ▼ -5.00%
- Median HH income
- $45,039
- Composite
- 43.14/100
- National rank
- #3074
- State rank
- #32 of 73 in FL
Livability — Beacon Square
- Score
- 66/100
- State rank
- #600
- US rank
- #11494
Category grades
Schools grade is shown separately in the Schools card above.
Census & demographics
- Census place
- Beacon Square, FL
- County
- Pasco County · 524,098 people
- Metro
- Tampa-St. Petersburg-Clearwater, FL
- Population (ZIP)
- 21,232
- Household income
- $50,288
- Rent vs Own
- Severe rent burden
- 1031.0
Population outlook (Pasco County) Hauer SSP2
- Today (2025)
- 570,045 people
- By 2030
- 605,844 · +6.3%
- By 2040
- 674,806 · +18.4%
- By 2050
- 736,022 · +29.1%
- By 2075
- 862,900 · +51.4%
- By 2100
- 906,364 · +59.0%
Race, ethnicity, and origin ACS 2023
- Neighborhood character
- Predominantly White (73%)
- Race & ethnicity
- White 73% Hispanic / Latino 15% Two or more races 11% Black 7% Asian 2%
- Hispanic origin (detail)
- Mexican 2% Puerto Rican 6% Cuban 2% Dominican 2%
- Common ancestry
- Romanian 3% Iranian 2% Lithuanian 2%
- Foreign-born
- 10% · Canada, Vietnam
- Languages at home
- 82% English-only · Spanish 8% Other Indo-European 5% Other Asian/Pacific 1%
Political lean MEDSL · Pasco
- 2024 margin
- Strong R (+25.2) · D 36.9% · R 62.1% · Other 1.0%
- 2008→2024 swing
- -21.6pp toward R · 2008: -3.6pp · 2024: -25.2pp
- All cycles
- 2024: R+25.2 2020: R+20.1 2016: R+21.6 2012: R+6.7 2008: R+3.6
Not yet ingested
- Civics
- —
Market trends
- HPI YoY
- ▼ -102.84%
- Current HPI
- 326.9843
- Rent YoY
- ▲ 2.05%
- Metro
- Tampa-St. Petersburg-Clearwater, FL
- State GDP YoY
- ▲ 3.28%
- F500 in state
- 36
Industry mix (Fortune 500 HQ in FL)
| Industry | F500 HQs | Revenue |
|---|---|---|
| Industrial Technology | 2 | $29B |
|
||
| Insurance | 2 | $17B |
|
||
| Retail | 1 | $60B |
|
||
| Technology Distribution | 1 | $58B |
|
||
| Homebuilding | 1 | $35B |
|
||
| Technology Manufacturing | 1 | $35B |
|
||
Price history
+651.0% since first listed3 events — show timeline
- 2026-05-27 Listed $190,000 Stellar MLS as Distributed by MLS Grid
- 1994-02-01 Sold (Public Records) $42,000 Public Records
- 1975-04-01 Sold (Public Records) $25,300 Public Records
Property tax history
+18.1%/yrLatest (2025): $3,041 · -3.9% YoY. Source: county tax records.
Cash-flow waterfall
monthlySold comps — $/sqft
last 12 mo · ≤1 miLoading sold comps…