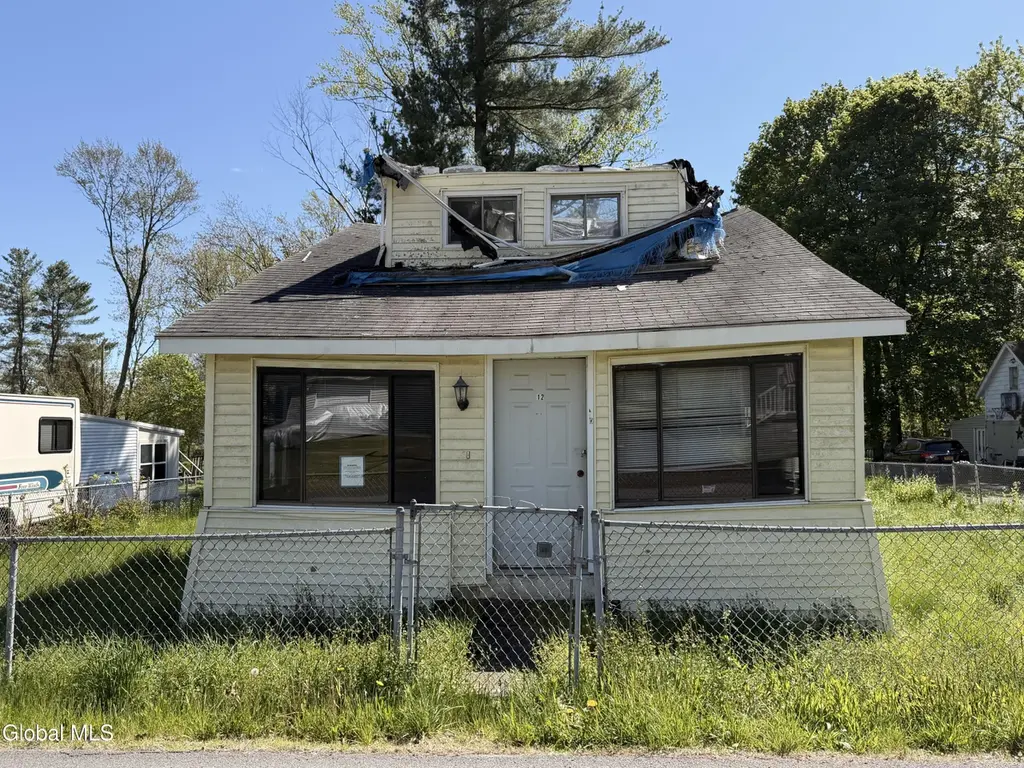
120 Morey Park Rd · Nassau Lake, NY
Flood risk 3/10 · Minor
- FEMA flood zone
- X
- Chance of flooding over 30 yrs
- 0.2%
- Est. flood insurance / yr
- $507 – $1,088
Fire risk 5/10 · Moderate
- Est. fire insurance / yr
- $691 – $1,283
Heat risk 3/10 · Minor
- Hot days now (above 95°F)
- 7 days/yr
- Hot days in 30 yrs
- 17 days/yr
Wind risk 3/10 · Minor
- Chance of severe wind over 30 yrs
- 7.0%
Air-quality risk 2/10 · Minimal
- Unhealthy air days now
- 1 days/yr
- Unhealthy air days in 30 yrs
- 1 days/yr
Risk factors via First Street. Map © Google.
Why this score? — see what drove the A- grade
The composite is a weighted blend of 9 inputs, each scored 0–100. Each bar is that input's sub-score; the figure is the points it added to the 100-point composite (weight × sub-score).
- Cash flow +30.0/30.0
- 1% rule +10.0/10.0
- DSCR +10.0/10.0
- Appreciation +10.0/10.0
- ARV discount +7.5/15.0
- Schools +6.1/10.0
- Rent growth +2.5/5.0
- Livability +2.5/5.0
- Condition / age +2.5/5.0
$59,000
🖨 Deal sheet 📄 Offer letter ✓ Due diligence
Listing remarks MLS
Calling all investors, builders, and visionaries! This rare opportunity near Nassau Lake offers endless potential in one of Rensselaer County's most scenic and sought-after locations. Whether you're looking to build, renovate, develop, or create the ultimate Upstate retreat, this property delivers location, possibility, and value. Conveniently located near Albany, major highways, outdoor recreation, and local amenities, the setting combines peaceful lake-area living with easy accessibility. Bring your imagination and unlock the potential of this unique investment opportunity in the heart of Nassau lake.
Key facts
- Outdoor recreation
- Scenic location
- Nassau lake
Tags
Property features AI
Exterior
- Parking: Two parking spaces
- Utilities: Septic tank sewer
- Home design: Single-family residence; One-story (all main rooms listed on the first floor)
- Construction: Aluminum siding construction
- Exterior features: Paved driveway; Aluminum siding
Interior
- Kitchen: Kitchen on the first floor
- Bedrooms: Two bedrooms on the first floor
- Bathrooms: One full bathroom on the first floor
- Heating & cooling: Hot water heating
- Interior features: Crawl space foundation; Six total rooms; Two dining areas
Neighborhood map
What this means for you Summary
Snapshot
- This is a 2-bed/1.0-bath single-family listed at $59k.
Deal economics
- At list price, monthly cash flow is $718 ($9k/yr) — positive.
- The deal already cash-flows at list — no discount required.
- Meets the 1% rule at list price ($1k rent vs $59k).
- Recommended offer: $58k (1.5% below list) — sets the bar for market timing.
Location & tenants
- Location reads: area grade A — affects rentability + tenant quality, not the cash-flow math above.
- East Greenbush Central School District (suburban): math 68% / reading 71% proficiency, ranked #132 of 590 in NY (top 22%) — acceptable for families but not a draw, mixed tenant base, ~2y average lease; only 15% free/reduced lunch — higher-income household profile.
- Zoned schools: Columbia High School (math 97% / reading 87%, grade A+, #171 of 1,100 statewide, top 18%, 1,252 students, 27% FRL).
- Zoned-school proficiency averages 92% at this address vs 70% district-wide (+22 pts) — the actual schools serving this property are materially stronger than the East Greenbush Central School District average implies; a family-tenant draw the district grade alone would hide.
- Market conditions: 25 active listings in the ZIP; 405 units permitted in Rensselaer County in 2024 (224 in 5+ unit buildings).
Forward outlook
- In year one you build about $6k of equity ($408 loan paydown + $6k appreciation (10.0% local appreciation)).
- Rensselaer County population projected to shrink 6% by 2050 — rents likely to lag national; underwrite the cash flow, not the appreciation.
- At projected returns (10.0% appreciation + 3.0% rent growth), your $17k cash investment doubles in ~2 years — after that, you're playing with house money.
- By year 6, paydown + projected appreciation supports a ~$37k cash-out refi (75% LTV) — recoverable capital for the next deal without selling this one.
Negotiation context
- It's been on market 27 days — a 2% lower offer ($58k) is reasonable based on typical stale-listing flexibility.
- 2 sale attempts with the ask held roughly flat each time — persistent listings suggest the price (not the market) is what's stuck; bring a comps-based counter.
Risks & watch-outs
- Climate carrying-cost: moderate wildfire risk — expect insurance premiums to compound above CPI over the hold.
Questions for the listing agent
- Built in 1979 — when were the roof, HVAC, electrical panel, plumbing, and water heater last replaced?
- Is there a deadline driving the sale (1031 exchange, divorce, estate, relocation)? That informs how much negotiation room exists.
- What's the average days-on-market for RENTAL listings here right now (not sales)? A rising rental-DOM trend means longer vacancies and softer asking-rent achievability than the comps imply.
- What's the recent tenant-quality profile in this submarket — average credit score on applications, eviction rate, late-payment / NSF rate, and stable-employment percentage? A property-management company in the area should have these aggregated.
- How much new for-sale + rental construction is in the pipeline within 1–3 miles? Heavy new supply typically softens prices + rents 12–24 months out; constrained supply supports both.
Investment metrics
- 1% rule
- 2.44% ✓
- Cap rate
- 20.90%
- Cash-on-cash
- 52.15%
- DSCR
- 3.32
- GRM
- 3.4
CMA / ARV
- ARV (on-the-fly)
- $230,050
- Comps found
- 3
Show comp detail 3 sales within ~0.75 mi
| Address | Dist | Beds/Ba | Sqft | Sold | Price | $/sf | Match |
|---|---|---|---|---|---|---|---|
| 25 Boyce Rd | 0.18mi | 3/1.0 (+1) | 1,104 (+3%) | 20mo | $237,000 | $215 | 65 |
| 257 County Route 7 | 0.51mi | 3/1.0 (+1) | 1,050 (-2%) | 19mo | $207,000 | $197 | 52 |
| 68 Lake Shore Circle Dr | 0.47mi | 2/2.0 | 1,211 (+13%) | 1mo | $308,000 | $254 | 52 |
Match score weights: distance 35% · size 25% · config 20% · recency 20%. Top-matched comps best support the ARV.
Projected returns pro-forma
10.0% appreciation · 3.0% rent growth · sell at horizon
- IRR
- 65.4%
- Equity multiple
- 5.71×
- Total profit
- $77,887
- Equity at exit
- $53,152
- IRR
- 59.0%
- Equity multiple
- 12.71×
- Total profit
- $193,459
- Equity at exit
- $114,624
Cash invested: $16,520 (down + closing). Projections, not guarantees.
Landlord ↔ Tenant lean methodology
- Overall (STATE)
- 15 Strongly Tenant-Friendly
- State New York
- 15 Strongly Tenant-Friendly · D+10
- County
- — inherits STATE
- City
- — inherits STATE
ZIP-level market 12123
- Home prices YoY
- 8.8%
- Active inventory
- 25
- Price-to-rent
- 3.4×
Monthly cashflow live
- Estimated rent
- $1,437 medium interval (Pro) →
- Mortgage (P&I)
- −$309
- Tax from tax record
- −$83 /mo · $1,000/yr
- Insurance
- −$25
- HOA
- −$0
- Vacancy / Maint / Mgmt
- −$302
- Net cashflow
- $718
Break-even live
UW: 25.0% down · 7.5% · 30yr · 1.5% tax · 5.0% vac · 8.0% maint · 8.0% mgmt
Financing live
Cash to close
- Down payment
- $14,750
- Closing costs
- $1,770
- Reserves months
- —
- Total cash needed
- —
Loan-product check · same deal, 3 products live
Conventional
25% down · 7.5% · 30yr
- Down + closing
- —
- Monthly P&I
- —
- Monthly cashflow
- —
- DSCR
- —
- Eligible?
- —
Personal DTI + credit; lowest rate.
DSCR
20% down · 8.5% · 30yr
- Down + closing
- —
- Monthly P&I
- —
- Monthly cashflow
- —
- DSCR
- —
- Eligible?
- —
No personal income docs; deal must DSCR.
Hard money
10% down · 12.0% · 12mo
- Down + closing
- —
- Monthly P&I
- —
- Monthly cashflow
- —
- DSCR
- —
- Eligible?
- —
Short-term bridge; refi at stabilization.
Listing history 17 events
-
2026-06-18days on market $59,000 Active 27 DOM
-
2026-06-17days on market $59,000 Active 26 DOM
-
2026-06-16days on market $59,000 Active 25 DOM
-
2026-06-15days on market $59,000 Active 24 DOM
-
2026-06-14days on market $59,000 Active 22 DOM
-
2026-06-10days on market $59,000 Active 19 DOM
-
2026-06-09days on market $59,000 Active 18 DOM
-
2026-06-08days on market $59,000 Active 17 DOM
-
2026-06-07days on market $59,000 Active 16 DOM
-
2026-06-05days on market $59,000 Active 13 DOM
-
2026-06-03days on market $59,000 Active 12 DOM
-
2026-06-02days on market $59,000 Active 11 DOM
-
2026-06-01days on market $59,000 Active 10 DOM
-
2026-05-31days on market $59,000 Active 9 DOM
-
2026-05-31days on market $59,000 Active 8 DOM
-
2026-05-22$59,000 Active
Show marketing remark (610 chars)
Calling all investors, builders, and visionaries! This rare opportunity near Nassau Lake offers endless potential in one of Rensselaer County's most scenic and sought-after locations. Whether you're looking to build, renovate, develop, or create the ultimate Upstate retreat, this property delivers location, possibility, and value. Conveniently located near Albany, major highways, outdoor recreation, and local amenities, the setting combines peaceful lake-area living with easy accessibility. Bring your imagination and unlock the potential of this unique investment opportunity in the heart of Nassau lake.
-
2026-05-22$59,000 Active 610-char remark
Show marketing remark (610 chars)
Calling all investors, builders, and visionaries! This rare opportunity near Nassau Lake offers endless potential in one of Rensselaer County's most scenic and sought-after locations. Whether you're looking to build, renovate, develop, or create the ultimate Upstate retreat, this property delivers location, possibility, and value. Conveniently located near Albany, major highways, outdoor recreation, and local amenities, the setting combines peaceful lake-area living with easy accessibility. Bring your imagination and unlock the potential of this unique investment opportunity in the heart of Nassau lake.
ⓘ Source: listings_history table (triggers on properties + properties_extension) + one-shot
backfill from property_details.listing_events for pre-trigger history.
Tax reassessment forecast NY · Partial reset (capped growth)
- Current annual tax
- $1,000 · $83/mo
- Projected year-2 tax
- $1,000 · $83/mo
- Expected delta
- $0/yr ($0/mo · 0.0%)
ⓘ Screening estimate from a state-policy table — verify with the county assessor before closing.
Climate risk First Street
- Flood 3/10 Moderate FEMA zone X · 20% chance over 30 yrs
- Wildfire 5/10 Major
- Heat 3/10 Moderate 7 d/yr ≥95°F today · 17 d/yr by 30 yrs out
- Wind 3/10 Moderate 7% chance of damaging wind over 30 yrs
- Air quality 2/10 Low 1 unhealthy d/yr today · 1 by 30 yrs out
Nearby sold comps map
Loading sold comps map…
Walkable amenities ~0.75 mi
Loading nearby amenities…
Taxation est. · year 1
- Rental income
- $17,245
- − Mortgage interest
- −$3,305
- − Property taxes
- −$1,000
- − Insurance
- −$295
- − Repairs & maintenance
- −$1,380
- − Management
- −$1,380
- − Depreciation
- −$1,716
- Taxable income
- $8,169
- Est. tax owed @ 24.0%
- −$1,961
- After-tax cash flow
- $6,655/yr
For passive investors: Depreciation is non-cash, so a rental often shows a tax loss while cash-flowing — sheltering income. Rental losses are passive: they offset passive income freely, and up to $25,000/yr can offset ordinary (W-2) income if you actively participate and your MAGI is under $100k (phasing out to $0 by $150k); unused losses carry forward. On sale, claimed depreciation is recaptured at up to 25%, and gains may owe capital-gains tax (a 1031 exchange can defer both). Figures are a year-1 estimate at your 24.0% rate — not tax advice; consult a CPA.
Schools (NCES district)
- District
- East Greenbush Central School District
- NCES district ID
- 3609630
- Math proficiency
- 68% ▼ -5.00%
- Reading proficiency
- 71% ▲ 2.00%
- Median HH income
- $73,174
- Composite
- 61.16/100
- National rank
- #783
- State rank
- #132 of 590 in NY
Livability — Nassau Lake
No livability data for this city. (Only ~50 U.S. cities are tracked.)
Census & demographics
- Census place
- Nassau Lake, NY
- Population (ZIP)
- 4,853
Population outlook (Rensselaer County) Hauer SSP2
- Today (2025)
- 162,400 people
- By 2030
- 161,746 · -0.4%
- By 2040
- 158,095 · -2.7%
- By 2050
- 152,966 · -5.8%
- By 2075
- 140,767 · -13.3%
- By 2100
- 124,727 · -23.2%
Race, ethnicity, and origin ACS 2023
- Neighborhood character
- Predominantly White (89%)
- Race & ethnicity
- White 89% Two or more races 5% Hispanic / Latino 4%
- Common ancestry
- Romanian 7% Lithuanian 7% Iranian 5%
- Foreign-born
- 0%
- Languages at home
- 99% English-only · Spanish 1%
Political lean MEDSL · Rensselaer
- 2024 margin
- Toss-up / Even · D 50.7% · R 49.3%
- 2008→2024 swing
- -8.0pp toward R · 2008: 9.3pp · 2024: 1.4pp
- All cycles
- 2024: D+1.4 2020: D+5.6 2016: R+2.9 2012: D+11.8 2008: D+9.3
Not yet ingested
- Civics
- —
Market trends
- HPI YoY
- ▲ 23.93%
- Current HPI
- 296.9494
- Rent YoY
- —
- Metro
- —
- State GDP YoY
- ▲ 2.60%
- F500 in state
- 92
Industry mix (Fortune 500 HQ in NY)
| Industry | F500 HQs | Revenue |
|---|---|---|
| Financial Services | 10 | $950B |
|
||
| Consumer Goods | 9 | $162B |
|
||
| Insurance | 4 | $225B |
|
||
| Telecommunications | 2 | $144B |
|
||
| Pharmaceuticals | 2 | $112B |
|
||
| Media / Entertainment | 2 | $69B |
|
||
Price history
+0.0% since first listed2 events — show timeline
- 2026-05-22 Listed $59,000 HVCRMLS
- 2026-05-22 Listed $59,000 Global MLS
Property tax history
-8.0%/yrLatest (2025): $1,000 · +3.1% YoY. Source: county tax records.
Cash-flow waterfall
monthlySold comps — $/sqft
last 12 mo · ≤1 miLoading sold comps…