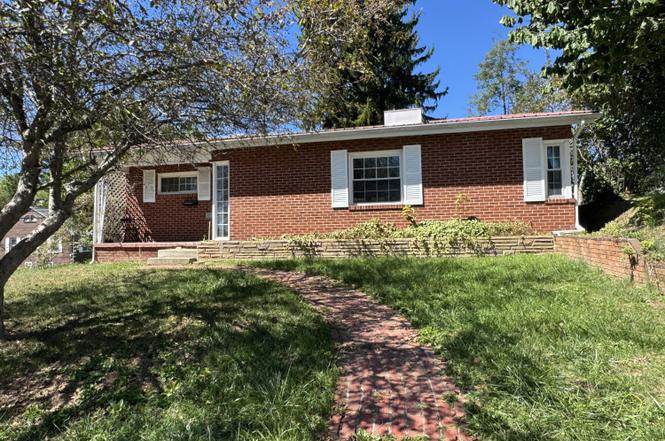
914 Reynolds Ave · Princeton, WV
Flood risk 1/10 · Minimal
- FEMA flood zone
- X (unshaded)
- Chance of flooding over 30 yrs
- 0.0%
- Est. flood insurance / yr
- $507 – $1,088
Fire risk 3/10 · Minor
- Est. fire insurance / yr
- $787 – $1,461
Heat risk 3/10 · Minor
- Hot days now (above 91°F)
- 7 days/yr
- Hot days in 30 yrs
- 22 days/yr
Wind risk 2/10 · Minimal
- Chance of severe wind over 30 yrs
- —
Air-quality risk 1/10 · Minimal
- Unhealthy air days now
- 0 days/yr
- Unhealthy air days in 30 yrs
- 0 days/yr
Risk factors via First Street. Map © Google.
Why this score? — see what drove the D grade
The composite is a weighted blend of 9 inputs, each scored 0–100. Each bar is that input's sub-score; the figure is the points it added to the 100-point composite (weight × sub-score).
- Appreciation +10.0/10.0
- Cash flow +8.0/30.0
- ARV discount +7.0/15.0
- Livability +3.6/5.0
- Schools +2.6/10.0
- Rent growth +2.5/5.0
- Condition / age +2.5/5.0
- DSCR +2.1/10.0
- 1% rule +1.9/10.0
$134,900
🖨 Deal sheet (PDF) 📄 Offer letter ✓ Due diligence
Listing remarks
Princeton, timeless brick ranch, elevated corner lot, 3 bedrooms 1 bath, laundry room. Updated kitchen, beautiful hardwood floors, metal roof.
Key facts
- Elevated corner lot
- Metal roof
- Updated kitchen
Tags
Property features AI
Finance
- Other: Lot approximately 0.1 acre
- Financial info: Details not provided
- HOA & community: Details not provided
Exterior
- Parking: Details not provided
- Security: Details not provided
- Utilities: Details not provided
- Home design: Residential property
- Construction: Brick construction; Block foundation; Built area approximately 1,296
- Exterior features: Metal roof
Interior
- Kitchen: Laminate countertops
- Bedrooms: Details not provided
- Flooring: Hardwood; Laminate
- Bathrooms: 1 full bathroom
- Heating & cooling: Forced air heating; No central cooling
- Interior features: Laminate countertops; Hardwood flooring; Laminate flooring; Seven total rooms
- Laundry & utility: Details not provided
Neighborhood map
What this means for you Summary
Snapshot
- This is a 2-bed/1.0-bath single-family listed at $135k.
Deal economics
- At list price, monthly cash flow is $-135 ($-2k/yr) — negative.
- To cash-flow at today's rent, offer at most $111k (17.7% below list).
- To meet the 1% rule (rent ≥ 1% of price), the offer needs to be $93k (30.9% below list).
- Recommended offer: $93k (30.9% below list) — sets the bar for 1% rule.
- Cap rate 5.1% vs local median 3.7% in Princeton — top-decile yield for the area; either an underpriced asset or a hidden risk that comps aren't pricing in. Stress-test before assuming the spread holds.
Location & tenants
- Location reads 72/100 on livability (#53 in WV) — a middle-class / working-renter tenant base. Strengths: cost of living A+, housing A+, crime B+; Watch: amenities D, commute F, employment F.
- Mercer County Schools (town): math 26% / reading 37% proficiency, ranked #28 of 55 in WV (top 51%) — families likely to look elsewhere, expect single-tenant / working-renter base with shorter leases.
- Zoned schools: Princeton Primary School (499 students, 0% FRL); Princeton Middle School (math 21% / reading 27%, grade F, #89 of 109 statewide, top 82%, 503 students, 0% FRL); Princeton Senior High School (math 32% / reading 52%, grade F, #14 of 110 statewide, top 16%, 983 students, 0% FRL) — zoned schools average 0% FRL vs 54% district-wide (54 pts lower); this property's tenant base skews higher-income than the district average.
- Market conditions: 48 active listings in the ZIP; lower-income renter base — watch delinquency; 4 units permitted in Mercer County in 2024 (0 in 5+ unit buildings).
Forward outlook
- In year one you build about $14k of equity ($933 loan paydown + $13k appreciation (10.0% local appreciation)).
- Mercer County population projected at -18% by 2050 — secular population decline; favor cash flow + early exit over multi-decade hold.
- By year 3, paydown + projected appreciation supports a ~$37k cash-out refi (75% LTV) — recoverable capital for the next deal without selling this one.
Negotiation context
- It's been on market 140 days — a 12% lower offer ($119k) is reasonable based on typical stale-listing flexibility.
- Current owner paid $18k; list at $135k implies a 649% gain — meaningful room to come down on a strong offer.
Risks & watch-outs
- Watch-outs: built in 1945 — expect roof / HVAC / electrical / plumbing capex.
Questions for the listing agent
- What do current leases actually rent for vs. the listed asking? Can we see a recent rent roll and the last 12 months of T-12 income?
- It's been on market 140 days. Have you received any prior offers? Is the seller open to a 31% concession, seller financing, or rate buy-down credit?
- Built in 1945 — when were the roof, HVAC, electrical panel, plumbing, and water heater last replaced?
- Why hasn't it sold? Are there any deal-killer items the seller is aware of (foundation, flood, title, zoning, code violations)?
- Is there a deadline driving the sale (1031 exchange, divorce, estate, relocation)? That informs how much negotiation room exists.
- Schools are B-rated — typically a magnet for longer-tenancy family renters. What's the average tenant stay here, and is there a school-zone premium baked into asking?
- The area grade is low — what's the realistic commute time and amenity access for the typical tenant pool here? Any planned neighborhood developments (good or bad) we should know about?
- What's the average days-on-market for RENTAL listings here right now (not sales)? A rising rental-DOM trend means longer vacancies and softer asking-rent achievability than the comps imply.
- What's the recent tenant-quality profile in this submarket — average credit score on applications, eviction rate, late-payment / NSF rate, and stable-employment percentage? A property-management company in the area should have these aggregated.
- How much new for-sale + rental construction is in the pipeline within 1–3 miles? Heavy new supply typically softens prices + rents 12–24 months out; constrained supply supports both.
Investment metrics
- 1% rule
- 0.69% ✗
- Cap rate
- 5.09%
- Cash-on-cash
- -4.29%
- DSCR
- 0.81
- GRM
- 12.1
CMA / ARV
- ARV (on-the-fly)
- $133,488
- Comps found
- 12
Show comp detail 12 sales within ~0.75 mi
| Address | Dist | Beds/Ba | Sqft | Sold | Price | $/sf | Match |
|---|---|---|---|---|---|---|---|
| 405 Park Ave | 0.07mi | 3/2.0 (+1) | 1,334 (+3%) | 19mo | $129,900 | $97 | 67 |
| 502 Brookman Ave | 0.31mi | 3/2.0 (+1) | 1,278 (-1%) | 17mo | $150,000 | $117 | 60 |
| 1104 Meador St | 0.44mi | 3/1.0 (+1) | 1,299 (+0%) | 20mo | $98,000 | $75 | 57 |
| 805 Harrison St | 0.37mi | 3/1.5 (+1) | 1,411 (+9%) | 14mo | $144,000 | $102 | 49 |
| 508 Harrison St | 0.43mi | 3/1.5 (+1) | 1,411 (+9%) | 14mo | $144,000 | $102 | 46 |
| 200 College Ave | 0.28mi | 3/2.0 (+1) | 1,432 (+10%) | 18mo | $163,000 | $114 | 45 |
| 400 Lower Pine St | 0.49mi | 3/1.0 (+1) | 1,200 (-7%) | 18mo | $125,000 | $104 | 44 |
| 1116 Princeton Ave | 0.58mi | 2/1.0 | 1,157 (-11%) | 20mo | $114,000 | $99 | 38 |
| 1411 South Ave | 0.70mi | 3/2.0 (+1) | 1,200 (-7%) | 14mo | $145,000 | $121 | 34 |
| 1304 South Ave | 0.68mi | 2/1.0 | 1,130 (-13%) | 15mo | $105,000 | $93 | 34 |
| 900 Tip Top St | 0.50mi | 3/1.0 (+1) | 1,459 (+13%) | 20mo | $149,900 | $103 | 34 |
| 1803 Honaker Ave | 0.66mi | 3/1.5 (+1) | 1,416 (+9%) | 18mo | $174,900 | $124 | 32 |
Match score weights: distance 35% · size 25% · config 20% · recency 20%. Top-matched comps best support the ARV.
Projected returns pro-forma
10.0% appreciation · 3.0% rent growth · sell at horizon
- IRR
- 21.2%
- Equity multiple
- 2.72×
- Total profit
- $64,844
- Equity at exit
- $121,529
- IRR
- 19.2%
- Equity multiple
- 6.23×
- Total profit
- $197,674
- Equity at exit
- $262,081
Cash invested: $37,772 (down + closing). Projections, not guarantees.
Landlord ↔ Tenant lean methodology
- Overall (STATE)
- 83 Strongly Landlord-Friendly
- State West Virginia
- 83 Strongly Landlord-Friendly · R+22
- County
- — inherits STATE
- City
- — inherits STATE
ZIP-level market 24740
- Home prices YoY
- 7.1%
- Active inventory
- 48
- Price-to-rent
- 12.1×
Monthly cashflow live
- Estimated rent
- $933 medium interval (Pro) →
- Mortgage (P&I)
- −$707
- Tax from tax record
- −$108 /mo · $1,297/yr
- Insurance
- −$56
- HOA
- −$0
- Vacancy / Maint / Mgmt
- −$196
- Net cashflow
- $-135
Break-even live
Sensitivity live
| Price | -10% $-59 | -5% $-97 | +0% $-135 | +5% $-173 | +10% $-211 |
|---|---|---|---|---|---|
| Rent | -10% $-209 | -5% $-172 | +0% $-135 | +5% $-98 | +10% $-61 |
| Rate | -1.0pp $-67 | -0.5pp $-101 | base $-135 | +0.5pp $-170 | +1.0pp $-206 |
UW: 25.0% down · 7.5% · 30yr · 1.5% tax · 5.0% vac · 8.0% maint · 8.0% mgmt
Financing live
Cash to close
- Down payment
- $33,725
- Closing costs
- $4,047
- Reserves months
- —
- Total cash needed
- —
Loan-product check · same deal, 3 products live
Conventional
25% down · 7.5% · 30yr
- Down + closing
- —
- Monthly P&I
- —
- Monthly cashflow
- —
- DSCR
- —
- Eligible?
- —
Personal DTI + credit; lowest rate.
DSCR
20% down · 8.5% · 30yr
- Down + closing
- —
- Monthly P&I
- —
- Monthly cashflow
- —
- DSCR
- —
- Eligible?
- —
No personal income docs; deal must DSCR.
Hard money
10% down · 12.0% · 12mo
- Down + closing
- —
- Monthly P&I
- —
- Monthly cashflow
- —
- DSCR
- —
- Eligible?
- —
Short-term bridge; refi at stabilization.
Listing history 6 events
-
2026-04-30status Pending
-
2026-03-21price $134,900
-
2026-02-13price $144,900
-
2026-01-01price $149,900
-
2025-12-11$159,900 Active
-
1973-06-15soldstatus $18,000
ⓘ Source: listings_history table (triggers on properties + properties_extension) + one-shot
backfill from property_details.listing_events for pre-trigger history.
Tax reassessment forecast WV · Resets to sale price
- Current annual tax
- $1,297 · $108/mo
- Projected year-2 tax
- $1,297 · $108/mo
- Expected delta
- $0/yr ($0/mo · 0.0%)
ⓘ Screening estimate from a state-policy table — verify with the county assessor before closing.
Climate risk First Street
- Flood 1/10 Low FEMA zone X (unshaded) · 0% chance over 30 yrs
- Wildfire 3/10 Moderate
- Heat 3/10 Moderate 7 d/yr ≥91°F today · 22 d/yr by 30 yrs out
- Wind 2/10 Low
- Air quality 1/10 Low 0 unhealthy d/yr today · 0 by 30 yrs out
Nearby sold comps map
Loading sold comps map…
Walkable amenities ~0.75 mi
Loading nearby amenities…
Taxation est. · year 1
- Rental income
- $11,190
- − Mortgage interest
- −$7,556
- − Property taxes
- −$1,297
- − Insurance
- −$674
- − Repairs & maintenance
- −$895
- − Management
- −$895
- − Depreciation
- −$3,924
- Taxable loss
- −$4,053
- Est. tax savings @ 24.0%
- +$973
- After-tax cash flow
- $-648/yr
For passive investors: Depreciation is non-cash, so a rental often shows a tax loss while cash-flowing — sheltering income. Rental losses are passive: they offset passive income freely, and up to $25,000/yr can offset ordinary (W-2) income if you actively participate and your MAGI is under $100k (phasing out to $0 by $150k); unused losses carry forward. On sale, claimed depreciation is recaptured at up to 25%, and gains may owe capital-gains tax (a 1031 exchange can defer both). Figures are a year-1 estimate at your 24.0% rate — not tax advice; consult a CPA.
Schools (NCES district)
- District
- Mercer County Schools
- NCES district ID
- 5400840
- Math proficiency
- 26% ▼ -13.00%
- Reading proficiency
- 37% ▼ -6.00%
- Median HH income
- $35,064
- Composite
- 25.98/100
- National rank
- #7325
- State rank
- #28 of 55 in WV
Livability — Princeton
- Score
- 72/100
- State rank
- #53
- US rank
- #6278
Category grades
Schools grade is shown separately in the Schools card above.
Census & demographics
- Census place
- Princeton, WV
- County
- Mercer County · 33,615 people
- City population
- 16,498
- Metro
- Bluefield, WV-VA
- Population (ZIP)
- 16,498
- Household income
- $44,793
- Rent vs Own
- Severe rent burden
- 438.0
Population outlook (Mercer County) Hauer SSP2
- Today (2025)
- 57,860 people
- By 2030
- 55,781 · -3.6%
- By 2040
- 51,365 · -11.2%
- By 2050
- 47,476 · -17.9%
- By 2075
- 38,851 · -32.9%
- By 2100
- 30,053 · -48.1%
Race, ethnicity, and origin ACS 2023
- Neighborhood character
- Predominantly White (89%)
- Race & ethnicity
- White 89% Two or more races 7% Black 3% Hispanic / Latino 1%
- Common ancestry
- Serbian 2% Slovak 1% Italian 1%
- Foreign-born
- 1%
- Languages at home
- 98% English-only · Arabic 1%
Political lean MEDSL · Mercer
- 2024 margin
- Solid R (+57.3) · D 20.6% · R 77.9% · Other 1.5%
- 2008→2024 swing
- -29.8pp toward R · 2008: -27.6pp · 2024: -57.3pp
- All cycles
- 2024: R+57.3 2020: R+54.4 2016: R+55.3 2012: R+47.1 2008: R+27.6
Not yet ingested
- Civics
- —
Market trends
- HPI YoY
- ▲ 14.67%
- Current HPI
- 220.0694
- Rent YoY
- —
- Metro
- Bluefield, WV-VA
- State GDP YoY
- —
- F500 in state
- 0
Price history
+649.4% since first listed6 events — show timeline
- 2026-04-30 Pending — GVBOR
- 2026-03-21 Price Changed $134,900 GVBOR
- 2026-02-13 Price Changed $144,900 GVBOR
- 2026-01-01 Price Changed $149,900 GVBOR
- 2025-12-11 Listed $159,900 GVBOR
- 1973-06-15 Sold (Public Records) $18,000 Public Records
Property tax history
+29.3%/yrLatest (2025): $1,297 · +236.2% YoY. Source: county tax records.
Cash-flow waterfall
monthlySold comps — $/sqft
last 12 mo · ≤1 miLoading sold comps…