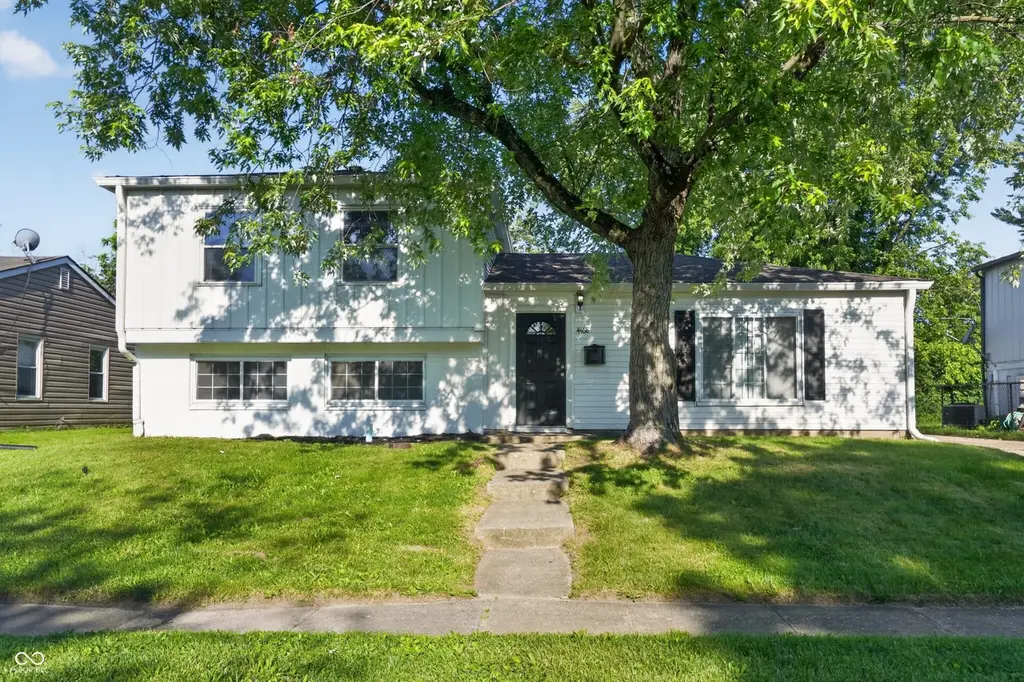
4468 Barnor Dr · Indianapolis city (balance), IN
Flood risk 1/10 · Minimal
- FEMA flood zone
- X (unshaded)
- Chance of flooding over 30 yrs
- 0.0%
- Est. flood insurance / yr
- $507 – $1,088
Fire risk 1/10 · Minimal
- Est. fire insurance / yr
- $717 – $1,331
Heat risk 4/10 · Minor
- Hot days now (above 101°F)
- 7 days/yr
- Hot days in 30 yrs
- 18 days/yr
Wind risk 2/10 · Minimal
- Chance of severe wind over 30 yrs
- 0.0%
Air-quality risk 4/10 · Minor
- Unhealthy air days now
- 5 days/yr
- Unhealthy air days in 30 yrs
- 7 days/yr
Risk factors via First Street. Map © Google.
Why this score? — see what drove the D grade
The composite is a weighted blend of 9 inputs, each scored 0–100. Each bar is that input's sub-score; the figure is the points it added to the 100-point composite (weight × sub-score).
- Cash flow +13.7/30.0
- ARV discount +11.4/15.0
- Rent growth +4.2/5.0
- DSCR +4.1/10.0
- 1% rule +4.0/10.0
- Livability +2.5/5.0
- Condition / age +2.5/5.0
- Schools +1.4/10.0
- Appreciation +0.0/10.0
$174,900
🖨 Deal sheet (PDF) 📄 Offer letter ✓ Due diligence
Listing remarks MLS
Nice 3 bedroom, 2 full bath tri-level home and fenced rear with mini barn. Very nice home, just needs a little TLC and lots of furnishing and clothing inside. Imagine what you can do with this open floor plan home located at the entrance of a culdesac.
Key facts
- Multi-level design
- Mini-barn
- Quiet cul-de-sac
Tags
Property features AI
Exterior
- Parking: Detached 2-car garage (576 sq ft)
- Security: Smoke detector(s)
- Utilities: Public water; Municipal sewer; Cable connected
- Home design: Single-family residence; One-and-a-half story
- Construction: Vinyl siding and brick exterior; Foundation: see remarks
- Exterior features: Mini barn; Storage shed; Sidewalks; Has a view
Interior
- Kitchen: Refrigerator; Range hood
- Bedrooms: Three bedrooms on the upper level
- Bathrooms: Two full bathrooms (both on the upper level)
- Heating & cooling: Forced air heating (natural gas); Central air conditioning
- Interior features: Smoke detectors; Water heater (gas); Range hood
- Laundry & utility: Gas water heater
Neighborhood map
What this means for you Summary
Snapshot
- This is a 3-bed/1.0-bath single-family listed at $175k.
Deal economics
- At list price, monthly cash flow is $12 ($144/yr) — positive.
- The deal already cash-flows at list — no discount required.
- To meet the 1% rule (rent ≥ 1% of price), the offer needs to be $157k (10.0% below list).
- Recommended offer: $157k (10.0% below list) — sets the bar for 1% rule.
- Cap rate 6.4% vs local median 4.4% in Indianapolis city (balance) — top-decile yield for the area; either an underpriced asset or a hidden risk that comps aren't pricing in. Stress-test before assuming the spread holds.
Location & tenants
- Location reads: area grade D — affects rentability + tenant quality, not the cash-flow math above.
- Indianapolis Public Schools (urban): math 14% / reading 20% proficiency, ranked #286 of 301 in IN (top 95%) — low school quality limits family demand, transient renter base, plan for 1-2y turnover; 77% free/reduced lunch — lower-income household profile, screen leases tightly.
- Zoned schools: Charles Warren Fairbanks Sch 105 (math 2% / reading 8%, grade F, #970 of 994 statewide, top 99%, 313 students, 78% FRL); H L Harshman Middle School (math 3% / reading 16%, grade F, #316 of 330 statewide, top 96%, 549 students, 84% FRL); Shortridge High School (math 20% / reading 51%, grade F, #263 of 369 statewide, top 72%, 1,089 students, 70% FRL) — zoned schools at 77% FRL track the district average.
- Market conditions: Rents rising fast (+6.8%/yr); 153 active listings in the ZIP; 11 comparable units currently listed for rent nearby; rentals leasing fast (median 6d on market — plan ~1-2 weeks tenant-placement turnaround); 1,906 units permitted in Marion County in 2024 (621 in 5+ unit buildings).
- This rent runs 38% of the median local income ($50k/yr) — at the standard rent-burdened threshold; future hikes will face affordability resistance.
Forward outlook
- Local home prices are declining (-3.0%/yr); year-one equity from $1k of loan paydown is wiped out by about $5k of value loss. Plan a longer hold.
- Marion County population projected at +18% by 2050 — long-run rental-demand tailwind backs the buy-and-hold thesis.
Negotiation context
- Only 13 days on market — expect competitive offers; lowballing is unlikely to land.
- 4 sale attempts since 21y ago with the ask held roughly flat each time — persistent listings suggest the price (not the market) is what's stuck; bring a comps-based counter.
- Current owner paid $78k; list at $175k implies a 124% gain — meaningful room to come down on a strong offer.
Questions for the listing agent
- Built in 1960 — when were the roof, HVAC, electrical panel, plumbing, and water heater last replaced?
- Is there a deadline driving the sale (1031 exchange, divorce, estate, relocation)? That informs how much negotiation room exists.
- The area grade is low — what's the realistic commute time and amenity access for the typical tenant pool here? Any planned neighborhood developments (good or bad) we should know about?
- What's the average days-on-market for RENTAL listings here right now (not sales)? A rising rental-DOM trend means longer vacancies and softer asking-rent achievability than the comps imply.
- What's the recent tenant-quality profile in this submarket — average credit score on applications, eviction rate, late-payment / NSF rate, and stable-employment percentage? A property-management company in the area should have these aggregated.
- How much new for-sale + rental construction is in the pipeline within 1–3 miles? Heavy new supply typically softens prices + rents 12–24 months out; constrained supply supports both.
Investment metrics
- 1% rule
- 0.90% ✗
- Cap rate
- 6.38%
- Cash-on-cash
- 0.29%
- DSCR
- 1.01
- GRM
- 9.3
CMA / ARV
- ARV (on-the-fly)
- $191,520
- Comps found
- 12
Show comp detail 12 sales within ~0.75 mi
| Address | Dist | Beds/Ba | Sqft | Sold | Price | $/sf | Match |
|---|---|---|---|---|---|---|---|
| 4463 Campbell Ave | 0.26mi | 3/1.5 | 1,594 (-5%) | 4mo | $76,000 | $48 | 74 |
| 6149 Woodfox Ct | 0.20mi | 3/2.0 | 1,560 (-7%) | 3mo | $174,900 | $112 | 72 |
| 4428 N Bolton Ave | 0.38mi | 3/1.5 | 1,540 (-8%) | 0mo | $219,900 | $143 | 66 |
| 6402 E Meadowlark Dr | 0.30mi | 4/2.0 (+1) | 1,580 (-6%) | 5mo | $175,000 | $111 | 63 |
| 6647 E 45th St | 0.44mi | 4/1.5 (+1) | 1,736 (+3%) | 7mo | $133,000 | $77 | 61 |
| 6160 E 43rd St | 0.29mi | 3/1.5 | 1,440 (-14%) | 5mo | $179,000 | $124 | 57 |
| 6134 Marilyn Rd | 0.44mi | 4/2.0 (+1) | 1,514 (-10%) | 2mo | $173,000 | $114 | 52 |
| 6143 E 43rd St | 0.31mi | 4/2.0 (+1) | 1,443 (-14%) | 10mo | $214,500 | $149 | 45 |
| 4128 N Webster Ave | 0.48mi | 4/2.0 (+1) | 1,924 (+14%) | 2mo | $195,000 | $101 | 43 |
| 5221 Moonlight Dr | 0.71mi | 3/2.0 | 1,848 (+10%) | 6mo | $280,000 | $152 | 41 |
| 4023 N Arlington Ave | 0.62mi | 4/1.5 (+1) | 1,532 (-9%) | 11mo | $222,000 | $145 | 40 |
| 6117 Marilyn Rd | 0.47mi | 4/2.0 (+1) | 1,924 (+14%) | 7mo | $173,000 | $90 | 39 |
Match score weights: distance 35% · size 25% · config 20% · recency 20%. Top-matched comps best support the ARV.
Projected returns pro-forma
-3.0% appreciation · 6.76% rent growth · sell at horizon
- IRR
- -11.6%
- Equity multiple
- 0.56×
- Total profit
- $-21,363
- Equity at exit
- $26,078
- IRR
- 2.4%
- Equity multiple
- 1.20×
- Total profit
- $9,924
- Equity at exit
- $15,122
Cash invested: $48,972 (down + closing). Projections, not guarantees.
Landlord ↔ Tenant lean methodology
- Overall (STATE)
- 90 Strongly Landlord-Friendly
- State Indiana
- 90 Strongly Landlord-Friendly · R+11
- County
- — inherits STATE
- City
- — inherits STATE
ZIP-level market 46226
- Rents YoY
- 6.8%
- Active inventory
- 153
- Price-to-rent
- 9.3×
Monthly cashflow live
- Estimated rent
- $1,573 high interval (Pro) →
- Mortgage (P&I)
- −$917
- Tax from tax record
- −$241 /mo · $2,892/yr
- Insurance
- −$73
- HOA
- −$0
- Vacancy / Maint / Mgmt
- −$330
- Net cashflow
- $12
Break-even live
Sensitivity live
| Price | -10% $111 | -5% $61 | +0% $12 | +5% $-38 | +10% $-87 |
|---|---|---|---|---|---|
| Rent | -10% $-112 | -5% $-50 | +0% $12 | +5% $74 | +10% $136 |
| Rate | -1.0pp $100 | -0.5pp $56 | base $12 | +0.5pp $-33 | +1.0pp $-79 |
UW: 25.0% down · 7.5% · 30yr · 1.5% tax · 5.0% vac · 8.0% maint · 8.0% mgmt
Financing live
Cash to close
- Down payment
- $43,725
- Closing costs
- $5,247
- Reserves months
- —
- Total cash needed
- —
Loan-product check · same deal, 3 products live
Conventional
25% down · 7.5% · 30yr
- Down + closing
- —
- Monthly P&I
- —
- Monthly cashflow
- —
- DSCR
- —
- Eligible?
- —
Personal DTI + credit; lowest rate.
DSCR
20% down · 8.5% · 30yr
- Down + closing
- —
- Monthly P&I
- —
- Monthly cashflow
- —
- DSCR
- —
- Eligible?
- —
No personal income docs; deal must DSCR.
Hard money
10% down · 12.0% · 12mo
- Down + closing
- —
- Monthly P&I
- —
- Monthly cashflow
- —
- DSCR
- —
- Eligible?
- —
Short-term bridge; refi at stabilization.
Rent comps 11 comps
| Address | Beds | Baths | Sqft | Rent | $/sqft | DOM | Units | Dist |
|---|---|---|---|---|---|---|---|---|
| 4511 N Kenmore Rd Indianapolis, IN | 4.0 | 2.0 | 1200 | $2,095 | $1.75 | 6d | 1 | 0.17mi |
| 4555 N Arlington Ave Indianapolis, IN | 1.0–3.0 | 1.0–1.5 | 880 | $1,379 | $1.57 | 5d | 30 | 0.19mi |
| 6563 E 46th St Indianapolis, IN | 3.0 | 1.5 | 1185 | $1,250 | $1.05 | 6d | 1 | 0.30mi |
| 4839 N Kenmore Rd Indianapolis, IN | 3.0 | 2.0 | 1215 | $1,533 | $1.26 | 23d | 1 | 0.37mi |
| 5865 E 46th St Indianapolis, IN | 3.0 | 2.0 | 1400 | $1,500 | $1.07 | 45d | 1 | 0.37mi |
| 4176 N Irwin Ave Indianapolis, IN | 4.0 | 2.0 | 2006 | $1,595 | $0.80 | 23d | 1 | 0.63mi |
| 3912 N Webster Ave Indianapolis, IN | 4.0 | 1.0 | 1274 | $1,350 | $1.06 | 23d | 1 | 0.75mi |
| 3900 N Shadeland Ave Indianapolis, IN | 1.0–2.0 | 1.0 | 1070 | $1,075 | $1.00 | 4d | 6 | 1.00mi |
| 5116 Wexford Rd Indianapolis, IN | 4.0 | 2.0 | 1938 | $2,045 | $1.06 | 6d | 1 | 1.11mi |
| 3710 N Layman Ave Indianapolis, IN | 3.0 | 1.5 | 1638 | $1,500 | $0.92 | 0d | 1 | 1.22mi |
| 3775 Allerton Pl Indianapolis, IN | 1.0–4.0 | 2.0 | 1068 | $1,617 | $1.51 | 15d | 1 | 1.38mi |
Listing history 11 events
-
2026-06-18status $174,900 Pending 13 DOM
-
2026-06-18days on market $174,900 Active 13 DOM
-
2026-06-17days on market $174,900 Active 12 DOM
-
2026-06-16days on market $174,900 Active 11 DOM
-
2026-06-15days on market $174,900 Active 10 DOM
-
2026-06-13days on market $174,900 Active 8 DOM
-
2026-06-13days on market $174,900 Active 7 DOM
-
2026-06-09days on market $174,900 Active 4 DOM
-
2026-06-08days on market $174,900 Active 3 DOM
-
2026-06-07remarks 699-char remark
-
2026-06-07$174,900 Active 2 DOM
ⓘ Source: listings_history table (triggers on properties + properties_extension) + one-shot
backfill from property_details.listing_events for pre-trigger history.
Tax reassessment forecast IN · Partial reset (capped growth)
- Current annual tax
- $2,892 · $241/mo
- Projected year-2 tax
- $2,892 · $241/mo
- Expected delta
- $0/yr ($0/mo · 0.0%)
ⓘ Screening estimate from a state-policy table — verify with the county assessor before closing.
Climate risk First Street
- Flood 1/10 Low FEMA zone X (unshaded) · 0% chance over 30 yrs
- Wildfire 1/10 Low
- Heat 4/10 Moderate 7 d/yr ≥101°F today · 18 d/yr by 30 yrs out
- Wind 2/10 Low 0% chance of damaging wind over 30 yrs
- Air quality 4/10 Moderate 5 unhealthy d/yr today · 7 by 30 yrs out
Nearby sold comps map
Loading sold comps map…
Walkable amenities ~0.75 mi
Loading nearby amenities…
Taxation est. · year 1
- Rental income
- $18,882
- − Mortgage interest
- −$9,797
- − Property taxes
- −$2,892
- − Insurance
- −$874
- − Repairs & maintenance
- −$1,511
- − Management
- −$1,511
- − Depreciation
- −$5,088
- Taxable loss
- −$2,791
- Est. tax savings @ 24.0%
- +$670
- After-tax cash flow
- $814/yr
For passive investors: Depreciation is non-cash, so a rental often shows a tax loss while cash-flowing — sheltering income. Rental losses are passive: they offset passive income freely, and up to $25,000/yr can offset ordinary (W-2) income if you actively participate and your MAGI is under $100k (phasing out to $0 by $150k); unused losses carry forward. On sale, claimed depreciation is recaptured at up to 25%, and gains may owe capital-gains tax (a 1031 exchange can defer both). Figures are a year-1 estimate at your 24.0% rate — not tax advice; consult a CPA.
Schools (NCES district)
- District
- Indianapolis Public Schools
- NCES district ID
- 1804770
- Math proficiency
- 14% ▼ -7.00%
- Reading proficiency
- 20% ▼ -3.00%
- Median HH income
- $32,034
- Composite
- 13.69/100
- National rank
- #9499
- State rank
- #286 of 301 in IN
Livability — Indianapolis city (balance)
No livability data for this city. (Only ~50 U.S. cities are tracked.)
Census & demographics
- Census place
- Indianapolis city (balance), IN
- County
- Marion County · 998,460 people
- City population
- 881,119
- Metro
- Indianapolis-Carmel-Anderson, IN
- Population (ZIP)
- 47,099
- Household income
- $50,325
- Rent vs Own
- Severe rent burden
- 2742.0
Population outlook (Marion County) Hauer SSP2
- Today (2025)
- 1,025,572 people
- By 2030
- 1,065,727 · +3.9%
- By 2040
- 1,141,577 · +11.3%
- By 2050
- 1,208,920 · +17.9%
- By 2075
- 1,367,288 · +33.3%
- By 2100
- 1,438,201 · +40.2%
Race, ethnicity, and origin ACS 2023
- Neighborhood character
- Diverse neighborhood (Simpson 0.62)
- Race & ethnicity
- Black 53% White 25% Hispanic / Latino 17% Two or more races 9% Asian 2%
- Hispanic origin (detail)
- Mexican 11%
- Common ancestry
- Lithuanian 1% Italian 1% Romanian 1%
- Foreign-born
- 11% · Canada
- Languages at home
- 86% English-only · Spanish 10% French/Haitian/Cajun 1% Other Asian/Pacific 1%
Political lean MEDSL · Marion
- 2024 margin
- Strong D (+27.7) · D 63.0% · R 35.3% · Other 1.7%
- 2008→2024 swing
- -0.7pp no change · 2008: 28.4pp · 2024: 27.7pp
- All cycles
- 2024: D+27.7 2020: D+29.1 2016: D+22.8 2012: D+22.2 2008: D+28.4
Not yet ingested
- Civics
- —
Market trends
- HPI YoY
- ▼ -218.85%
- Current HPI
- 239.43
- Rent YoY
- ▲ 6.76%
- Metro
- Indianapolis-Carmel-Anderson, IN
- State GDP YoY
- ▲ 2.90%
- F500 in state
- 18
Industry mix (Fortune 500 HQ in IN)
| Industry | F500 HQs | Revenue |
|---|---|---|
| Industrial Machinery | 2 | $37B |
|
||
| Healthcare | 1 | $177B |
|
||
| Pharmaceuticals | 1 | $45B |
|
||
| Metals / Steel | 1 | $18B |
|
||
| Agriculture | 1 | $17B |
|
||
| Packaging | 1 | $12B |
|
||
Price history
+92.8% since first listed10 events — show timeline
- 2026-06-05 Listed $174,900 MIBOR as Distributed by MLS Grid
- 2021-07-27 Sold (MLS) $78,000 MIBOR as Distributed by MLS Grid
- 2021-02-12 Pending — MIBOR as Distributed by MLS Grid
- 2021-01-12 Relisted — MIBOR as Distributed by MLS Grid
- 2021-01-01 Listing Removed — MIBOR as Distributed by MLS Grid
- 2020-12-15 Price Changed $95,300 MIBOR as Distributed by MLS Grid
- 2020-12-06 Price Changed $96,300 MIBOR as Distributed by MLS Grid
- 2020-11-13 Listed $99,500 MIBOR as Distributed by MLS Grid
- 2006-02-24 Sold (MLS) $90,522 MIBOR as Distributed by MLS Grid
- 2005-11-07 Listed $90,700 MIBOR as Distributed by MLS Grid
Property tax history
+12.5%/yrLatest (2025): $2,892 · -1.5% YoY. Source: county tax records.
Cash-flow waterfall
monthlySold comps — $/sqft
last 12 mo · ≤1 miLoading sold comps…